
Abstract
The large vertical mill has complicated structure and tens of thousands of parts, which is a critical grinding equipment for slag and cinder. As large vertical mill always works in severe conditions, the on-line monitoring, timely fault diagnosis, and trend prediction are very important guarantees for the safe service and saving maintaining costs. To address this issue, the health management system for large vertical mill is developed. More specifically, in order to manage reservoirs of state-related running data, the intrinsic physic data, and diagnosis knowledge base, an entity-relationship-model-based database is first constructed. Based on the fault diagnosis reasoning of experts, the fault tree is developed and the fault diagnosis rules are derived. Especially, a hybrid condition prognosis method based on backtracking search optimization algorithm and neural network is developed, and in comparison with traditional back propagation neural network and ant colony neural network, the developed backtracking search optimization algorithm and neural network gets superior hybrid prediction performance in prediction accuracy and training efficiency. Finally, the health management system, including the functions of condition monitoring, fault diagnosis, and trend prediction for large vertical mill is implemented using Microsoft Visual Studio C # and Microsoft SQL Server.
Introduction
The large vertical mill is an ideal large-scale grinding equipment. 1 The granular and powdery raw slag and cinder are grinded into the required powdery materials, integrating crushing, drying, and grinding functions. As modern industrial equipment tends to be large-scale, high-automation, and high-efficiency, 2 the unplanned shutdown will cause huge economic losses and bring great security. So, the highly efficacious health management is of great importance. Moreover, due to the complex structure and the harsh working environment, the condition monitoring and fault diagnosis models for vertical mill are relatively scarce. At present, the monitoring system based on Window Control Center (WINCC) and programmable logic controller (PLC) field are popularly used, but it is difficult to achieve automatic and accurate diagnosis for abnormal state. 3
To develop a mechanical fault diagnosis system with excellent performance, many scholars have conducted pioneering and productive work. In terms of the status data storage and management of equipment, Sinha established a wind turbine health monitoring database model to store massive data on wind turbine failures. 4 In order to establish a locomotive state analysis and fault diagnosis system, Zhang et al. 5 designed an optimized database model supporting hundreds of millions of data storage and extremely fast system throughput. In terms of fault diagnosis, Berredjem and Benidir 6 presented a fuzzy expert system for bearing faults diagnosis, and fuzzy rules can be automatically induced from bearing original acquired data. Xu et al. 7 developed a new belief rule-based expert system for fault diagnosis of marine diesel engines, and the initial expert system can be established using expert experience. As can be seen from these articles, developing an expert system is a very efficient fault diagnosis method for large machinery.
Generally, the sensors are installed in the important positions of vertical mill, and the common health management system first collects various data of the equipment with a certain frequency, 4 and then according to expert knowledge or intelligent diagnosis method, it can determine whether the device is in a normal or abnormal state. Furthermore, using the current and historical data to predict the status of the device is more important to ensure the safe operation of the device. At present, the intelligent predictive analyses, such as back propagation (BP) neural network, are commonly used. 8 In practical applications, the initial parameters of the BP neural network tend to cause the network to converge slowly and fall into local extremum. 9 Although some improved algorithms can refrain from the local minimum value and greatly improve the predicted precision,10,11 many parameters need to be set in advance, and the low convergence speed results in the long training time of the model.
In order to develop the health management system for large vertical mill, based on the analysis of data flow of state monitoring and fault diagnosis, this article constructs an E-R model for the large vertical mill data related to condition monitoring and fault diagnosis, and a database management system is developed. Based on the expert fault diagnosis reasoning process, the fault tree of vertical mill fault diagnosis is built and the diagnosis rules are deduced. Especially, based on the backtracking search optimization algorithm (BSA), an improved neural network trend prediction method, backtracking search optimization algorithm based neural network (BSA-NN), is developed. Finally, a fault diagnosis and trend prediction system for large vertical mill is developed using Microsoft Visual Studio C # and Microsoft SQL Server.
Data management system design
Database requirement analysis
The database is an essential prerequisite and provides a crucial support for health management system of large vertical mill, which provides the function of data storage and data sharing. The health management system relies on a great deal of sensors to collect the condition data, and preprocesses the relevant data into a data format that the system can recognize.12–14 The processed data are sequentially input into condition monitoring module, fault diagnosis module, and trend prediction module. The data processing module implements data fusion, data conversion, and features extraction. 13 Then, the condition monitoring module performs the identification of the health state and provides the alarm information. The fault diagnosis is started by alarm module or users, and determines the cause of fault using expert system or other diagnosis modules. Furthermore, the trend prediction predicts the data trend using the relevant historical data. The use case diagram of the system is shown in Figure 1, and the data flow is shown in Figure 2. A use case is a description of a set of action sequences, and the system provides an observable result for the participator through the execution of this set of action sequences. The interaction between two model elements (a use case and a use case or a participator) is a relationship. A solid line with a solid arrow indicates that there is a relationship between the two related sides. That is, the communication can be established between the two sides. Information can flow in both directions, and the arrow points to the initiator of the flow of information. A solid line with a hollow arrow represents a generalized relationship between one general model element and another specific model element. Furthermore, a dashed line with an arrow indicates that the two relative sides have dependencies, and changes in one affect the other. The database mainly stores the following data:
Status data. The system monitors the essential parts of hydraulic system, mechanical system, electrical, and other systems. System condition data collected mainly consist of pressure, vibration, current, voltage, flow, and so on. According to the needs of monitoring, the samples are collected with a certain sampling frequency on the basis of reasonable planning of measuring points.
Intrinsic information of the health status. The intrinsic parameter includes equipment information and the alarm correlated information, such as alarm threshold, which is utilized for various alarms. The alarm is conducted by mapping the collected signal to the corresponding intrinsic information.
Expert knowledge. The knowledge base consists of fact bases and rules, including the fault phenomena and fault conclusions. Once an abnormal state is detected, the expert diagnosis system is started to match the corresponding rules in knowledge base, and gives the diagnosis result and maintain suggestion.
Users information. Authentication is performed for different users, and different types of users are set different authorities. For example, the general maintenance staff “User” can only have the query qualification on the related sensors, equipment, fault phenomenon, fault conclusion, and other information, and “Expert” users have the authority to maintain the diagnosis rules.

Use case diagram of health management system for large vertical mill.
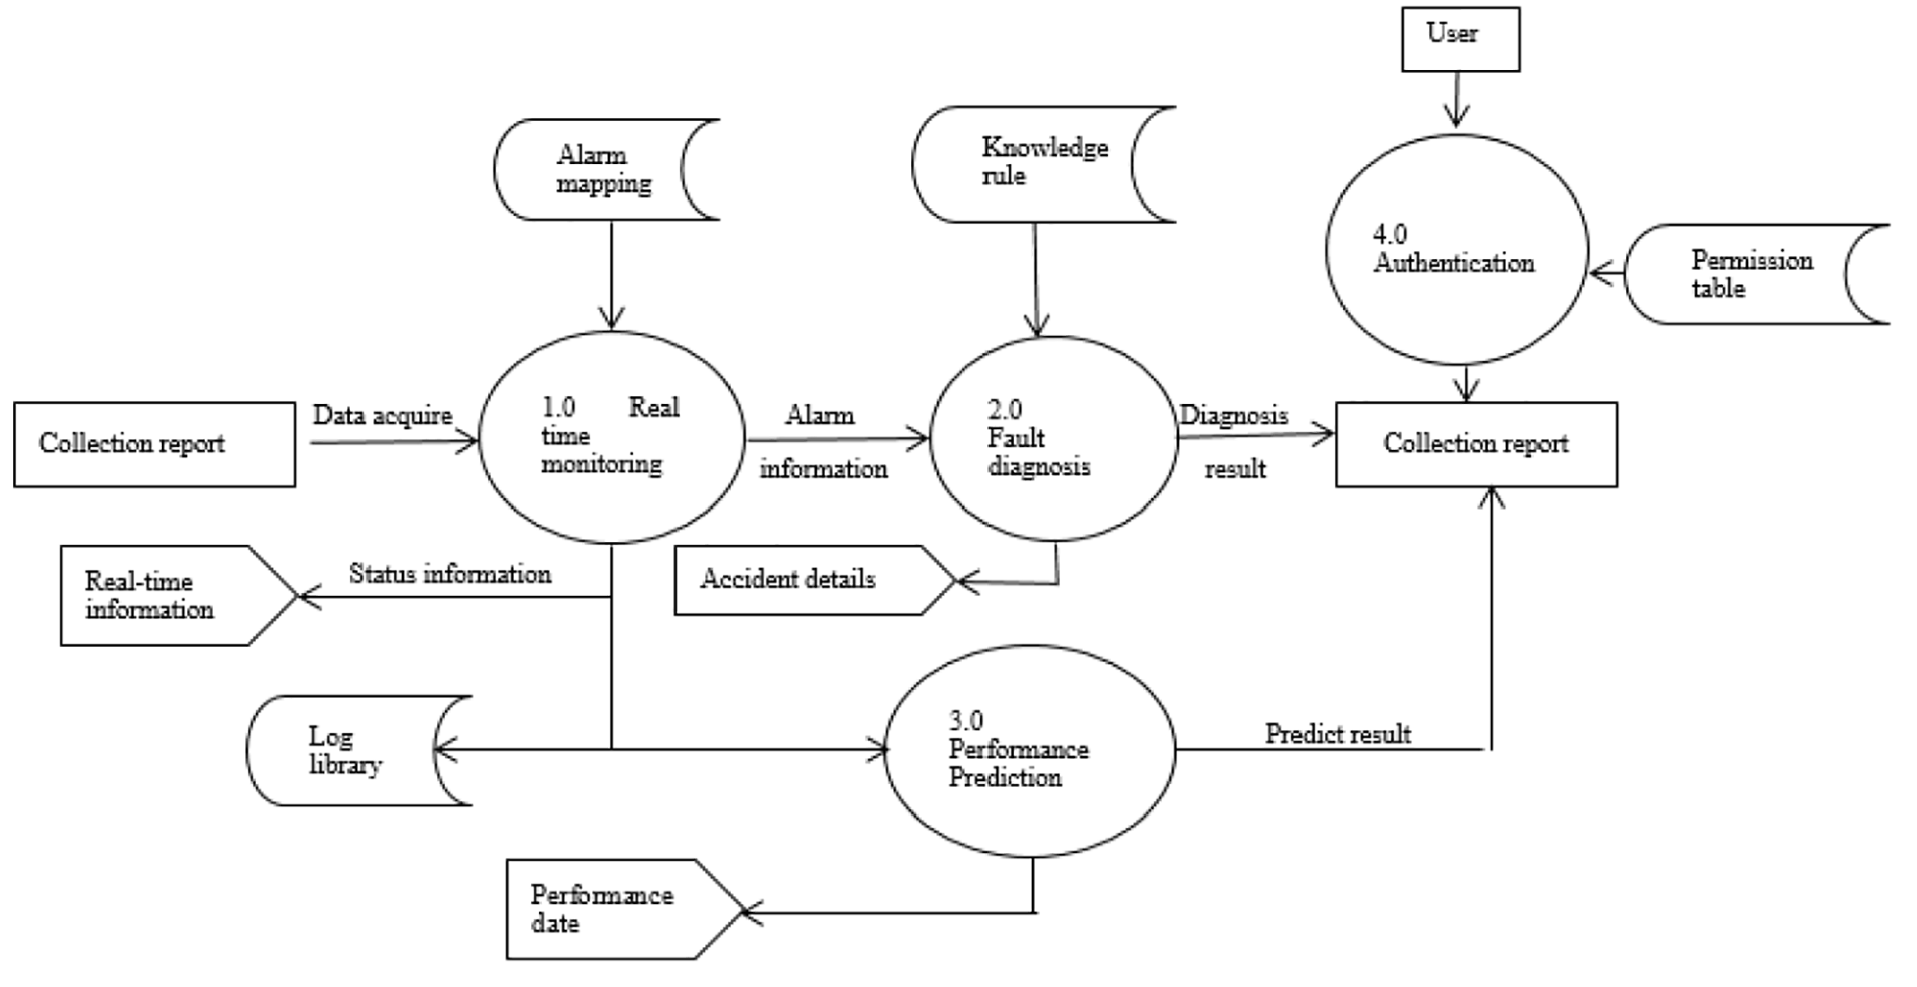
Data flow diagram of health management system for large vertical mill.
Database entity-relationship (E-R) model
In order to facilitate data management, the tables are grouped into four databases, which are historical database, certificate database, expert knowledge base, and user information base. The intrinsic link between the four databases is shown in Figure 3. The certificate database stores data directly related to the operating state of the device, such as different levels of alarm thresholds. The history database stores historical running data of related devices in the device information base. The expert knowledge base stores rules that are provided by the experts and deduced from the fault tree, as well as new rules that are mined from device historical data and confirmed by the field experts; therefore, the expert knowledge base is a dynamic database.

The composition of the health management system database and the relationship between each other.
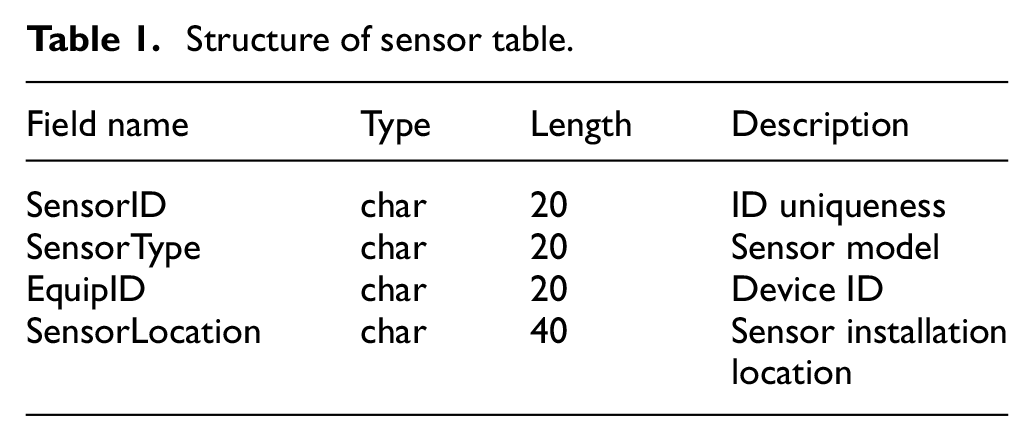
There are three important relationships in the E-R model: entity, attribute, and relation. According to the total data flow diagram of the system, the entity analysis is first performed. An entity is a real or virtual object, such as “user,”“device,” and “sensor.” Each entity has multiple attributes. There are different relations between entities. For example, a “user” can operate multiple devices, and a “device” can also be operated by multiple users. Therefore, there is a many-to-many relationship between “user” and “device.” One device may have multiple sensors, but one sensor is only installed in one device, so the relationship of “device” and “sensor” is one-to-many. According to the system data flow and the relationship between entities, the following E-R model is established, as shown in Figure 4. Referring to the E-R model, the physical design of the database is implemented by a list of tables, such as the specific entity table and the relationship table between the entities. For example, the “Sensor table” shown in Table 1 is an entity table, the three fields, including “SensorType,”“EquipID,” and “SensorLocation,” constitute the combined keyword of the table.
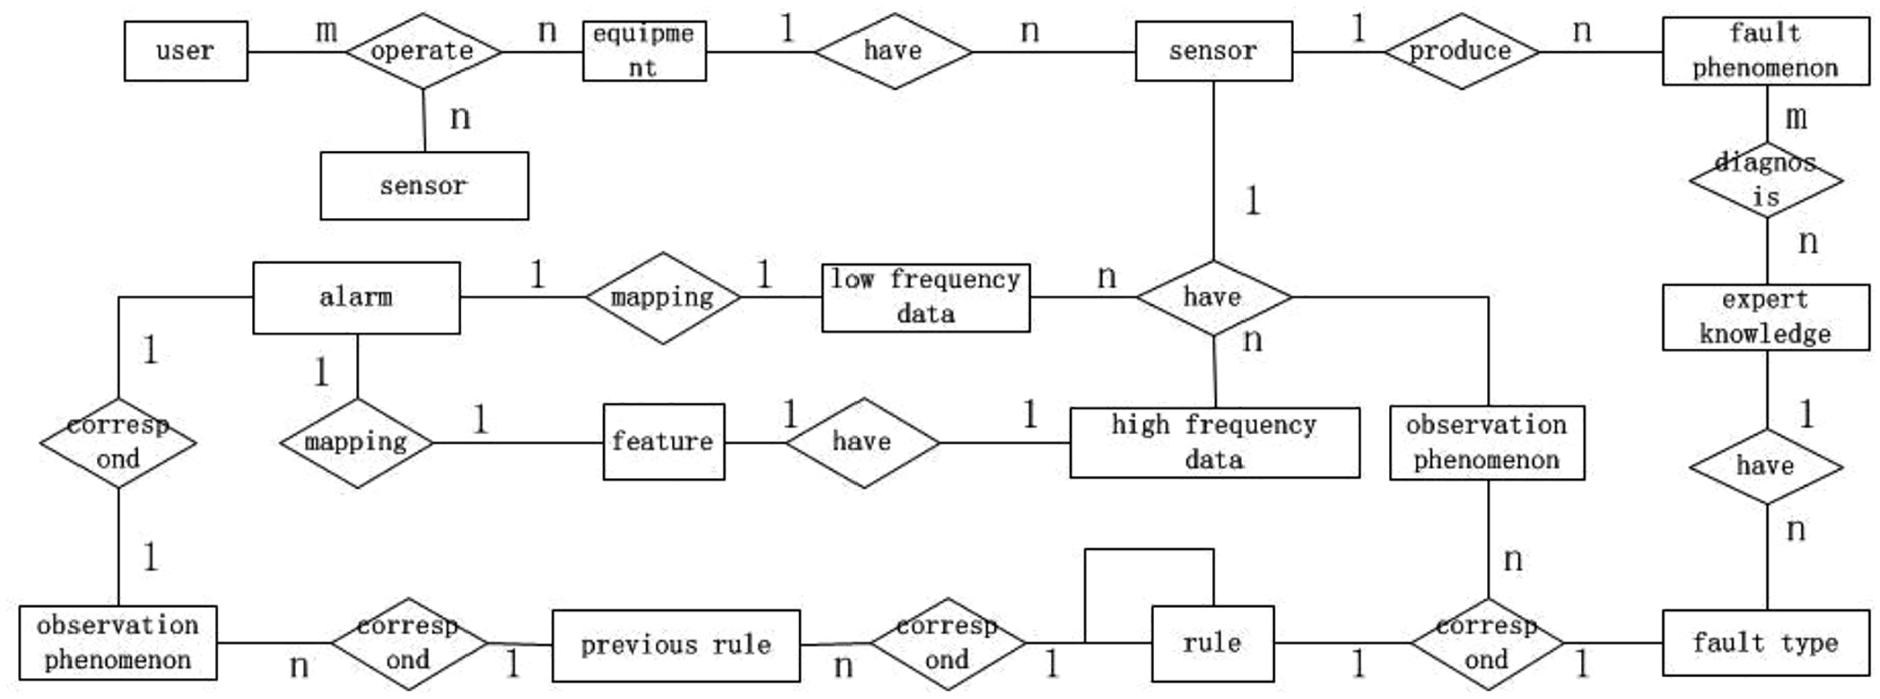
Entity-relationship (E-R) diagram of the health management system.
Structure of sensor table.
Fault diagnosis expert system
The expert knowledge base combines vast amounts of expertise and experience with computer programs, which uses the artificial intelligence to solve difficult fault diagnosis problems through a series of reasoning program and interpreting process. This not only decreases the diagnostic maintenance cost, but also decreases the human resources investment greatly. The expert knowledge base designed in this article consists of two parts: fact base and knowledge base. The former mainly includes the observed phenomenon table and the fault conclusion table. The latter includes the front item table of rule and the rule table. The preconditions of each rule are stored in the front item table, while the number of front item and corresponding fault conclusions are stored in the rule table.
Diagnosis rule extraction
The structure of the large vertical mill is complex. Each fault may be caused by different sources, while one fault source may cause a series of failure phenomena. Taking the “excess vibration” phenomenon as an example, there are four major category sources lead to this phenomenon: raw materials uneven feeding, mechanical structure fault, control system fault, and hydraulic system fault. The fault tree is developed and used to extract diagnosis rules. First, according to expert experience, the fault diagnosis diagram is drawn, as shown in Figure 5, and then the fault tree is constructed as Figure 6. Corresponding to the symbols in the fault tree, the definitions are listed in Table 2.

Fault diagnosis process of “excess vibration” for large vertical mill.

Fault tree for “excess vibration” fault of large vertical mill.
Fault tree symbol definition table.

The diagnosis rules include two types as follows:
From observe phenomenon to direct cause of fault. As shown in Figure 6, X1, X2, or X3 directly leads to M7 occurs. For this case, one phenomenon, X1, X2, or X3 can determine the fault M7. However, in some scenes, more than two phenomena jointly determine one fault. Therefore, for different faults, the quantity of observations may be different.
From one observation to another observation. As the large vertical mill consists of multiple systems, the information transmission in the whole machine is very complex. Once a part has a fault, its collected signal will be abnormal, while some health parts may also present abnormal condition. For example, as shown in Figure 6, if X6 or X7 fails, an excess vibration fault can be generated; furthermore, the abnormal information will also be observed in M2 and M6. So, we can deduce the following rules: If X6 occurs, M3 and M6 occur; if X2 occurs, M1, M4, and M7 occur. Correspondingly, in expert knowledge database, five tables are designed: the rules table, the fault table, the observed phenomenon table, the phenomenon to other phenomenon table, and the front item table.
Large vertical mill signal trend prediction
The sensors are installed in important positions of the vertical mill, and signals are collected with a certain frequency. Using the current and historical data to predict the status of the device is more important to ensure the safe operation of the device. In this section, a BSA-NN is developed to predict the signal trend of large vertical mill.
BSA
The BSA is a new optimization method based on iterative global searching to optimize the point data. It not only has the ability to perform global search across the search space, but also has the ability to find better solutions around the discovered local solutions. The optimization process is implemented with five steps, including initialization, screening I, mutation, crossover, and screening II. At first, the population is randomly generated with the initialization process as a candidate solution for a specific problem. The historical population is generated by screening I, which is used to determine the search direction of the new generation population. Then, in the process of iteration, the historical population is updated according to certain rules. Mutation is an offset to the currently generated solution, and the current solution helps the new generation of populations to find better solutions. The population resulting from the mutation is used as the initial value, the final experimental population is generated by crossover, and the individual with the optimal fitness is used to generate the target population. In the screening II process, individuals in the test population are updated with individuals with better fitness in the test population to generate new populations. The specific flow chart is shown in Figure 7. The detailed BSA procedure can be found in Civicioglu. 15

Flow chart of backtracking search optimization algorithm.
BSA-based neural network prediction algorithm
In order to predict the trend of vertical mill signal with the collected historic signals, the BSA algorithm optimized neural network (BSA-NN) is developed, which consists of the following six steps:
Step 1. Construct a BSA neural network. A three-layer neural network is used in this article. Based on the dimensions of input and output, the node number in the input layer and the output layer can the determined, respectively. Furthermore, the hidden layer and the output layer transfer function, respectively, use the log-sigmoid function and the linear function.
Step 2. Encoding. The BSA algorithm uses the real number coding, and the weight parameters of each layer of the neural network are encoded as overall parameters to determine the search space dimension of the BSA algorithm. Each individual in the population contains all the weights of the neural network. The code length can be calculated with
Step 3. Determine the optimization objective function of the BSA. The mean square error of output is chosen as the optimization objective function

where
Step 4. Initialize the parameters of the BSA. It mainly includes initializing the maximum number of iteration
Step 5. BSA-NN parameters optimization. According to the BSA algorithm optimization process, the historical data are used as the training sample, and the optimal solution is found through the initialization process, screening I, mutation, intersection, and screening II.
Step 6. Prediction. Input the test samples to the obtained BSA-NN model, and the output is the prediction of the specific data series.
BSA-NN training and application
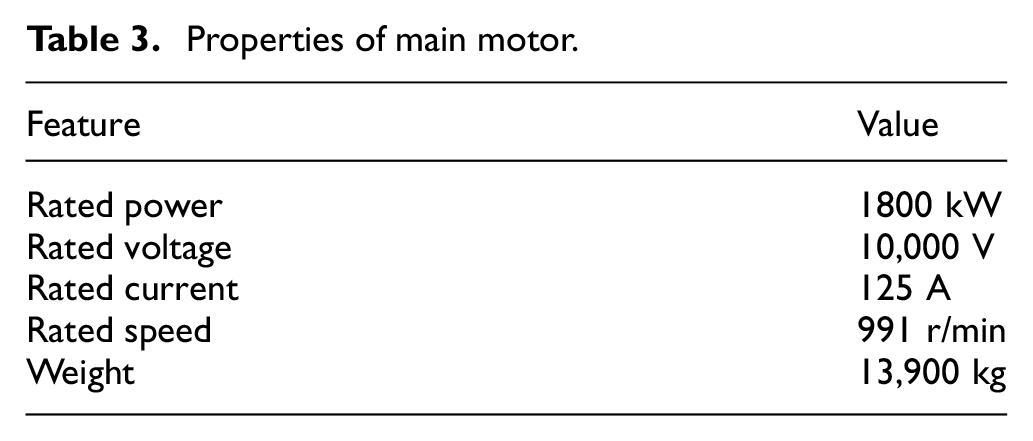
The vertical mill and its schematic diagram are shown in Figure 8. The vertical mill has complex structure, which is composed of mill stand, main motor, gear box, grinding table, rocker arm, grinding roller, powder separator, separator motor, mill outlet, mill feed inlet, hydraulic system, and other components. The motors are indispensable components of the vertical mill, including a main motor for driving gear box and a separator motor for driving powder separator. The main motor YRKK710-6 is a three-phase asynchronous motor, and the properties are shown in Table 3. If the temperature of motor stator exceeds 120°C, the equipment will be in an abnormal state. The sensors are often embedded in the motor to monitor the stator temperature. The effective prediction for the motor temperature trend is very helpful to prevent further serious equipment failure. The stator temperature data of the main motor is used to verify the proposed BSA-NN algorithm.

Vertical mill and its schematic diagram: (a) vertical mill and (b) diagram of vertical mill.
Properties of main motor.
The 200 sets of measuring temperatures for a certain period are considered, and each set consists of six data, so a total of 1200 data are obtained. In order to compare different neural network models, including traditional BP neural network, ant colony neural network (ANT-NN), and the proposed BSA-NN, 80% data (160 sets) are selected as training data randomly, and other 20% data (40 sets) are as test data.
In this article, the current temperature is predicted with the previous six temperatures. A three-layer neural network is used in this article with an input dimension of six, and the node number of hidden layer and output layer is 11 and 1, respectively. Furthermore, the log-sigmoid function “
Training
In the training process, for BSA-NN, the population size is
The error curve of the three methods of training is shown in Figure 9. When the training iteration cycles number reaches 1000 times, the training error for BP neural network, ANT-NN, and BSA-NN reduces to 0.1354, 0.03162, and 0.03166, respectively. The BP neural network gets the worst training effect, and BSA-NN and the developed BSA-NN win comparative training accuracy. However, as for the training time cost compared for the mentioned time series, all experiments are implemented on an Intel Core i7 CPU, 8.0 GB memory, and Windows 8 operating system. The BSA-NN, ANT-NN, and BP neural network take 6.8, 30.7, and 1.4 s, respectively. The developed method is about five times faster than the traditional ANT-NN method.

Training error curve for temperature data of main motor: (a) BP neural network, (b) ANT neural network, and (c) BSA neural network.
Comparison of predicted output accuracy
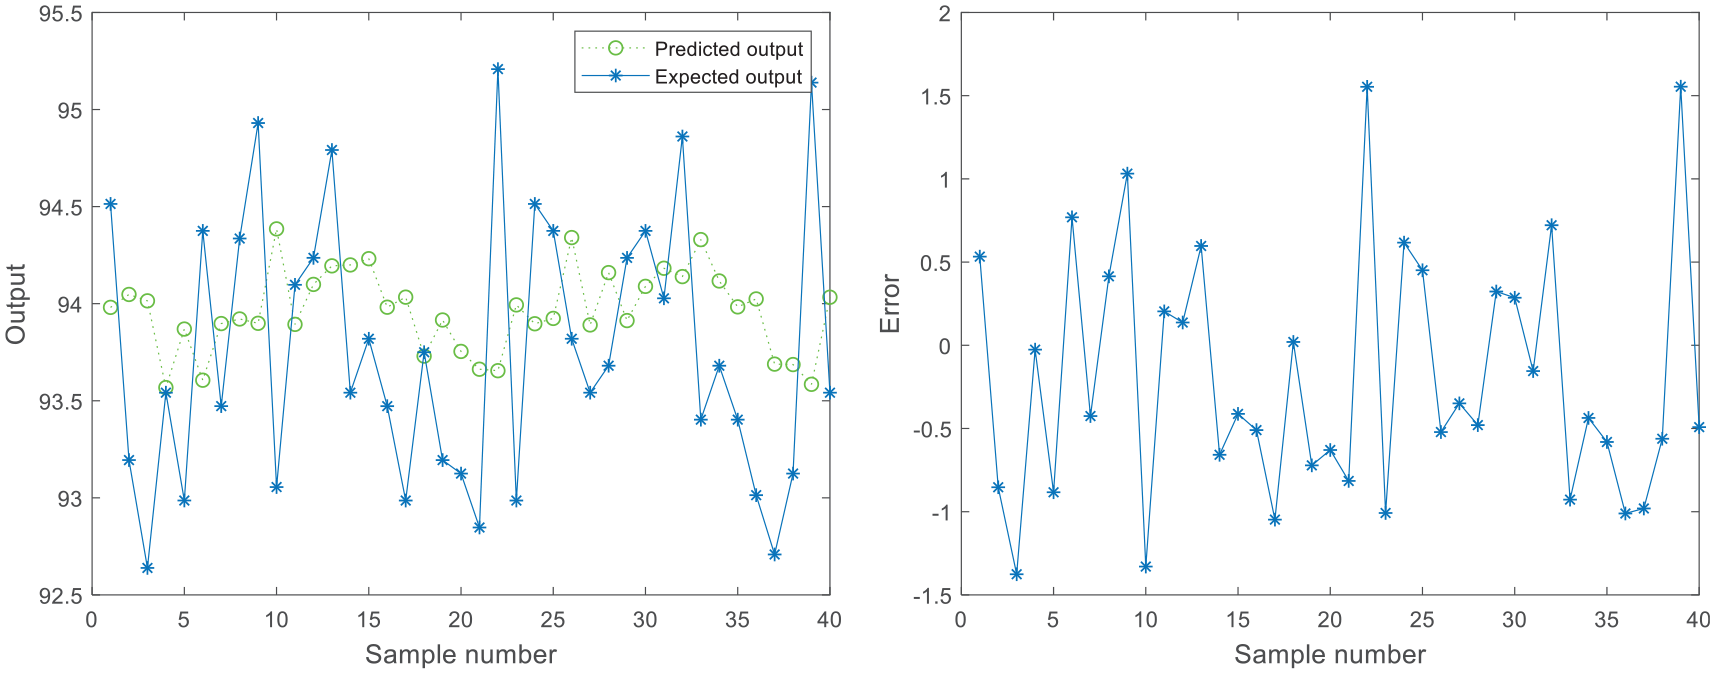
The performance of the model is further analyzed by the prediction results of 40 test data sets. The prediction results and errors of the traditional BP neural network, ANT-NN, and the BSA-NN are shown in Figures 10–12, respectively. The expected output, predictive output, predictive error, and the error percentage for these 40 test data are shown in Table 4; here, error percentage (ep) and

BP neural network output and error of temperature test data of main motor.
ANT neural network output and error of temperature test data of main motor.

BSA neural network output and error of temperature test data of main motor.
Performance comparison of three neural network models.

BP: back propagation; ANT-NN: ant colony neural network; BSA-NN: backtracking search optimization algorithm based neural network.
The effect of different population size in BSA-NN model is also inspected, as shown in Table 5. As the population size increases, the training time is longer, but it is not proportional to the number of population size. In addition, the increase in the population size has a small impact on the prediction accuracy. Only when the population size is very small, corresponding to the temperature data in this section, decreasing to 2, the mean of error percentage is 0.73, and the variance deteriorates to 1.81e−5. A balance between training time and prediction accuracy, a population size of 30 in this article is appropriate.
Effect of different population size in BSA-NN for main motor temperature data.

BSA-NN: backtracking search optimization algorithm based neural network.
Implementation of health management system
Based on the proposed database structure, fault diagnosis model, and trend prediction model, a software platform for health maintain of large vertical mill is developed. This software platform fully integrates the Visual Studio friendly programming interface with C#, the prominent calculation capabilities of MATLAB, and the powerful data manage capabilities of the SQL Server. This platform realizes the function of data management, on-line condition monitoring, fault diagnosis, and trend prediction of large vertical mill.
Database management system
The database named “mill” is implemented in SQL Server 2008, and the database management system is developed with C# in Visual Studio 2018. As shown in Figure 13(a), this is a relationship view. Corresponding to the E-R diagram, the entity and the relationship are materialized as a series of tables. Furthermore, the index and stored procedure are created to improve the performance of the application. In the database management system, all the related functions are implemented in Visual Studio 2018, take the knowledge base management as an example, as shown in Figure 13(b), the left panel is the “Observation” information, and the contents of observation are list in this part, which corresponds to the field “PhenomenonContent” of table “ObservedPhenomena” in Figure 13(a); the right panel is the “Fault phenomenon” information, and the contents of fault are list here, which corresponds to the field “FaultContent” of table “FaultResult” in Figure 13(a); the middle panel region fulfills the function of rule editing, the user can edit the rule with selecting the number of forward items, relationship of forward items, back items, and rule type. Press the “Enter” button, a new rule will be added to knowledge base. For the rule “if the temperature of B-phase in main motor exceeds 120 degrees, then the alarm of B-phase temperature occurs,” the number of forward item is 1, so in the drop-down box of “Number of forward items,” the number “1” is selected. Similarly, the number of back items is also 1. The field of “Rule type” is selected as “from phenomenon to phenomenon,” and the field of “Relation of forward items” is selected as default item. Simultaneously, the content “the temperature of B-phase in main motor exceeds 120 degrees” in the left panel and the content “the alarm of B-phase temperature occurs” in the right panel are selected, respectively, and accordingly they are shown in the textboxes of “Forward items” and “Back items,” respectively. When the “Enter” button is clicked, if there is no repeated item in the knowledge base, this rule will be appended to it.

Database example diagram: (a) view of the entity and the relationship and (b) interface of knowledge base management.
Fault diagnosis process
The diagnosis process mainly contains two steps. (1) According to the alarm, select the corresponding device and determine the abnormal observation type. (2) The system will next call the expert knowledge base, and find all correlate rules that match the abnormal observation (fault) and achieve an accurate diagnosis. The specific interface is shown in Figure 14. Users should select the device where the fault takes place by “Select Device” before initiating a fault diagnosis process, and determine which fault should be diagnosed and when the fault occurs by “Select Fault Content” and “Select Time,” respectively. After click the “Confirm” button, the diagnosis procedure is started, and the diagnosis result, fault time, fault effects, and suggestions are showed in the corresponding textbox when the corresponding buttons are clicked. Furthermore, the user can also check the reasoning process by click the “Start Reasoning” button. Take the fault diagnosis process “excess vibration” as an example, when click the “Confirm” button, the related rules that match this abnormal observation are explored; then, the collect data of the related measurement point are compared with the alarm threshold, the fault causes are determined step and step, which is shown in the textbox of “Reasoning Process” in rule form, and the corresponding sensors information and their collected data are provided in the textbox of “Sensor Parameters.” Simultaneously, the fault cause, fault time, the consequences of the fault, and the related suggestion are also provided by clicking the buttons “Fault Cause,”“Fault Time,”“Fault Effects,” and “Suggestions,” respectively.

Fault diagnosis system of large vertical mill.
Trend predict process
The system has the ability to predict the trend of the acquired data from the vertical mill. The following input parameters are necessary for carrying out the predicting operations. As shown in Figure 15, the input parameters include mill selected, the time duration for predicting, and the data which have to be predicted. Users can select the above information from the interface and start the predict by click the “Trend Predict” button. Once the user starts the predict process, the predict program compiled from MATLAB calls the monitoring data saved in the database and provides the predicted trend without any user intervention, and the practical data and the predicted result are depicted in the interface.

Trend prediction interface of large vertical mill.
Conclusion
The health management system for large vertical mill designed in this article mainly includes expert knowledge base, fault diagnosis, and data trend prediction. According to the health management requirements, a database based on the E-R model was implemented. Based on the knowledge base derived from fault tree, the fault diagnosis expert system is developed. Furthermore, based on the BSA for optimizing the initial parameters of neural network, a BSA neural network prediction model was established to the data prediction. Compared with BP neural network and ANT-NN, the develop BSA neural network has excellent performance in training time and prediction accuracy. Using Microsoft Visual Studio C # and Microsoft SQL Server, a health management system for large vertical mill is developed.
Footnotes
Handling Editor: Edward Bednarz
Author note
Some content of this article was presented in 2018 Prognostics and System Health Management Conference (PHM-Chongqing).
Declaration of conflicting interests
The author(s) declared no potential conflicts of interest with respect to the research, authorship, and/or publication of this article.
Funding
The author(s) disclosed receipt of the following financial support for the research, authorship, and/or publication of this article: This research was funded by the National Nature Science Foundation of China (U1804141), the Program for Science & Technology Innovation Talents in Universities of Henan Province (17HASTIT028), the Scientific and Technological Innovation Team of Colleges and Universities in Henan Province in 2020 (20IRTSTHN015), and the Key Science and Technology Research Project of the Henan Province (202102210086).