
Abstract
The multilayer soil moisture Internet of things sensor is designed to monitor the moisture of multiple soil profiles in real time. Its sensitivity and accuracy are of great concern to improve the performance of sensors. This article introduces the system composition of the end-cloud integrated multilayer soil moisture Internet of things sensor and then focuses on the design of key technologies, such as the moisture detection circuit, the time division multiplexing detection technology, and the deredundancy circuit in the analog–digital integrated design. The performance of the soil moisture detection circuit is directly related to the measurement accuracy of the sensor. A detection method is proposed using a high-frequency double-resonance circuit, which can detect small changes in moisture by changing the circuit detuning voltage. The maximum root mean square error of the calibration is less than 1.35% for five typical soils from different places. Compared with that of an independent detection method, the output consistency of the time division multiplexing detection is significantly improved by using the time division multiplexing detection method, which has a root mean square error of only 0.12%. In order to reduce errors caused by inconsistency in each burial, the gravimetric analysis is used in the sensitivity monitoring test, which shows that small changes in soil moisture can be detected by the circuit.
Keywords
Introduction
A multilayer soil moisture sensor can be used to monitor the moisture content in multiple soil profiles in real time and provide accurate data for the agricultural Internet of things. Its sensitivity and accuracy are of great significance for studying the water requirement of crop roots and for formulating reasonable irrigation strategies. 1
At present, there are many methods for detecting soil moisture, such as drying method, tensiometer method, neutron decay method,2,3 X-ray method, 4 γ-ray transmission method,5,6 near-infrared method, 7 satellite AMSR-E sensor, 8 graphene quantum dotsensor, 9 and double-probe thermal pulse sensor. 10 The measurement of point scale is mainly based on dielectric sensor. The dielectric constant detection method11–14 is widely used in the field of soil moisture measurements owing to its advantages of the fast measurement speed and the zero radioactivity. The main methods of dielectric constant measurements are time domain reflectometry (TDR),15–18 the frequency domain (FD) technique,19–21 and the standing wave ratio (SWR). 22 Most traditional sensors with needle-type probes are portable applications, which are not suitable for multilayer in situ soil moisture measurements.
In order to monitor the change in soil moisture at multiple measuring points synchronously, multilayer soil moisture sensors have appeared in recent years. In 2010, Sayde C et al. 23 forward a new method using a fiber optic temperature sensing to obtain accurate distributed measurements of soil water content, together with algorithm of the time integral of temperature deviation. In 2013, Italy’s Majone et al. 24 used 135 single-point low-cost sensors to self-organize, consisting of 27 monitoring points (five layers for each monitoring point). Although the sensor cost is low, the system is complicated, and the calibration work is cumbersome. With the development of electronic information technology and Internet of things (IoT) technology, systems have emerged that integrate multiple analog sensors, data acquisition devices, and wireless transmission devices. In 2014, Sun Yurui and colleagues 25 from China Agricultural University designed a sensor based on the impedance principle to measure soil water content at three different soil depths. In 2016, Zhao Yandong 26 designed a three-layer soil moisture measurement sensor by using the standing wave method. The sensor working in the polyvinyl chloride (PVC) pipe buried in the soil could obtain the information of temperature and moisture of the three layers, and its performance was stable and the data were reliable. This study provides a highly efficient method for obtaining the real-time information of multilayer soil moisture and temperature.
How can one design a sensor with high sensitivity, high precision, and low cost that can measure the soil moisture in multiple layers of a vertical profile at the same time? Based on a high-frequency double-resonance loop, 27 a new detection method is proposed, which reduces the loss of cable and the nonlinear distortion of operational amplifier and improves the sensitivity, precision, and stability. It can sense small changes in soil moisture by tuning the circuit detuning voltage.
Materials and methods
System composition
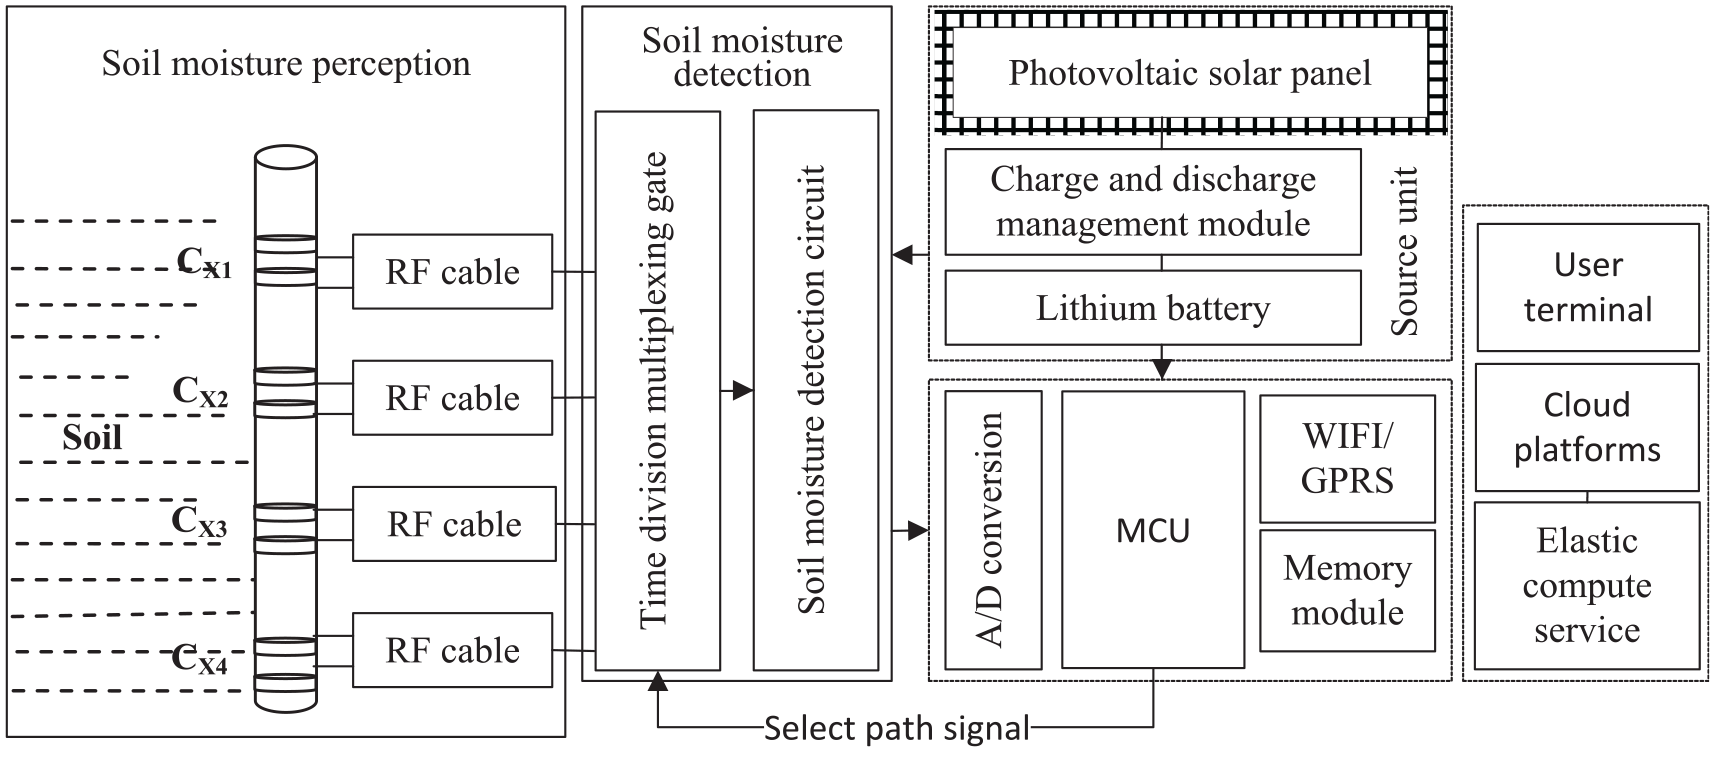
The soil moisture monitoring system integrates analog sensing, data acquisition, wireless communication, elastic compute service, and a user terminal. The structure of the system is shown in Figure 1. It measures parameters such as the moisture and temperature of multilayer soil profiles of one point simultaneously. It also measures the atmospheric pressure, air temperature, and humidity. Its appearance is shown in Figure 2. The details of the soil moisture detection circuit are shown in Figure 3, and the corresponding waveform is shown in Figure 4. The system minimizes the redundant circuits in the integrated design, and the four sensing probes use time division multiplexer circuits, taking turns occupying an analog detection circuit, which reduces the power consumption of the analog circuit to a quarter of the original power consumption. In addition, the analog and digital circuits are integrated in order to eliminate redundant circuits. The solid frame in the figure is the focus of this article and is the core technology of this system. The details of microcontroller unit (MCU) chip are shown in Figure 5(b). The time division multiplexing detection (TDMD) appearance is shown in Figure 6, and the corresponding gate chip details are shown in Figure 7.
Structure chart of the soil moisture monitoring system.
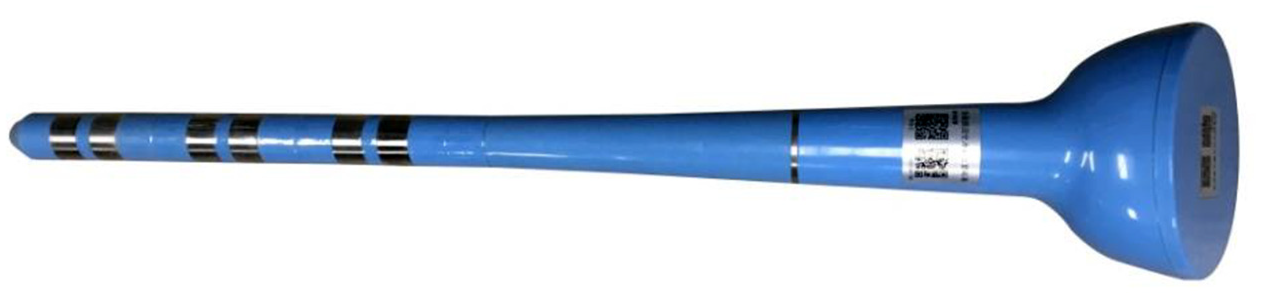
Appearance of a soil moisture sensor.

Soil moisture detection circuit.
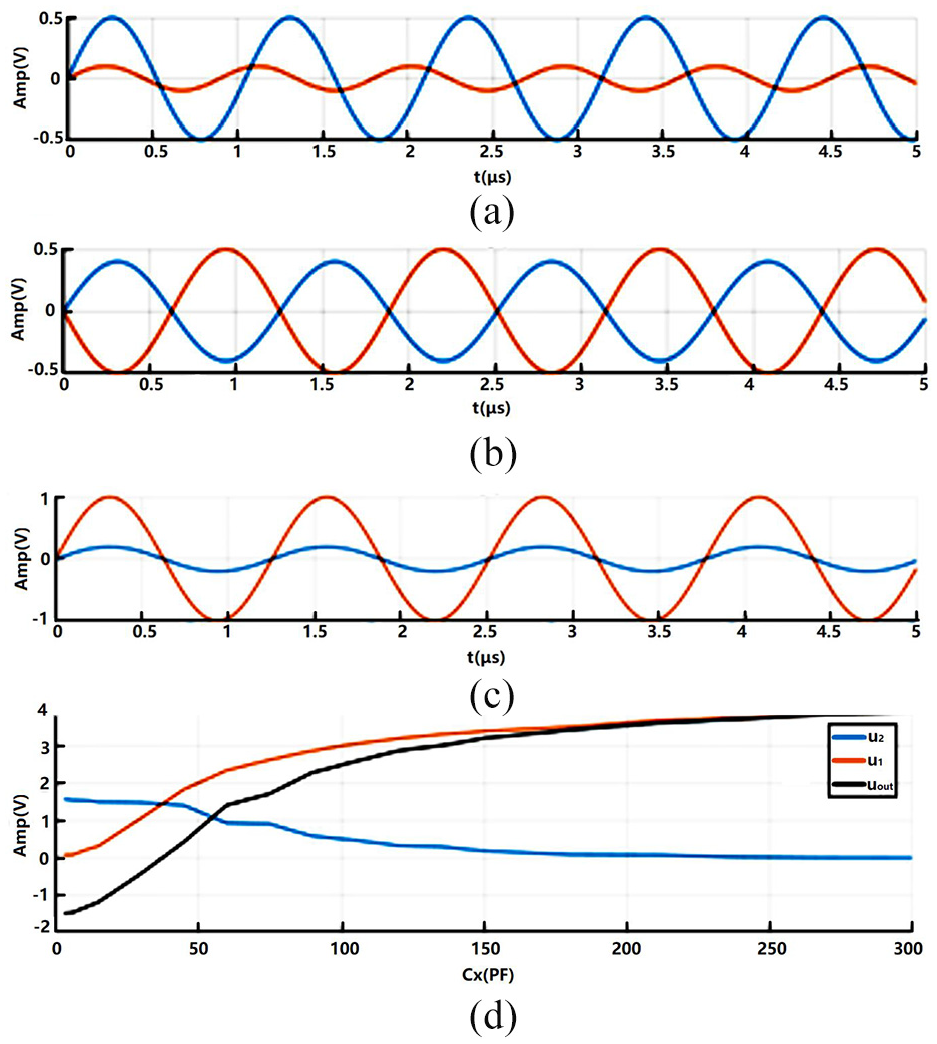
The soil moisture detection circuit waveform. (a) In air, the amplitude of u2 is greater than the amplitudeof u1. (b) The first resonance occurs approaching 30 pF, approximatively where|u1| = |u2|. (c) When the soil moistureis high, the magnitude of u1 is much larger than u2. (d) Uout changes monotonously with Cx.

Comparison of circuits for moisture detection before and after improvements: (a) traditional operational amplifier circuit and (b) deredundancy circuit that eliminates the instability factor.
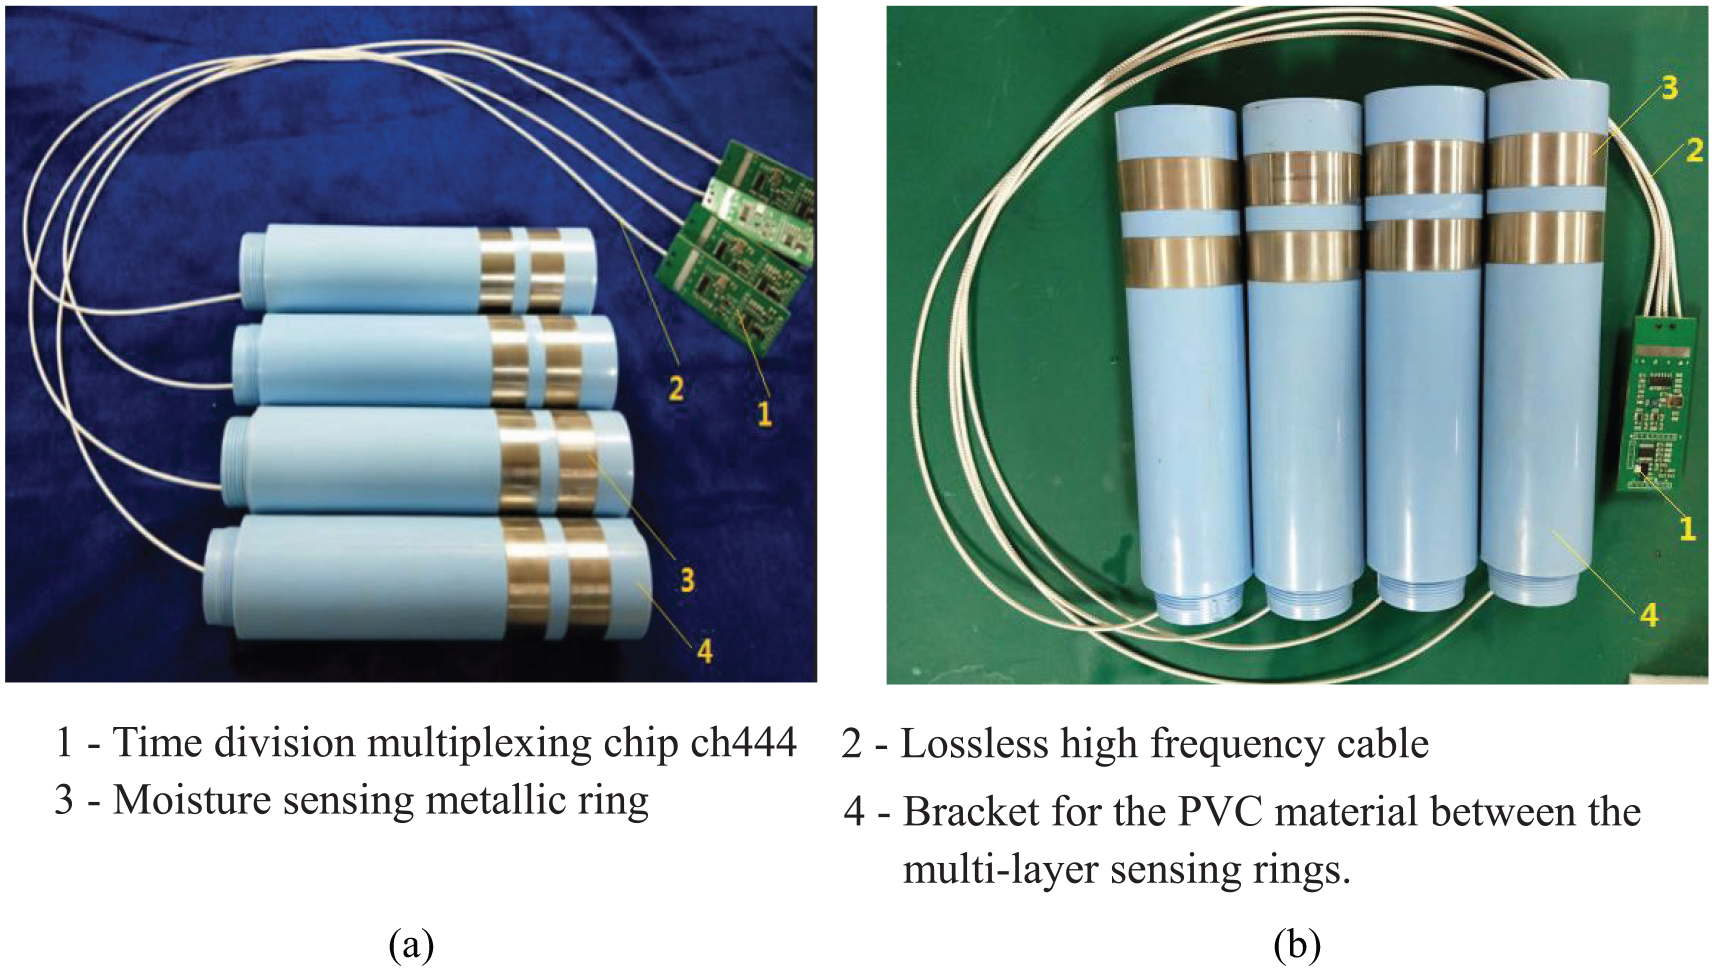
Time division multiplexing and traditional detection: (a) traditional four-layer independent detection and (b) time division multiplexing detection.

Time division multiplexing switch chip.
Principle of soil moisture detection
The soil moisture detection circuit uses a double-resonance circuit as shown in Figure 3. Researches28–30 show that the different frequency of electromagnetic wave has an effect on the accuracy of moisture measurement in porous media; 100 MHz sine wave is adopted in this high-frequency oscillator. The sensing probe Cx is inserted into the soil and is connected to both ends of the detection circuit C through a cable.
The soil moisture detection circuit is shown in Figure 3, in which C* represents the capacitance and R* represents the resistance. In order to share the same circuit with multidepth moisture sensing metallic ring, connect the Cx to the YA pin of the time division multiplexing chip ch444 (Figure 7). LTC5507 is a detector tube chip that converts a high-frequency signal to a direct current (DC) voltage signal. And finally, the detection results are connected with U1 and U2 pins of the single chip through U1 and U2 (as shown in Figure 5(b)).
In the circuit, the impedance of the sensing probe is represented by Cx, which is connected to C3 in parallel through a cable. The other capacitors are all coupled, except C3 and C8, and only a high-frequency signal can pass through. The DC signal cannot pass through. R1, R2, R3, and R6 not only act as dividers but also as protective resistors to prevent over voltage breakdown of the capacitors when the circuit is in series resonance. Furthermore, R4, R5, and R7 are installed to prevent a short circuit or a high current from burning the chips. The impedance of the sensing probe is related to the soil moisture content. Therefore, when the sensing probe is in air, Cx has only a few pF, and the amplitude of u2 is greater than the amplitude of
When the soil moisture content gradually changes from dry to wet, Cx gradually increases, and the circuit gradually detunes and moves away from the center frequency. That causes the magnitude of u1 to increase and u2 to decrease (Figure 4(b)). If the soil moisture content continues to increase, the magnitude of u1 will continue to increase and u2 will continue to decrease. In Figure 4(c), when the soil is saturated, the magnitude of u1 increases slowly and that of u2 decreases slowly. Suppose
Removing redundant circuits to eliminate measurement instability
In Figure 6, the cable connection of the sensing ring and the moisture detecting circuit is critical. The moisture detection circuit is usually at the top of the tube. The longest and shortest distances between the sensing ring and the circuit is 80 and 30 cm. There will be larger attenuation using a 50Ω coaxial cable to transmit high-frequency signals. As a result, the sensitivity of the sensor will be reduced.
The traditional method is able to compensate for the losses in the high-frequency cable. The operational amplifier of the analog detection circuit is used to amplify the attenuated signal. Therefore, there are two potentiometers to adjust the input and amplification to ensure the consistency of each layer output, but this also increases the instability and drift of the measured output value. Figure 5(a) is the traditional and operational amplifier circuit, which is a part of the soil moisture detection circuit. AD623ARMZ is an operational amplifier chip. U1 and U2 are inputs from pin 3 and pin 2 of the operational amplifier after resistive subdivision. Due to the inconsistent performance of the components, the input values and amplification factors of the operational amplifier are inconsistent, which is manifested in the inconsistency of the operating points of the operational amplifier circuits of different layers of the same sensor and the inconsistencies of different sensors. Therefore, all the operational amplifiers of the detection circuit need to be debugged: the input value is adjusted to R121 and the amplification factor is adjusted to Rp100.
To reduce measurement errors caused by signal loss and nonlinear distortion and to eliminate the drift of the measured value caused by the two variable potentiometers of the operational amplifier, this analog detection circuit and the digital acquisition circuit are comprehensively optimized, and the traditional instrument amplification circuit is abandoned. The high-frequency double-resonance detection circuit and the amplitude detection circuit output signal are directly sent to a single-chip microcomputer for A/D conversion without the amplification circuit. As shown in Figure 5(b), U1 and U2 are, respectively, connected to pin 19 and pin 20 of the microcontroller N76E003AT20. The difference in value between U1 and U2 is output to the transmitting module through pin 2, thereby reducing the measurement error caused by signal attenuation and nonlinear distortion. This improves the accuracy and stability.
TDMD method
Traditional multilayer soil moisture sensors are composed of multiple independent detection circuits and analog circuits for each pair of sensing loops (as shown in Figure 6(a)). Furthermore, the multiple-circuit components make it difficult to ensure a good consistency of performance, operating points, and output value. As a result, this leads to inconsistencies of measurements in multiple layers and increased error. To overcome the mutual interference caused by multiple detection circuits and the inconsistency of multiple detection circuit components, the TDMD method is used for a sensor with only one detection circuit (see Figure 6(b)).
The TDMD hardware adopts a high-frequency analog switch that double selects one from four CH444, as shown in Figure 7. When the number of layers is less than or equal to 4, channel A is used to select one from four, and channel B is used when there are five to eight layers. Sensing rings are connected from S1A to S4A with high-frequency cables from the first to the fourth layers, respectively. Which output is selected is controlled by IN0 and IN1. The control sequence of the TDMD detection circuit and the output waveform is shown in Figure 8.

Control sequence for TDMD detection circuit.
Results and discussion
Experimental preparation
There are several soil samples used in the following experiments, as shown in Table 1. According to the drying method, the dry soil mass
Five soil samples.

Calibration experiment
The drying method is usually considered as the most accurate method, and therefore, the experimental result obtained by this method is employed to calibrate the measurement result from our method. The three-order polynomial equation is taken as the calibration equation.
Besides the third-order polynomials, the calibration equation can also be a linear equation, a power function equation, multiscale wavelet approximation function, B-spline function, and so on. The results should be determined by means of the determination coefficient and root mean square error of the fitting equation. Topp et al. 15 pointed out that the empirical relationship between soil permittivity ε and volume moisture content θ is a third-order polynomial equation

This implies that the three-order polynomial fitting equation can be taken as the calibration equation. In addition, polynomial fitting equation is a simple and effective equation compared with other equations.
The soils from different regions in Table 1 were made into five samples to be tested with different weights and water contents. The debugged sensor was inserted into each sample, and the voltage output of the sensors was read separately. Next, the samples were taken out with the ring knife method, weighed, and dried to calculate the volumetric moisture content of each sample. The relationship between soil moisture and sensor output according to the least squares method is shown in Table 2. It can be seen from Figure 9 that four different soil particle size compositions have the same trend curves. The determination coefficient R2 and the root mean square error of the fitting curves for each soil are shown in Table 2.
The fitting equation for five kinds of soil.

RMSE: root mean square error.

Calibration curve.
Four-layer conformance test
Approximately 20 kg of soil was made into six different samples according to certain weight and moisture contents. These were placed in a rectangular parallelepiped container (18 × 18 × 60 cm) with a 6 cm diameter hole at the top (Figure 10(a)). TDMD circuit sensor and independent circuit sensor are inserted, respectively, from the hole into the soil in the box, and then, the power is turned on to measure the value. The data can be viewed through a cloud-based platform and recorded. Afterwards, the soil sample is taken out using a ring knife of 100 cm3 volume and dried to a standard value and compared with the measured value. The comparison results are shown in Figure 10.

Comparative experiment of two detection methods: (a) test box for consistency debugging of the multilayer detection circuit, (b) conformance test results of the MTD, and (c) conformance test results of the independent circuit detection.
The defined standard deviation of the consistency of measurements for each layer is as follows
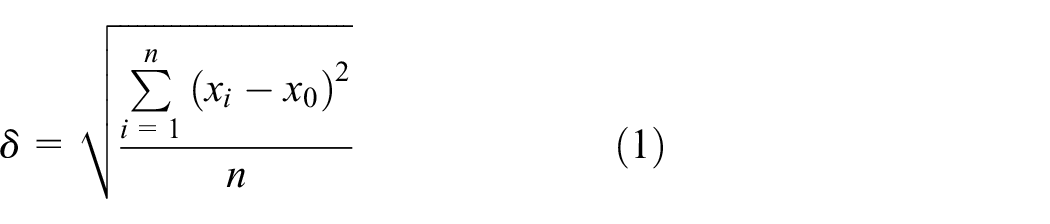
where xi is the measurement result from the multiple layers and x0 is the actual moisture content of the soil sample by using the drying method.
The standard deviation of consistency is shown in Table 3. It can be seen that the consistency standard deviation through the TDMD detection method is smaller than 0.2. Moreover, the independent detection of each channel is bigger than 1.0. This indicates that the TDMD monitoring method can ensure that the measured output values of the four layers have good consistency in the same sample soil.
Comparison of the consistency standard deviations between the two detection methods.

TDMD: time division multiplexing detection.
Sensitivity test
At present, the common calibration methods of sensor formulas include field irrigation method, manual traveling comparative measurement method, laboratory ring knife weighing method, and standard soil sample determination method. 31 These methods have their own advantages and disadvantages. It should be selected reasonably according to the local actual situation. In the following, a simple and effective method is taken in the experiment.
Two kilograms of water was added to 7.32 kg of soil sample No. 5 until it was saturated. The total weight was 9.418 kg. It was well mixed and poured into a bag with the sensor. The bag was pressed tightly and fastened with a rope. The water evaporated through the bag, which was weighed once an hour by means of the electronic balance (Figure 11(a)). The weight and moisture content of the soil column were calculated. At the same time, the sensor automatically transmitted the output voltage and moisture values to the cloud platform at points of 20 and 30 cm below the soil surface. The soil moisture content was observed from saturated to dry in a total of 21 days. The weight moisture content and two-layer voltage value data were downloaded from the cloud platform and plotted with the weight values at different times. A historical line chart is shown in Figure 11(b). The process change of water has three stages: saturation, linear moisture change, and slow moisture change. The first 7 days with the most moisture in the soil were the first phase of the experiment. To fix the sensor and the soil, the bag was filled in the PVC container, so the water dispersion was slow. Before the second stage, the water has dropped to approximately 17.3%. To accelerate the process of water dispersion, the soil bag was removed from the container in stage 2. The water content continued to drop below 3% during the third stage, when the moisture in the soil was similar to the moisture in the air, so the moisture decreased more slowly. At the end of the experiment, it was clear that the weighing method to obtain the corresponding weight moisture content was equally correlated to the changing trend of the output voltage at two sensing layers.

Sensitivity test: (a) sensitivity experiment and (b) measuring the voltage and gravity moisture content.
Performance analysis
1. The correlation between the sensor output and the weight moisture content is calculated using the following formula. Where x is the soil weight moisture content.

The calculated correlation between the weight moisture content and the sensor voltage value at 20 and 30 cm is, respectively, 0.988 and 0.995. It can be seen that the output voltage of the sensor has a close relation with the moisture value.
2. There are first-order differences between the sensor output and weight moisture content.
Study the correlation between the sensor output changes and the moisture changes in order to determine the sensibility of the sensor. First, assume that the weight of the soil column is

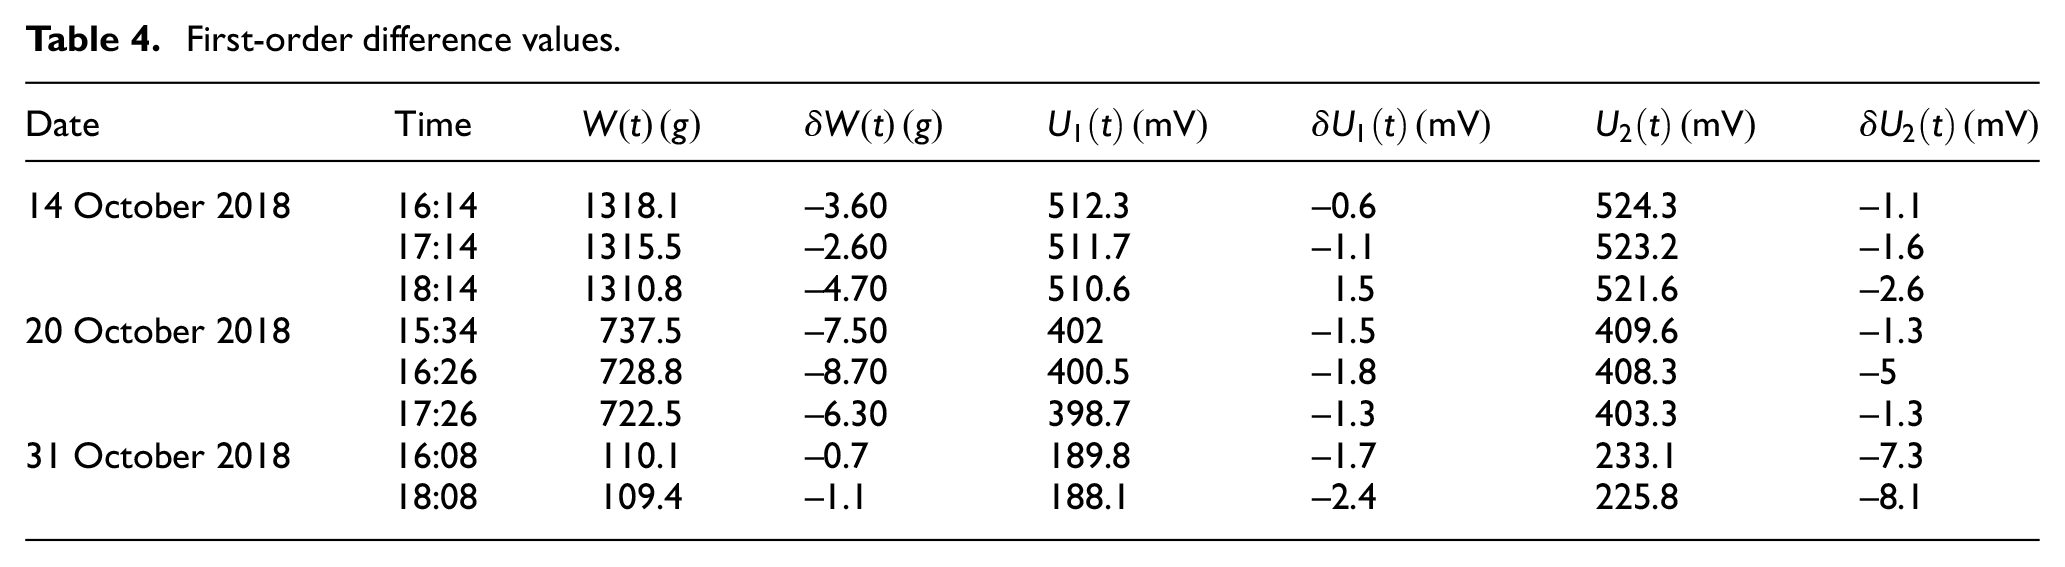
Eight sets of recorded moisture change values in three stages were selected from the historical data. The first-order difference values were calculated based on equation (3) as shown in Table 4.
First-order difference values.
The first-order difference curves of soil moisture weight and output voltage during the whole experiment are shown in Figure 12. One hundred thirty-nine time points were monitored, and the first-order difference value of soil moisture was negative. If the first-order difference of the output voltage of the sensor was also negative, then it was considered to successfully track the change in moisture. One can calculate the probability of tracking changes in moisture as

where
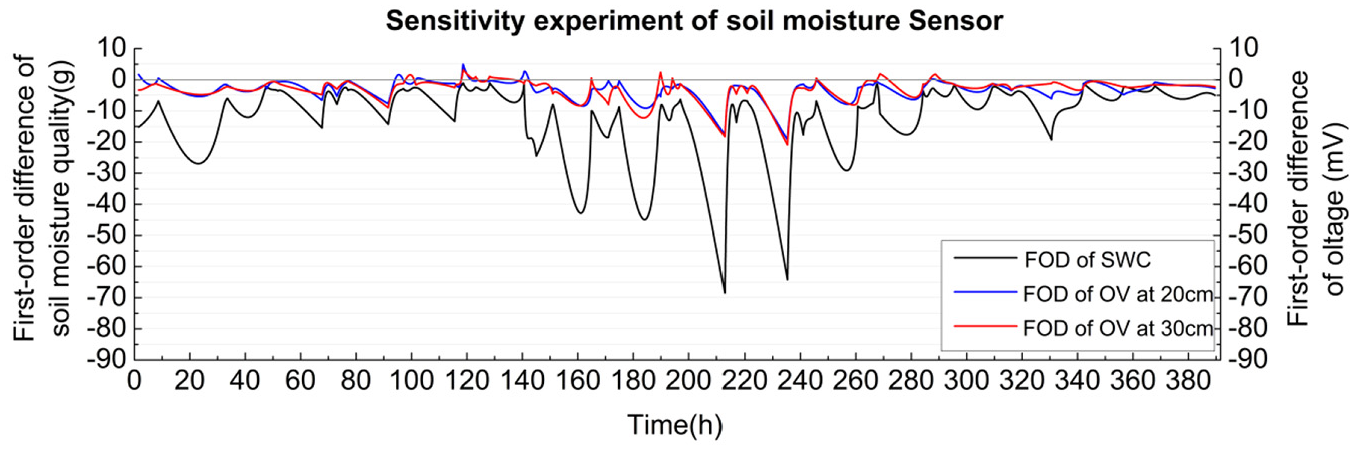
The first-order difference curves of the soil moisture and output voltage during the whole experiment.
Figure 12 shows tracking information between the output values of the soil moisture sensor and the soil moisture change value. From Figure 12, it can be seen that most of the soil moisture change values are between 0 and 10 g (mostly between 0 and 5 g). The output variation in the soil moisture sensor was mainly concentrated at 0–3 mV with soil moisture changes. The results show that the soil moisture sensor can completely capture small variations in soil moisture.
Compared to the experiment result in Zhitao et al., 26 in which the calculated correlation between the weight moisture content and the sensor voltage value is 0.999, our method is a little less accurate. Although it has high accuracy on the soil moisture measurements in the laboratory, the components can be affected by the soil temperature seriously; these results show that the measurement is unstable. Moreover, the moisture sensing metallic ring is connected with the detection circuit by coaxial cable, which makes the signal decay and affects the sensitivity. As mentioned above, TDMD is employed and all these shortcomings have been overcome in our method.
Conclusion
The soil moisture detection circuit uses a high-frequency double-resonance circuit with high sensitivity. When the minimum change in moisture is 1.9 g, the detection circuit of the sensor can track, capture, and change the voltage output value by at least 1 mV.
The sensor adopts the TDMD method, and the time-sharing detection not only saves costs but also ensures the consistency of multiple outputs. The standard deviation of the consistency reaches 0.12%.
Although the sensitivity experiment just monitored the bottom two layers of the sensor, the two voltage outputs of the sensor detection circuit can track very small changes in the soil moisture, and the correlations are 0.988 and 0.995.
The first-order difference calculation is performed for measured values of 139 points to evaluate the sensitivity. When there is a small change in water content (the gravimetric water content is less than 1%), if the sign of the first-order difference of the water value is consistent with the first-order difference of the voltage, the sensitivity requirement is satisfied, that is, the sensor voltage can track its change in time when the water content changes. The trend of voltage change at 20 and 30 cm was 83% and 77%, respectively.
As the number of TDMD circuits is reduced from several to one, it is obvious that the cost of sensors will be reduced accordingly.
Footnotes
Acknowledgements
The authors would like to thank their colleagues for all their help and support during this work.
Handling Editor: Paolo Barsocchi
Declaration of conflicting interests
The author(s) declared no potential conflicts of interest with respect to the research, authorship, and/or publication of this article.
Funding
The author(s) disclosed receipt of the following financial support for the research, authorship, and/or publication of this article: This work was supported by Beijing Natural Science Foundation (Grant No. 4172034), National Natural Science Foundation of China (Grant No. 61871380), and IDS New Technology Co., LTD., Beijing, China.