
Abstract
This article describes the low-voltage distribution network monitoring system developed for the Electric Power Industry of Serbia electricity distribution company. The implemented system is deployed in two different regional centers of the Electric Power Industry of Serbia and is being used in production for the past 4 years. During this period, it has collected real-life data which was used to analyze and investigate low-voltage distribution network performances as well as to identify and study energy losses in low-voltage distribution networks. The main contribution of this article is represented by the real-life monitoring and control infrastructure implementation insights. Furthermore, the system we describe in this article became a part of company’s enterprise information system, thus becoming integrated with heterogeneous information sources. This integration generated additional values to the company since the collected measurements started to improve the quality of the decision-making system for everyday business processes.
Introduction
The efficient use of electric energy imposes the need for the introduction of efficient mechanisms for the optimal use of available electric energy. The electricity distribution system includes a complex power supply network in the form of an electrical grid which consists of a huge number of power lines and devices. Monitoring and management of such complex network represents a major challenge in the daily work of companies for electricity distribution and power supply. These companies have realized that information gathered from sensors and specialized measuring devices are gaining more and more importance in creating successful business plans. The efficient use of data provided from sensors and measuring devices can lead to reducing costs and delivering better services to the customers. If electricity distribution companies ensure that the data obtained from the sensors is exploited together with the data from other information systems, they will improve the quality of data and consequently the quality of decisions they make.
Smart grid, regarded as the next-generation power grid whose ultimate goal is to provide a self-healing network that has dynamic optimization techniques, uses real-time measurements to minimize network losses, maintain voltage levels, increase reliability, and improve asset management. 1 Smart grid initiatives within companies for electricity distribution and power supply are playing the key role in the process of monitoring energy losses and increasing energy efficiency. The issue of electrical energy losses is becoming more important every day, since companies will have to buy energy on the market at economic prices to make up for the losses. This means that any increase in losses that exceeds the predefined norms will directly reflect on the financial status of the company. These facts explain the interest in developing more efficient methods for detecting potential places with higher energy losses.
Up to now, the evolution of the distribution network toward the smart grid model has been essentially focused on two non-intersecting areas: high-voltage (mainly 110–35 kV and 110–10 kV electrical substations) and medium-voltage network automation and smart metering. 2 The former one is mainly focused on improving the quality of service, studying and deploying fault location, and isolation and service restoration systems, while the latter has been addressed to improve the customer relationship management, promote the customer awareness, and enable new smart home services. In most cases, the deep investigation of the low-voltage (LV) network has been left disregarded, even if it represents the asset bridging the high- and medium-voltage levels up to final customers.
The LV network segment is probably the most affected one by international regulatory changes that are promoting renewable energy sources, as a way to reduce greenhouse gas emissions, diversify the energy supply, diminish the dependence on imported fuels and, in general, allow the transition to more sustainable energy paradigms.3,4 Thus, monitoring the real operating conditions of the LV networks in terms of power flows, phase unbalances, voltage levels, and other power quality indicators becomes essential to efficiently operate these kinds of networks. In terms of effectively managing the LV distribution network and the challenges presented by both electricity losses and renewable technologies, electric distribution companies need access to accurate, timely data and actionable information.
This article describes the LV monitoring system developed for Electric Power Industry of Serbia (EPS) electricity distribution company. The developed system measures, communicates and stores real-time data, and translates it into actionable information needed by EPS to meet described challenges regarding LV distribution networks. Different sensors have been used to collect near real-time data (among which are current, voltage, power, and energy values) about medium-voltage to low-voltage (MV/LV) electrical substations in a distribution network. The data collected by this system is transmitted to its data center, where it is analyzed and presented as situational analysis of the LV distribution network conditions. Analysis tools provide daily load profiles and voltage level data to help a company create plans for “stress points,” energy losses in the network and maintain statutory voltage levels.
The main contribution of this article is represented by the real-life monitoring infrastructure implemented at the LV distribution network level. This system is implemented and already deployed within EPS and it is used for more than 4 years. Different lessons learnt from the deployment and exploitation phase of the system are discussed in this article. During exploitation phase of the system, the collected data have been analyzed to investigate the performance of the LV distribution network as well as to identify and study energy losses in the LV distribution network.
The remainder of this article is organized as follows. Section “Related work” reviews previous works regarding monitoring the LV distribution network. Section “LV electricity network monitoring system” presents the system designed and deployed for monitoring the LV distribution network within EPS. Section “System deployment experience” presents the real-life experience in deploying the designed system for monitoring the LV distribution network, while section “Conclusion” provides concluding remarks.
Related work
Significant advancement in sensor technology developed many opportunities for involving sensors in numerous industrial systems. Along with its numerous uses, sensor technology found its place in power grids. Here, electricity distribution companies found sensors to be very useful for monitoring and analyzing electrical grids. They are a part of the systems responsible for monitoring the state of the electrical grid and predicting its behavior based on collected sensor data.
Different solutions and systems already applied in transmission networks have been progressively integrated at the high- and medium-voltage levels of distribution networks. Fault location, isolation and service restoration (FLISR) technologies, which have gained sustained attention in the past few years, are a typical example of such solutions. FLISR solutions have been investigated from both a theoretical and practical viewpoint and they are now at a deployment stage.5,6
Also, smart metering initiatives have been promoted as a way to improve customer relationship management and to foster their awareness on their energy habits. 7 These technologies are designed not just to reduce customers’ bills, to save energy, or to improve customers comfort, but also to use energy in a more efficient way by means, for example, of load shifting to off-peak hours, demand adaptation to renewable sources supply, and reactions to emergency conditions. 8
Grilo et al. 9 have explored the approach of using wireless sensor and actuator networks for improving electrical power grid reliability within the Wireless Sensor and Actuator Networks for Critical Infrastructure Protection (WSAN4CIP) project. In order to improve grid’s safety and the reliability of the substations’ components, they have used cameras equipped with infrared thermos sensors, temperature sensors, and light actuators. They have integrated this system with the existing supervisory control and data acquisition (SCADA) system in order to provide a unified interface for operators and trail testing is organized in a power distribution company in Portugal.
Another research project, described by Leon et al., 10 was focused on the utilization of wireless sensor networks for detecting mechanical failures in transmission lines. This approach uses sensors in order to successfully determine whether the hazard happened due to the environment-related (wind, snow, ice, flood, etc.) or human-related (accidents, terrorism) factors. For solving this problem, they have deployed and utilized tension, displacement, acceleration, and temperature sensors, which were installed in transmission line towers in order to communicate wirelessly with control centers. The system recognizes a hazardous situation based on predefined values for each case and is able to diagnose electrical faults and determine measures that could be automatically taken. Furthermore, the proposed system can provide a complete physical and electrical picture and alert if an extreme mechanical condition is identified on a transmission line. Also, there was a research conveyed by the Mississippi State University that was related to wide area monitoring of an electrical system and its integration within the existing SensorNet management system. 11 The motivation for this research was a noticeable increase in the frequency of blackouts during the last decade.
LV monitoring literature is quite limited and only some test experiences are found in the literature. In particular, Hoornaert et al. 12 presented the experimental validation of a voltage control mechanism for LV distribution network using the available flexibility of smart devices within one household. The developed control system relies only on the communication between different smart appliances within one single household, and only uses locally available measurements such as the household supply voltage. An overall architecture for smart grid communication and LV distribution network monitoring is introduced by Barbato et al. 2 and Lu et al. 13 Within this work, smart meters are used as part of the LV distribution network monitoring system. The common thing for all described solutions for LV distribution network monitoring is that these approaches are based on extending smart meters in order to provide tools for LV distribution network monitoring. In other words, smart meters deployed over the distribution grid create a sensor network used for grid control and management. 14 Collected data is used for both billing and customer relationship management and also for technical management of the LV distribution network.
LV electricity network monitoring system
This article describes the LV distribution network monitoring system developed for EPS. EPS is a state-owned electric utility power company and at the moment de facto holds a monopoly on the electricity market in Serbia. At the moment, only a small fraction of all EPS customers is supplied with the smart meters and the advanced metering infrastructure (AMI). In such situations, EPS cannot rely on using smart meters and AMI for LV distribution network monitoring. In order to overcome this problem and to provide the means for LV distribution network monitoring, EPS chose a different approach. The EPS is trying to deploy remote monitoring systems based on various metering devices and smart sensors. The purpose of these systems is to monitor different LV distribution network segments, mostly MV/LV electrical substations and the parts of LV distribution network between these electrical substations and meters on the customers’ side. As a part of this initiative, the authors of this article developed and deployed an example of such a system. At the moment, the developed and deployed system covers only MV/LV electrical substations. The system collects measured data from smart sensors, transmits collected data to a data center, and stores near real-time data, and translates it into actionable information to provide EPS with better understanding on conditions in different segments of LV distribution network.
The architecture of the deployed systems consists of several components (Figure 1):
Measuring devices (MD) are smart sensor devices deployed in MV/LV electrical substations or different parts of LV distribution network.
Data aggregation service (DAS) is responsible for gathering sensor data from MD.
A web portal as an administrative and supporting tool for DAS and a reporting tool for collected sensor data.
Configurations database (CDB) for keeping DAS configuration data.
Measurements database (MDB) for storing collected measurements from sensors.
In-memory (IM) cache for temporary storing of most current readings collected from sensors.
File storage (FS) for storing collected sensor data in raw format.
Data warehouse (DW) for permanent storing of sensor data after the cleansing and transformation process.
Enterprise information system (EIS) based on existing integration platform. 15

Low-voltage network monitoring system.
Measuring devices
There are many electrical substations throughout the utility power grid. The proposed architecture foresees the possibility that each electrical substation is fitted with a measuring device. Such a measuring device is equipped with built-in sensors for monitoring the electrical energy consumption, power quality analysis, and management of electrical energy use.
Our system uses a microcontroller unit (MCU)-based power quality analyzer unit installed in the field and it measures the power supply quality on 10 kV/0.4 kV network points (Figure 2). 16 This energy measurement sensor supports measurement and automatic calculation of more than 100 electrical energy parameters including: power grid frequency, root mean square voltage, root mean square current, active power, reactive power, apparent power, the power factor of each phase, total active power, total reactive power, total apparent power, total power factor, total active energy, and others. Each energy measurement sensor is equipped with a solid state memory and supports the permanent storage of measured and calculated parameters. A history of all measured data is stored with 1-s resolution for a period of 1 month. In addition, the device stores up to 10 years history of the most important energy parameters calculated on hourly bases (1-h resolution).

Energy management sensor.
Communication between energy measuring devices and the system data center is based on the usage of global system for mobile communication (GSM) networks (e.g. General Packet Radio Service (GPRS)/Universal Mobile Telecommunications System Third Generation (UMTS 3G)). Data center and all measurement devices are a part of the same virtual network and every device is accessible on that network as a HTTP endpoint. Our system collects data from measurement devices by sending HTTP POST requests and receiving and reading the appropriate response.
In Figure 3, an example of a properly formed request is shown. The request data is sent using the form-url-encoded media type, the content-type header value must be set to “application/x-www-form-urlencoded.” The request data contains different parameters that are sent to a measurement device specifying which measurements to read. In this example, 15 min measurements are requested for a 24-h period. The parameter tags specifies measurement values that are requested from the device.
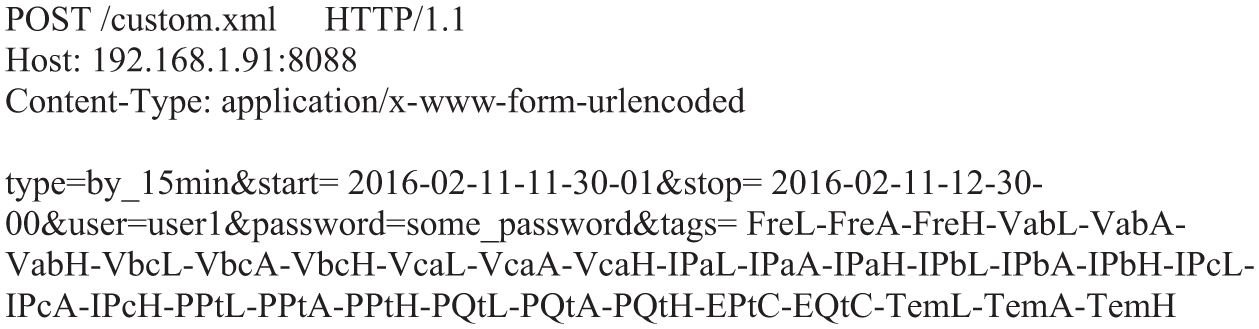
Properly formed HTTP POST request to obtain data from energy measurement device.
Figure 4 presents an example of a valid response from an energy measurement device (the response is obtained using the request from Figure 3). The response is received as a properly formed extensible markup language (XML) file. This XML file contains requested measurements from a device in a form of a collection of data points. Each data point represents a measurement in a specific moment of time. In this example, 15 min measurements are requested for a 24-h period and XML document contains 96 data points. Each data point contains values for all requested tags.
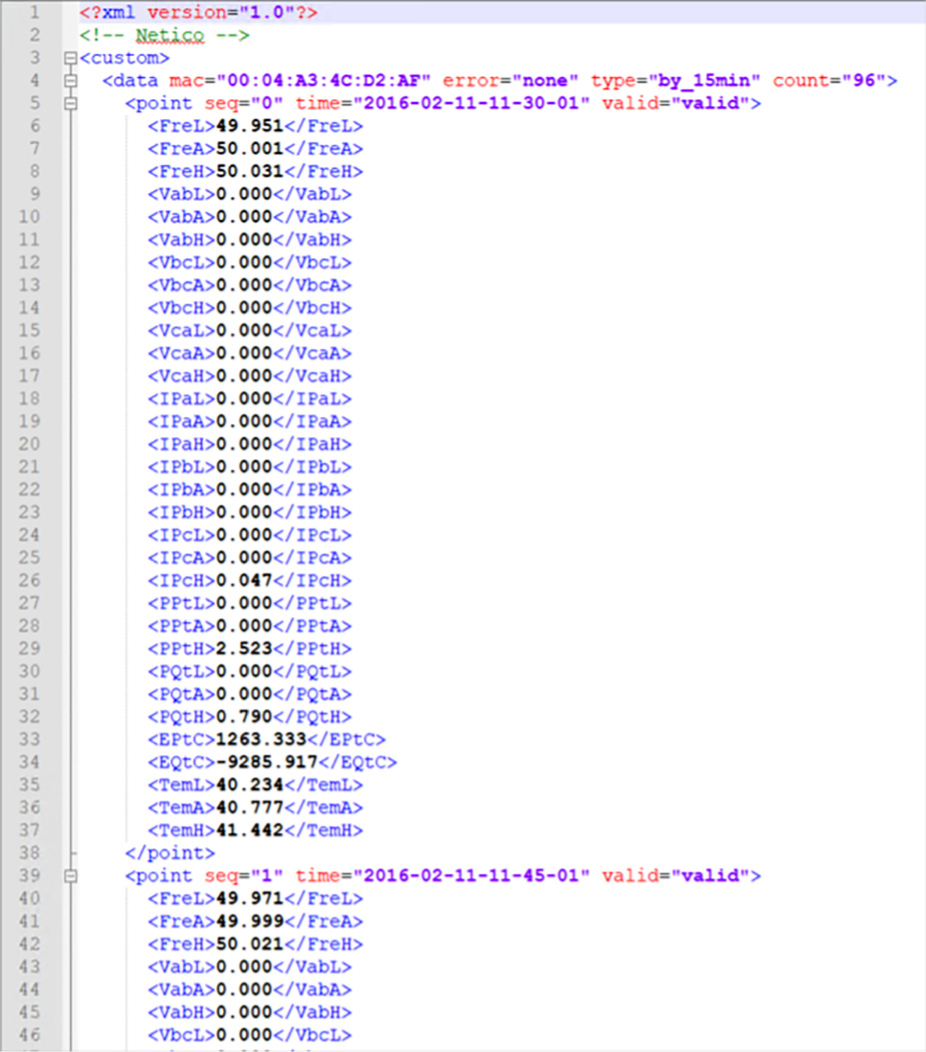
Example of a valid response from energy measurement device.
DAS
The DAS is responsible for gathering information from the electrical substations (precisely, from measuring devices in electrical substations). The service implements a task scheduler system. Every task in this system represents an action of polling measurements data from the measuring devices using the GSM network.
The simplified DAS service configuration data model is shown in Figure 5. This data model is mostly internal for the DAS task scheduler system. But some parts of the mode, location, and devices, for example, are the implementation of appropriate common infrastructure (CIM) entities. 17 This way, the DAS can exchange information with different components of the EIS. For example, information about location is obtained from Technical Information System and Geo-Information System (GIS). Every Location object corresponds to a particular electrical substation in the energy power grid and in one location only one device can be installed at a particular moment in time.

Data aggregation service simplified data models.
Every value that can be measured in the electrical substation is represented as a Poll tag object. Each Poll tag object has a name and resolution type. The resolution type defines maximum frequency for reading that value from sensor. A Poll set object consists of one or more poll tags. The Poll tag objects define a common measurement data set for a group of measurement devices or different measurement data sets (with different reading frequency) for the same measurement device.
The central entity of this data model is the Batch entity. Using Batch objects, the DAS can schedule reading measurement data from measurement devices in electrical substations. Every Batch object defines reading frequency, reading delay, and a set of batch tasks. Every Batch task object represents a particular location (an electrical substation) and the device operating on that location. For every Batch task a Poll set object is assigned.
Every Batch object can be activated or deactivated. Only if the Batch object is active, the service will collect measurement data from sensors according to the schedule. When processing the Batch object and its tasks, the service pairs poll set and reading resolution from task with the Batch object reading frequency and schedule the reading job for that location.
The DAS collects measurements data from electrical substations in two different regimes:
Current measurements represents the current status of an electrical substation. These measurements are usually read with a 5-min frequency and stored into an IM cache. There is no need for store keeping these data because measurements are replaced with new values in every reading cycle.
History measurements represents average values for a given period of time (usually we are dealing with 15-min measurements). The service pools this data from electrical substations with different frequencies: usually every 15 min (one measurement) or every hour (four measurements in a single read request). History measurements, received from electrical substations, are extracted from a received XML file and stored in a measurements database without further processing. Usually some extract-transform-load process is defined to validate and process collected data and to load that data into a company data warehouse. Also, if necessary, original XML files can be stored in raw format in file storage system for later processing.
Communication reliability
Securing reliable history measurements transfer from measurement devices to a data center is the most important goal that the DAS has to provide. The reliability of communication in this system depends mostly on the quality of the GSM 3G signal. Electrical substations equipped with measuring devices are located in different locations with different quality of GSM 3G or the signal quality can vary at the same location during the day. Low-signal levels result in poor system performance, slow response times, and reliability issues. This may result in data not being transmitted, irregular polling success, or complete lack of connection. Any unsuccessful communication attempt is recorded by the service in failed communications log. In this way, the system keeps track of all data that is not transferred to the measurements database.
To resolve the missing data problem, the system operator can try to read the missing data from the measuring device manually or, in the end, can physically visit the location of the electrical substation and retrieve the data. This is a very expensive and non-practical solution. For this purpose, the system implements several techniques which try to recover failed communication attempts. All of these techniques are based on failed communication retries when certain conditions are fulfilled:
When failed communication is detected for the first time—the system is using the time slot until next data poll is scheduled to retry failed communication for N times (N is configurable for every measurement device).
When successful communication is detected—the system checks if there are unresolved failed communications for that measurement device and then tries to poll missing data from measurement device.
These simple techniques can resolve a large percent of all failed communications. The main disadvantage of this approach is a large number of unsuccessful retries that can cause poor performance of the system. This is the result of the fact that the existing system implementation treats all measurement devices in the same way regardless of the GSM 3G signal quality.
Web portal
The web portal is an important part of the system and provides users with quick and easy way to:
Control DAS settings;
Schedule tasks for reading measurements data;
Create reports based on measurements data that the DAS collects from measuring devices in electrical substations.
The web portal provides tools for managing the DAS data model (Figure 6). Using these tools users of the system can execute create/read/update/delete (CRUD) operations on Device, Location, Poll tag, Poll set, Batch, and Batch task objects. These functionalities provide assurance that the DAS is always up to date with the state of the existing elements in the energy power grid and different relations between these elements. Other web portal management tools cover settings that define the DAS behavior and the definition of the schedule that will be used for gathering measurements data from electrical substations.

Example of poll set details.
The last part of the web portal provides tools for generating different types of reports for the collected measurement data. At this point of application developments, four types of reports are supported:
History reports present all measurement readings from the sensor on the chosen location for the specified time interval.
Reports for failed communications present all failed communications from one location for a specific time interval. These reports provide detailed information about failed communications, including the reason for the communication failure and whether the DAS service managed to solve the problem automatically.
Current measurements show the latest measurement collected from the sensor on a specific location.
Graphical report shows the graphical reports for history measurement reports for a specific location and time interval. The graphical report shows all values collected from one location or the subset of these values can be defined (Figure 7).

The example of graphical reports for history measurement data.
EIS
The EIS provides the intelligent integration of information from a number of heterogeneous information sources. 15 Among other, the EIS usually includes the following data information sources: GIS, automatic meter reading (AMR), distribution management system (DMS), SCADA, billing system, and others. Each of them has its own database, but they all share their information in order to create new relations between different pieces of data and provide new knowledge and information about the electric power grid. They communicate with each other through an enterprise service bus combined with service oriented architecture (SOA) techniques in order to give the best results. The new knowledge, information, and integrated data are stored in the central data warehouse.
Information from all services and systems that are a part of the electrical utility company enterprise environment is stored in the same data warehouse. This includes both the EIS and the measurements from electrical substations collected by the DAS. These data are further available for analysis, processing, and presentation to the users of the EIS.
System deployment experience
As previously mentioned, the LV distribution network monitoring system described in this article was developed for the EPS electricity distribution company. In this phase, the system is primarily used for monitoring operational parameters of MV/LV electrical substations. At the moment, there are two large deployments of the monitoring system:
EPS regional center Belgrade with approximately 300 MV/LV electrical substations covered;
EPS regional center Velika Plana with approximately 100 MV/LV electrical substations covered.
Both deployments are in production for almost 3 years. These deployments cover two different use cases: Belgrade as a large urban area and Velika Plana as a small town with adjoining rural settlements.
Installing a complex monitoring system in a real operating environment is a non-trivial task, especially if the target environment provides a public service as the electricity distribution grid. Starting from the design and development stage of individual parts of the architecture to the real testing of the subset of the overall system, careful planning and thorough testing was needed in every step. For this reason, all components of the system were tested together in a laboratory environment before putting them in production environment.
Configuration of the GSM 3G communication network was a great challenge. Real network conditions are not easy to reproduce in a laboratory environment, before the system deployment in the production environment. As already stated, electrical substations equipped with measuring devices are located in different locations with different quality of GSM 3G or the signal quality can vary at the same location during the day. Also, there is a large difference in the GSM 3G signal quality between urban and rural areas. Low-signal levels result in poor system performance, slow response times, and reliability issues. All these problems required a lot of fine tuning and system reconfiguration which is not an easy task in the production environment.
In order to cope with the communication reliability, the system was extended with algorithms for automatic recovery of failed communication request. At the moment, the system treats all measurement devices regardless of their location and the quality of the GSM 3G signal there. When failed communication is detected, the implemented system uses communication retries in order to obtain missing measurement data. Using this approach, a significant percent of failed communications can be resolved. On the other hand, this approach can generate a large number of unsuccessful retries and can cause poor performance of the system.
During our test phase for the EPS regional center Velika Plana, we were monitoring our system for 4 weeks. At that moment, the system was covering 107 MV/LV electrical substation collecting current measurements every 5 min and history measurements every 15 min. During this test phase, approximately 1.78 million communication attempts were made of which about 3% failed. For all the failed communication attempts, system tried to solve the problem using communication retries. About 83% of failed communication attempts were resolved, leaving about 17% of failed communications that were never resolved. These unresolved failed communications were the result of faulty measurement devices, misconfigured communication parameters, or some unknown reasons. It was a test phase for the system, so some kind of problems were expected. In order to solve the problem, the system generated additional 8.5% of communication attempts. During this test period, the behavior of the system was carefully watched. There were no software crashes or any significant system congestion as a result of additional communication attempts. Even so, the authors think that there is a space for improvements. A significant improvement of the system would be the usage of an approach where different profiles are created, based on analysis of failed communications data, for different groups of measurement devices with similar behavior.
The first results of the system deployment became visible after several months. The availability of real-time measurements from the LV distribution network allowed the EPS regional centers to perform a deep analysis of their LV distribution network state and therefore determine customers’ behaviors and power quality phenomena. The power consumption of all customers supplied by a single MV/LV electrical substation was monitored for a period of time and compared to other monitored electrical measures. This analysis covered issues such as transformer utilization, substation busbar voltages, voltage unbalance factor across phases, power factor, neutral currents, and the indicative values of total harmonic distortion. Issues discovered in some specific locations are being investigated further. Also, collected data were used to review, validate, and improve the baseline load estimates.
The collected measurements from the LV distribution network are very relevant for a decision-making process within the electricity distribution company and this data can significantly improve the quality of the decision-making system. After deployment of the system, an important step was to make collected LV distribution network data available throughout the company EIS. In this way, data gathered from the measurement devices in the electrical substations gained additional value. This was done by using the existing architecture for information integration. 15 The deployed system gained importance related to everyday work processes within the company and stated to improve the quality of services provided to the users.
Data integration with the GIS was the first successful use case. Two-way data exchange between the existing GIS solution and deployed LV distribution network monitoring system was implemented. The GIS provided geo-locations for the electrical substations where the LV distribution network monitoring system was deployed, and these data are used by the web portal for configuring the DAS. Also, the measurements collected from the electrical substations are offered to the GIS users using a simple and easy-to-use user interface (UI) (Figure 8). This way, collected measurements data becomes available to the company employees that are not involved with the LV distribution network monitoring system on a daily basis.

History measurements for selected electrical substation in GIS.
The next use case was data integration with the SCADA system. A specialized module was developed in order to integrate and align data obtained from the SCADA system and data obtained from the LV distribution network monitoring system. The most important feature of this module was to provide the means for monitoring network faults: detect when the fault happened, provide information that helps diagnose and solve problems, help the company meet the standard voltage requirements, and reduce the network operational costs.
Furthermore, a specialized tool was developed to address the growing issue of electricity theft. This tool is implemented using the balance difference method.15,18 The balance difference method is based on calculating the mismatch between the total readings of consumer meters with the control (balance) meter from a substation or substation feeder (measuring devices deployed with the system). This method is convincing when it comes to narrowing down the circle of suspects and checking a specific consumer’s meter readings. In Figure 9, an example report about energy losses in the LV network grid from January 2017 is shown. The electrical substations where electricity losses are above the defined threshold (possible electricity theft) are marked in red (the identity of all electrical substations in the example report is hidden). The developed tool is used to localize the electrical substations or electrical substations feeders with high levels of energy theft. After energy theft is detected and localized, field controls and control meters can be used to prove the theft.

The tool for monitoring energy theft in the electricity distribution grid.
Conclusion
This article describes the LV distribution network monitoring system developed for EPS electricity distribution company. The system has been successfully designed, implemented, and validated by successful deployment in the production environment. Based on two successful production deployments, we may conclude that the proposed concepts of active LV distribution network monitoring, system architecture, and functionalities work as expected.
The system concepts and solutions extend the monitoring and control of the electricity distribution grid to LV level and enhance the reliability of power supply. The developed LV distribution network monitoring system collects various near real-time sensor data from measurement devices deployed in medium-level to low-level electrical substations. Collected data are stored in a data center and used for real-time monitoring of the LV network distribution. Different tools are used to analyze collected data and to find efficient mechanisms for the optimal use of available energy and improve the systems for managing and monitoring power networks. Since the power grid is a very complex system, the solution that provides these mechanisms has to be very sophisticated and customized.
The importance of the deployed system started to grow significantly when collected measurements data from the LV distribution network became available throughout the company EIS. The collected measurements started to improve the quality of the decision-making system for everyday business processes. By including LV distribution network monitoring data, the company EIS is provided with data that can be used for monitoring real-time energy consumption, but what is more important, to provide the base for calculating electricity losses in the grid and to provide information that will help end customers to save energy and control their spending. The authors of this article were interested in the possibility to monitor the efficiency of the deployed system by monitoring the level of energy losses and electricity theft. Unfortunately, we are not allowed to access this information. There are official reports regarding energy losses for the Republic of Serbia, 19 but we do not have access to the reports for the particular regions covered by our system. We are aware that the system is operational, and it is used in everyday operations and for different actions regarding reducing energy losses and preventing electricity theft.
At the moment, the measurement devices are installed only in MV/LV electrical substations. In the near future, these or some other measurement devices can be installed not only within electrical substations but also for specific segments of the LV network grid, individual customers or groups of customers. This way, the system will provide more precise info about the state of a LV distribution network grid.
As already described, the communication reliability between measuring devices and the data center is a major role of the DAS component. Currently, the DAS is using the retransmission policy when failed communication occurs because of poor 3G reception. This policy can generate a significant number of additional communication attempts in order to solve failed communications. The authors of this article are considering the improvement of the existing system using an approach based on extending the existing system with autonomous monitoring and self-adaptation features. Collected data about the failed communication will be used to create statistical models for different groups of measurement devices with similar behavior. The DAS component will monitor the behavior of the measurement devices and will create an appropriate communication profile for these devices in accordance with the created statistical models.
There are no official data about the percentage of EPS customers equipped with smart meters and AMI. According to an official report from the Energy Agency of the Republic of Serbia, 19 there is a great delay in the realization of the project to replace the existing meters with the smart meters. At the moment, the improvement of the metering system with the users connected to the medium-voltage network was defined as the primary goal, while among the users with facilities connected to the LV network, the priority is given to the users who have their active and reactive energy and monthly maximum power metered. We are aware of the several pilot projects regarding the introduction of different AMI systems within the EPS. One of these projects is implemented within the EPS regional center Belgrade. 20 Unfortunately, we did not have a chance to directly compare the results of our system with the results of the implemented AMI system. As already said, the authors of this article are well aware of the superiority of the systems based on the smart meters and AMI. We think that our system is just the first phase in the transition to an electricity distribution network, that is, completely covered by the smart meters and AMI. This approach is already defined as a part of the official guideline from the Energy Agency of the Republic of Serbia. 19 In future smart meters and AMI will only benefit from the existing LV distribution network monitoring system. Collected data from the LV distribution network monitoring system and the smart meters will help the company to better understand its customers’ needs and will also provide the customers with detailed information about used energy.
Footnotes
Handling Editor: Anne-Cécile Orgerie
Declaration of conflicting interests
The author(s) declared no potential conflicts of interest with respect to the research, authorship, and/or publication of this article.
Funding
The author(s) received no financial support for the research, authorship, and/or publication of this article.