
Abstract
In order to study the deformation stability of rock slope during the excavation of cutting slope and ensure the safety of rock slope during construction and operation period, this article analyzed the deformation law of a typical slope excavation by monitoring the surface deformation and the internal displacement of the rock mass. The surface deformation of the slope is monitored by setting monitoring points, and the internal deformation of the slope is monitored by installing multipoint displacement meters and inclinometers. Therefore, the relationship between slope excavation and deformation is obtained. The analysis of monitoring results shows that the slope is stable before excavation, and the displacement of the slope is gradually increased with the slope excavation. After the excavation, the displacement of each slope tends to converge. The maximum displacement in surface monitoring points is 12.30 mm, and the displacement parallels to the direction of the expressway. The maximum vertical displacement in surface monitoring points is 10.60 mm which occurred in the third step; the maximum internal displacement is 11.02 mm which mainly occurs in the weak structural plane of the rock boundary. During the excavation of the weak rock slope, the slope rock mass is prone to large displacement deformation. After the excavation, the slope surface displacement and internal displacement tend to converge in a short time.
Introduction
With the development of highway and transportation industries, traffic flow is larger and larger, and traffic loads of some roads have gradually surpassed their original capacities.1–3 Highway reconstruction and expansion becomes one of the methods improving highway transportation capability, and the issue is followed by excavation of original high slopes. Many slopes are complicated with lithological features of faults, crushed zones, and weak structural planes. To avoid adverse impacts caused by blast working of a high slope on traffic of the expressway near the slope, impact rock grinding with a hydraulic rock breaker is used for slope excavation.4–8 If buckling failure of a high slope occurs due to impact excavation disturbance and site construction, traffic fluency and safety of an existing route will be significantly compromised, resulting in serious traffic accidents and economic losses. To guarantee safe slope excavation and stable operation, monitoring and analysis of a slope is necessary.9–13 In recent years, many experts and scholars have obtained many good research developments in monitoring systems.14–20 Barsocchi et al. 21 proposed a structural monitoring system by Internet-of-Things wireless sensing devices to monitor their state of health of the buildings. Tirado-Andrés and Araujo 22 demonstrated the importance of the selection of the clock source in wireless sensor networks by real experiments and theoretical analysis. Kromer et al. 23 developed a time lapse camera system to monitor geological processes with lidar or ground-based interferometric synthetic aperture radar (GB-InSAR). Yadav et al. 24 presented the design, development, and field implementation of an online, cost-effective wireless system for real-time slope monitoring. The stochastic response surface method can assess the reliability of slope stability involving correlated non-normal variables accurately, and its accuracy is shown to be higher than that for the first-order reliability method.25–28 Studying rock slopes using terrestrial laser scanning will improve our understanding of how rock slopes behave and evolve.29–33 The weathering of a rock mass can be considered as a predisposing factor to slope instability.34–36 The three-dimensional numerical manifold method can be used to find the failure mechanism of rock slope and analyze rock slope stability. The Hoek–Brown criterion is widely used in slope stability analysis. Many new approaches for prediction of the stability of rock slopes are used in the recent year.37–43 In this article, a high slope in the Nantang Wenzhou-Huanghua section of the complex line of the Ningbo-Taizhou-Wenzhou expressway in Zhejiang Province is investigated. Common methods for slope monitoring and measurement are used for stability monitoring and analysis during the excavation of the slope, and the safety of the slope is assessed from multiple aspects.
The objective of this article is to present a case study of field monitoring on the deformation of high rock slope during highway construction, in which the surface deformation and the internal displacement of rock mass were recorded and analyzed. The obtained results can make the database of slope deformation monitoring more abundant and provide an important reference for the construction of similar projects which maybe reduce the probability of construction accidents effectively.
Geological and hydrogeological environment in Wenzhou
Geological conditions
Wenzhou, a city located in the coastal area of south Zhejiang Province of China, includes four administrative districts and seven countries and faces the wide Wenzhou Bay in the east, as shown in Figure 1. It has the landform type of middle and lower mountains, which are mainly distributed in the north, west, and south. The middle area of Wenzhou is covered with hills, while the east is characterized by strand plains and mud flats. Globally, the City presents the terrain of “higher in the west and lower in the east” and the feature of “step-cut” descending. The marine depositional plain shows flat terrain and slightly inclines toward the waterfront and the coast directions; the ground elevation is generally 3–5 m, and the area is covered with an extensive river network. For the hilly areas, there are mainly volcaniclastic rock hills; the elevations are mostly below 100 m, while a few peak elevations are between 140 and 170 m. The massif is generally soothing with a general slope of 30° and without steep cutting. Within the area, no large valley is formed, while valleys are majorly formed by weathering and denudation. Normal erosion plays a minor role. The valley exit of the mountain front is characterized by the accumulations of alluvial fans in different sizes.

Plan view of district division of Wenzhou Administration Region and geological map.
Wenzhou is situated in the Cathysia of the southeastern Jiangshan-Shaoxing fault zone. The base of the Cathaysia is a set of metamorphic rocks, including marble, quartzite, quartz schist, and muscovite schist from the Proterozoic ear. As the Yanshanian tectonic movement is intense, the metamorphic base is covered with a large area of Mesozoic volcanic rocks, while Jurassic and Cretaceous volcanic rocks and universal volcaniclastic rocks can be seen everywhere. In addition, there are many large-scale granitic plutons. The Yanshanian fault-block movement is extremely active and accompanied by violent magmatic activity. Due to a large area of the volcanic structure formed by the volcanic eruption, invasion of magmatic rocks, and late fault-block movement, the structural framework is characterized by faulting without fold development. The deep faults mainly include the NE-WS Zhenhai-Wenzhou major fault and the Taishun-Huangyan major fault, and the WN-SE Chunan-Wenzhou major fault and Songyang-Pingyang major fault. Fault-block activities lead to the formation of declining down-faulted basins in Wenzhou and sediment of an extremely thick quaternary stratum, which varies widely in thickness, increasing from a thickness of 3–10 m in the piedmont valley areas to the thickness of 150 m in the strand plains. The sediment in the plain area is characterized by complex causes and large changes in lithofacies. The sediment shows a law of coarse alternating with fine settlings, which construct a multilayered structure. The deep ground displays the changes of fluvial facies, lacustrine facies sand-gravel layer, and lacustrine facies clay; while the shallow ground shows the changes of littoral facies, marine facies, silty fine sand layer, and lacustrine facies silty clay. For these regional faults, there were relatively violent activities in the Mesozoic era, causing large-scale volcanic activities. Figure 2 depicts a typical hydrogeological section of Wenzhou.

Typical hydrogeologic section of Wenzhou.
Hydrogeological environment
The region of Wenzhou City is classified as a subtropical maritime monsoon climate area with warm and humid meteorological and hydrological features. There is no freezing winter or sultry summer throughout a year. The average annual temperature is 17.9°C, the average annual rainfall is 1695 mm which mainly contributes to a plum rain season from April to June and a typhoon season from July to September, and the average annual evaporation capacity is 1310.5 mm. The region contains three major water systems, Ou River, Feiyun River, and Ao River. The hydrographic nets of the measured region mainly belong to coastal plain river networks, which are distributed in an intensive and crisscross pattern with scattered ponds. The rivers mainly supplied by the atmosphere, Quaternary loose rock interspace phreatic water and bedrock fissure water, and finally, inject to Yueqing Bay. The underground aquifer in Wenzhou City is generally at the depth of 60–70 m. The underground water is mainly supplied by vertical permeation of atmospheric precipitation, and the groundwater level varies with rainfall and exploitation. In addition, the underground water is also supplied by surface water and bedrock fissure water. The underground water flows mainly from mountain front area to coast, generally from east to west. The flow direction of underground water is basically identical to the flow direction of rivers.
Project background
The Wenzhou Nantang-Huanghua section project of the Ningbo-Taizhou-Wenzhou Expressway complex line is an important part of the Zhejiang Expressway main skeleton. The section of expressway complex line starts from Nantang Town of Yueqing City, connects the Yueqing Bay Bridge and Nantang Hub of the Ningbo-Taizhou-Wenzhou Expressway complex line in Zhejiang Province, and shares the same line with the Ningbo-Taizhou-Wenzhou Expressway from Yueqing Nantang Hub to Yueqing Interchange High-speed Hub. For this highway section, road expansion is conducted; a new line is adopted from the Yueqing Interchange High-speed Hub, passes Yanpen Town and the west of Wengyang Town, and ends at the north of Huanghua Town. The total length of the Nantang-Huanghua section project of the Ningbo-Taizhou-Wenzhou Expressway complex line is 31.6 km, while the length of the road expansion section is 23.65 km. The road design speed is 100 km/h. For the road expansion section, the two-way, four-lane road will be expanded to an eight-lane road, and the width of the bilateral expanded eight-lane integral roadbed is 41 m. The main section of the new line will be constructed in accordance with standards for six-lane expressway, and the width of the integral roadbed is 33.5 m.
For the Wenzhou Nantang-Huanghua section project of the Ningbo-Taizhou-Wenzhou Expressway complex line, the position of a cutting high slope is shown in Figure 3, and the slope is located in the right side of the K30 + 560–K30 + 660 section, measuring a length of 100 m. The original slope is about 40°.

The plane position of slope engineering.
Ground conditions at the rock slope
The slope rock mass is generally distributed in a layered pattern downward from the top of the slopes. Specific distribution is shown in Figure 4. The fractures in the deeper part of the slope rock mass are more developed with more compressive shear faults. The in situ rock mass is extruded to be schistose and transparent with local distribution of quartz veins. Rock alteration is intense; weathering is intense but unevenly. The cutting of the faults destroys the integrity of the rock mass and forms the storage and migration channel of groundwater, which reduces the stability of the slope.

Typical vertical section profile of slope.
The residue slide rock is distributed on the top of the slope with silty clay, which generally measures 2–3 m and is yellow-gray. The lithology of the subterrane is characterized by fully weathered crystal tuff, strongly weathered crystal tuff, moderately weathered crystal tuff, and silky weathered crystal tuff in sequence. The fully weathered crystal tuff shows sand–gravel appearance with a thickness of about 8 m, and partial rock is missing; the strongly weathered crystal rock is relatively hard with strong weathering features, shows debris appearance and formation of joint fissures, and generally measures a rock thickness of about 10 m; the lower moderately weathered crystal tuff, secondary-hard stone, is hard mostly with integral masses and measures a total layer thickness of 30–40 m; silky weathered crystal tuff is hard with relatively integral mass (refer to Figure 5 for details).

Geological profile of slope.
Construction sequence
Slope construction excavation is stratified and segmented excavation carried out from top to bottom. Every segment is excavated from a large mileage stake mark to a small one. According to slopes on the spot, excavators with dump trucks are used for layered excavation from top to bottom, and the excavation depth of every layer is controlled to 2.5–3 m. Excavation to 50–100 cm of the designed slope line is first completed; machines are then used to finishing the slope surface; finally, manual work is offered for slope repair. Excavation of the slope rock mass is shown in Figure 6.. Specific excavation steps are divided into cover excavation, slope earth rock excavation, and earthwork transport.

Diagram of slope earth excavation method.
Cover excavation
Weathered rocks, sediments, and debris on the slope surface should be cleaned before cover excavation, and a slag retaining ridge should be built in the proper position to ensure the safety of construction at the lower part of the slope. Cover excavation should be conducted on an up-down layered pattern according to the designed slope ratio. A slope surface shall be built with a certain tendency for good water draining. With the decline of excavation elevation, clean up the slope timely.
Slope rock excavation and earthwork transport
The excavation of slope rock mass is based on the form of top-down excavation. For the rock masses which are severely weathered, fragile, and unstable in the upper part of the slope, soil nailing support is used for construction safety protection during excavation. Two excavators excavate on the high-side slope surface excavate the rocks and retreat and load rock fragments for transport. After completing the excavation of every segment, soil nailing is adopted immediately to support and protect the slope until completion of the slope excavation. During earth excavation, the stonework is transported through a temporary road.
Slope support and protection plan
The slope excavation is divided into five levels, and the slope protection plan is as follows. The I-level slope is protected by a facing wall and anti-slide pile. II-level, III-level, and IV-level slopes are reinforced with prestressed anchor cables; the V-level and the above slope is protected with anchoring and shotcrete. Based on analysis and study, the slope shows general lithology. For the specific profile of the slope reinforcement project, please refer to Figure 7.

Profile of slope reinforcement measures.
Instrumentation and monitoring program
Instrumentation
Instruments used to monitor slope deformation mainly contain multipoint displacement meters, inclinometers, level, and total stations. The last two are used for monitoring of slope surface deformation, while the former two are used for monitoring of slope rock mass displacement. A multipoint displacement meter is used to measure the horizontal displacement of the rock mass. The position is determined according to the geologic structure of a slope in order to set a horizontal drill hole to lay a multipoint displacement meter. The three anchor heads of the multipoint displacement meter are firmly connected with rock mass. When the displacement of the rock mass occurs along the axis orientation of the drill hole, the anchor heads let the measuring bar move, making the senor at the benchmark terminal suffers from the corresponding displacement with the displacement of the anchor heads. In this way, the sensor at the benchmark terminal measures the displacement with a digital display. Figure 8 shows the layout of the multipoint displacement meter. A used inclinometer is an MI1601 inclinometer manufactured by Nanjing GEOT (a resolution of 0.01 mm) and is used to measure the horizontal displacement of the slope. Drill a hole vertically to the required depth at a designed slope monitoring point; install an inclinometer tube in the hole. The space between the inclinometer tube and the hole shall is filled with medium-coarse sand. The origin place of the level is Switzerland and the model is Lycra NDA03. The round trip accuracy of the level is 0.3 per kilometer. The level is used for slope vertical displacement monitoring. Before monitoring, a monitoring point is set at the designed monitoring point of the slope, and a reference point is laid. The total station is produced in Switzerland and the model is Lycra. it is characterized by an angular accuracy of 0.5″ and a ranging accuracy of 1 mm + 1 ppm × D. It is used for the measurement of horizontal displacement of the slope. Before monitoring, a horizontal displacement monitoring point and a total station monitoring foundation pier are laid at designed monitoring points. As the horizontal and vertical displacement monitoring points are identical, the two monitoring points coincide.
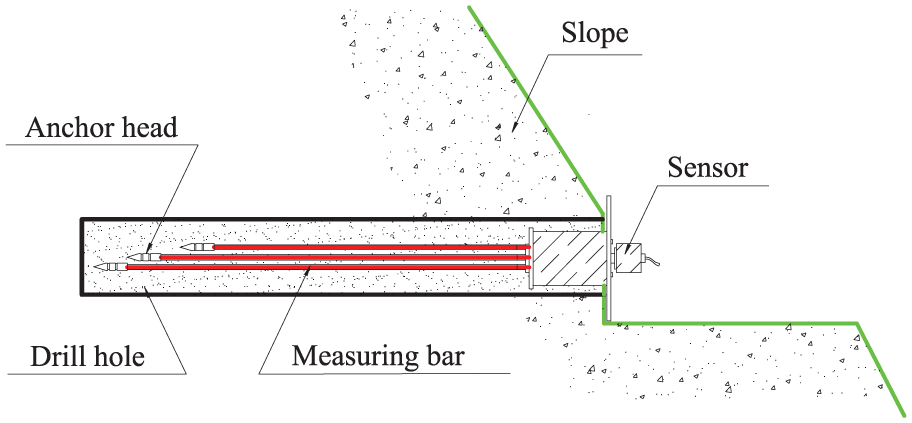
The layout of multipoint displacement meter.
Monitoring program
The rock joints and fractures of the slope are well developed; internal fracture areas are complicated with strong local weathering, which might induce the development of internal deep fractures during construction. To timely master changes of soft structural planes during the construction and to guarantee deformation stability of the slope during the construction, deformation monitoring is required for the slope.
Surface deformation monitoring and rock displacement monitoring were applied according to features of the slope. For surface deformation monitoring, stations of surface deformation monitoring were set on slope platforms, and level gauges and total station instruments were used for monitoring. The UX refers to displacement parallel to the slope direction, and a positive value refers to a level displacement toward the roadbed, and the otherwise is negative. The UY refers to displacement parallel to the direction of the expressway, and a displacement toward the east is expressed as a positive value, and the otherwise is negative. The UH refers to vertical displacement, and a sinking displacement is expressed as a positive value, and the otherwise is negative. For internal rock displacement, multipoint displacement meters and clinometer boreholes were deployed, and portable frequency meters and inclinometers were used for measurement. The monitoring layout of the slope is shown in Figures 9 and 10.

The monitoring layout of the slope (side view).

The monitoring layout of the slope (front view).
Surface deformation monitoring
Four groups of deformation monitoring points were deployed on the slope. One deformation monitoring point was set on the platform of the V-level slope with an elevation of 56.9 m and was recorded as E501. A total of five deformation monitoring points were set on the platform of the IV-level slope with an elevation of 47.2 m and were recorded as E401, E402, E403, E404, and E405. A total of five deformation monitoring points were set on the platform of the III-level slope with an elevation of 37.0 m and were recorded as E301, E302, E303, E304, and E305. A total of five deformation monitoring points were set on the platform of the II-level slope with an elevation of 27.5 m and were recorded as E201, E202, E203, E204, and E205. The deformation monitoring points were laid 50 cm from the edge of the slope stairs, and the stainless steel core supports were used with a laying depth of about 50 cm to guarantee stability and firmness of deformation monitoring points. A high-precision total station and a high-precision level are used for the measurement of horizontal and vertical displacement at a deformation monitoring point, respectively.
Internal deformation monitoring
According to the structural and geologic features of the slope, a total of three sets of multipoint displacement meters were deployed to monitor slope internal rock loosening and horizontal displacements caused by the unloading effect. The deployment of multipoint displacement is shown in Figures 9 and 10. The first set was located on the IV-level step with an elevation of 47.2 m, was coded as E-SPK01, and passed strongly weathered rock before entering the moderately weathered rock. The second set was located on the III-level step with an elevation of 37.0 m, was coded as E-SPK02, and passed crystal tuff and strongly weathered rock. The third set was located on the II-level step with an elevation of 27.5 m, was coded as E-SPK03, and passed crystal tuff. After hole-drilling, installation, and slip casting, the multipoint displacement meters worked normally for monitoring.
Inclinometers were used for monitoring of horizontal displacement. The deployment of the inclinometers is shown in Figures 9 and 10. Two clinometer boreholes were deployed. The one clinometer borehole coded as A1 was located at the V-level slope with an elevation of 67.1 m, and the borehole depth was 22 m; the other clinometer borehole coded as B1 was located at the III-level slope with an elevation of 47.2 mm, and the borehole depth was 28.5 m. The clinometer boreholes were drilled with a 110 mm drilling machine, and the clinometer pipes were high-precision pipes made of acrylonitrile butadiene styrene (ABS) material. The inclinometers were used for measurement according to standard requirements.
Field observations and analysis
Surface deformation
The monitoring points normally worked from 20 November 2016 to 28 September 2017 to obtain horizontal displacement and vertical sedimentation value. The data are accurate and valid. The measured deformation rates are not beyond the alarm value (1 mm/d). Please check Table 1 for accumulative surface deformation/displacement data. It can be viewed from the table of the surface displacement observation data that the displacements of the UX direction in the slope observation points are mainly 5–6 mm, and the E501 point presents the maximum displacement at the UX direction. The elevation of the E501 point is 57.1 m, the displacement is 6.47 mm, and the point is located on the V-level step. It can be viewed from Figure 11 that the E501 point shows no large horizontal displacement before the IV-level excavation and is stable globally. After the start of the III-level excavation, the curves present an obvious turning point, higher gradients, and maintain a convex shape. The displacement increases obviously with time. It is suggested that the excavation disturbance of the III-level slope poses large impacts on the stability of rock internal structure, and disturbance of rock caused by slope excavation is the main factor influencing slope stability. After completion of the III-level excavation, the curves present another turning point and declining rates of displacement change. Later, the curves present slow changes; the displacement volumes are small and converge to no displacement change in the end. UX displacements on every step of the slope are slightly affected by the excavation of a higher level but significantly affected by the excavation of a lower level, and displacement changes mainly occur during the later stage. It can be suggested by curve analysis that slope displacement deformation mainly occurs during the excavation process. Different construction stages have different influences on rock stability. The deformation rate after the excavation is obviously smaller those that during excavation construction, deformation of slope rock no longer occurs, and the slope tends to be stable.
Monitoring data table of surface accumulative displacement.


Variation of observed surface horizontal displacement (UX) with time.
Based on Table 1, for the surface accumulative displacement observation data, it can be viewed that the E304 and E501 points have the maximum UY displacements among the slope monitoring points, and the displacement is 11.50 mm toward the direction of the road. The elevations of the observation points are 37.1 and 57.1 m, respectively, and the points are located on the III-level step. The displacements of the E304 and E305 points on the III-level step are larger than those of other points. During the early stage of the II-level excavation, the slope displacements are relatively small, and the curve is basically a horizontal line. During the late excavation stage, the displacement change curves of the E304 and E305 points present obvious turning points and straight linear growths; the average curve rate is 0.5 mm/d. After the completion of the II-level excavation, the curves tend to grow gently. After completion of the I-level excavation, the displacement curve presents a new turning point of sudden increase, and the rate of displacement change increases for about 20 days before the restoration of previous slow displacement change and final convergence. The rock stability is significantly affected by excavation, and the deformation during excavation accounts for above 80% of the total deformation during the measurement course. The slope deformation increases continuously after end of the excavation, but the deformation rate decreases obviously and the deformation tends to reach convergence. The horizontal displacement change curve is shown in Figure 12.
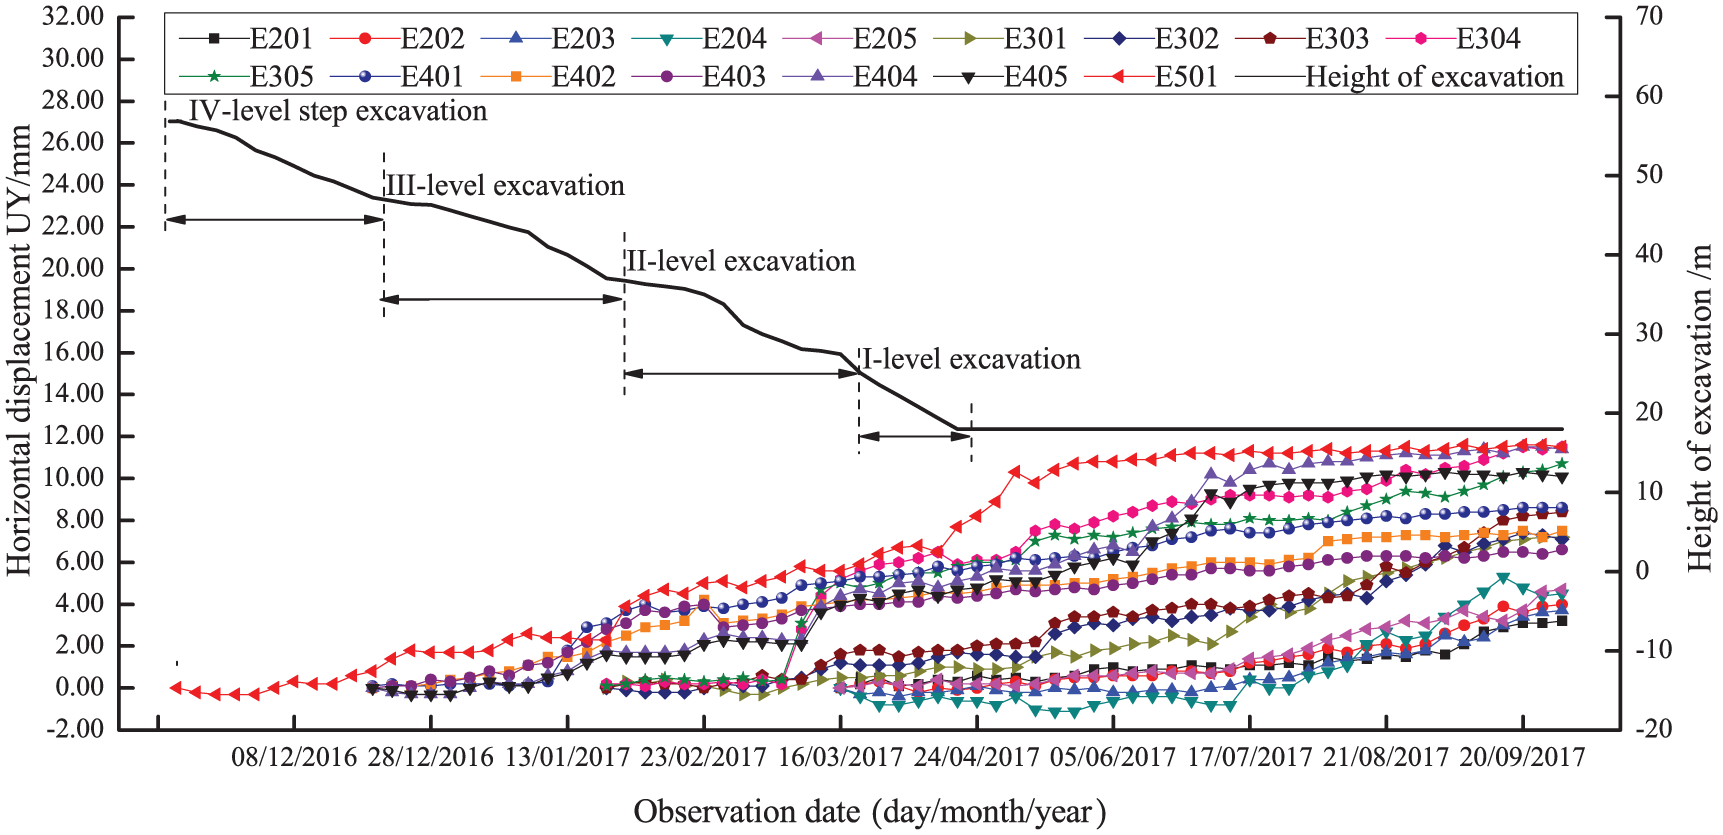
Variation of observed surface horizontal displacement (UY) with time.
The vertical displacement of the observation points is between 0 and 11 mm, and the E303 point presents a maximum vertical displacement of 10.60 mm. The elevation is 37.2 m, and the point is located on the III-level step. A total of four observation points have a vertical displacement of above 8 mm, and three of the four points are located on the III-level step. The displacement changes of the slope are very small when starting excavation of the IV- and III-level slope, and the growth rates are relatively slow. During the late stage of the II-level excavation, the displacement rates of the observation points all increase suddenly. The displacement curves present obvious turning points, and the curves generally present a changing trend of straight-line rising. After completion of the II-level excavation, the curves present a concave tendency, and the displacement rates slow down to some extent. Similar displacement change rules are presented for the I-level slope excavation. Most slope deformation occurs during I- and II-level slope excavation. The sedimentation rates are relatively small during early excavation, suggesting the slope is most significantly affected by external excavation disturbance factors in the I- and II-level steps. Near the steps, there is the junction of moderately weathering tuff rock formation and strongly weathering tuff rock formation. The structural plane is well developed, and slope excavation disturbance and unloading effect result in diastrophism of slip surfaces. During a late excavation stage, the sedimentation rate decreases, and the vertical displacement generally shows no increase. After completion of the excavation, the deformation rate basically tends to be stable, and the slope vertical displacement reaches convergence. The vertical displacement change is shown in Figure 13.
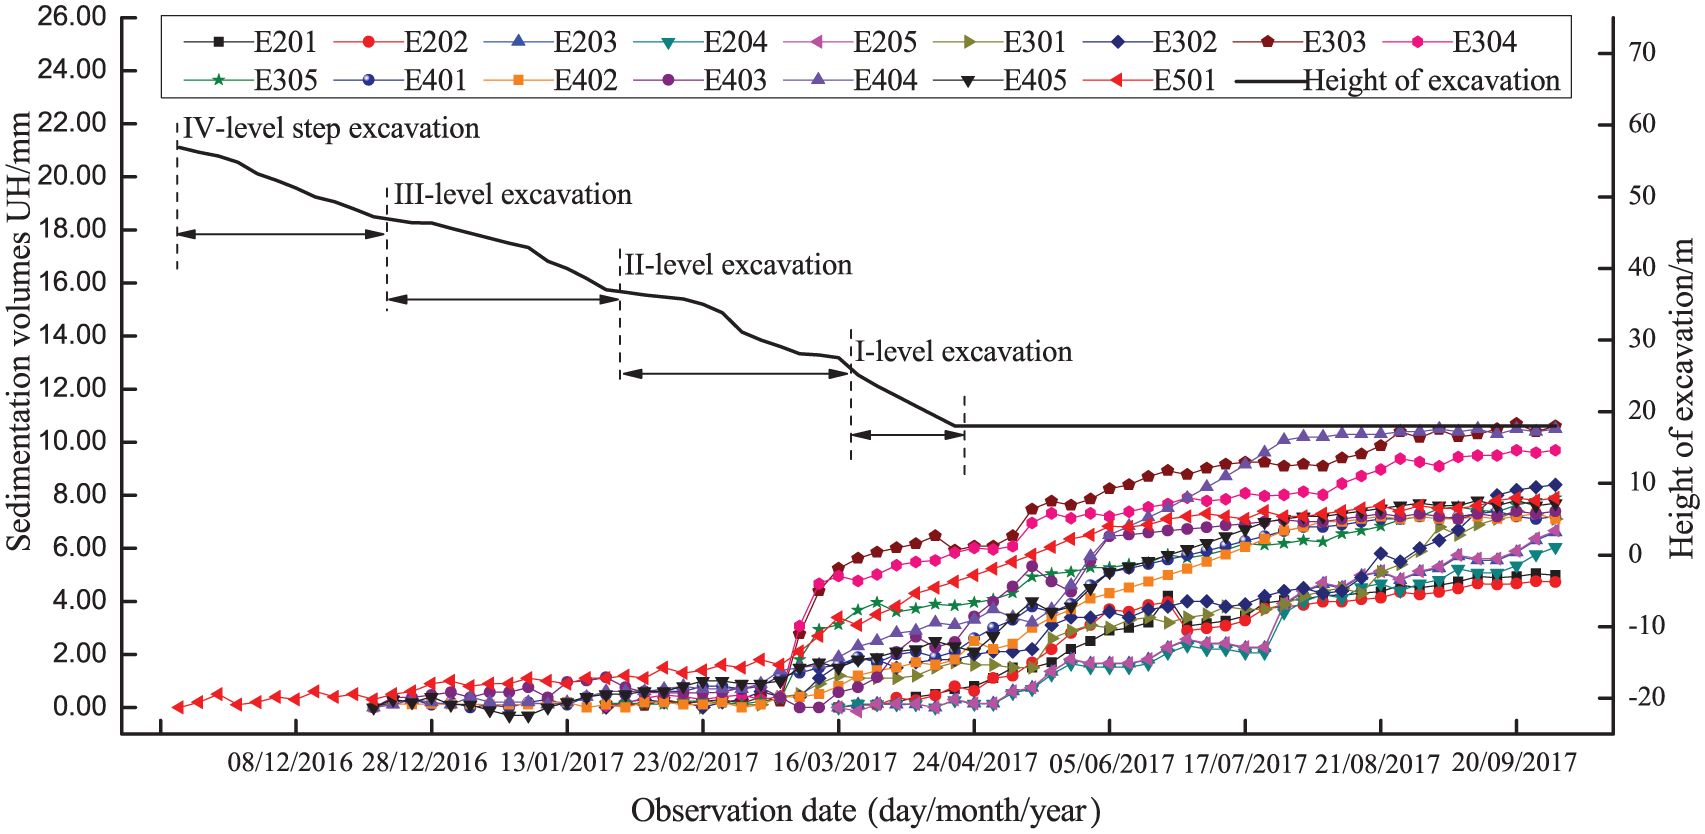
Variation of observed surface subsidence (UH) with time.
Internal deformation
Horizontal displacement measured by multipoint displacement meter
The multipoint displacement meter coded as E-SPK01 was set on the IV-level step. The monitored displacement change is presented in Figure 14. Among the three measurement points of the multipoint displacement meter, the point with a hole depth of 20 m presented a maximum displacement, and the displacement tended to be a stable value of 1.23 mm in August 2017. The point with a hole depth of 7 mm presented a minimum displacement, and the final displacement tended to be a stable value of 0.55 mm after completion of excavation in August 2017. During the whole monitoring process, the displacements of the 20 m depth hole were always larger than those of the others. It is suggested that slope excavation poses top impacts on deep rock mass. When starting II-level step excavation, the rate of displacement change is larger than those of other stages, and the site with a horizontal depth of 20 m is near the boundary between the strongly weathered rock formation and the crystal tuff formation of the slope rock mass. Due to weathered fracture development, the strongly weathered rock mass is broken. It can be speculated that the relatively large rock displacement is caused by diastrophism of the structural plane. Excavation of other steps poses relatively small impacts on slope deformation within the observation scope. After completion of the excavation, displacement rates of all measurement points converge, and the rock mass generally shows no deformation.
Variation of observed displacement by multipoint displacement measures E-SPK01.
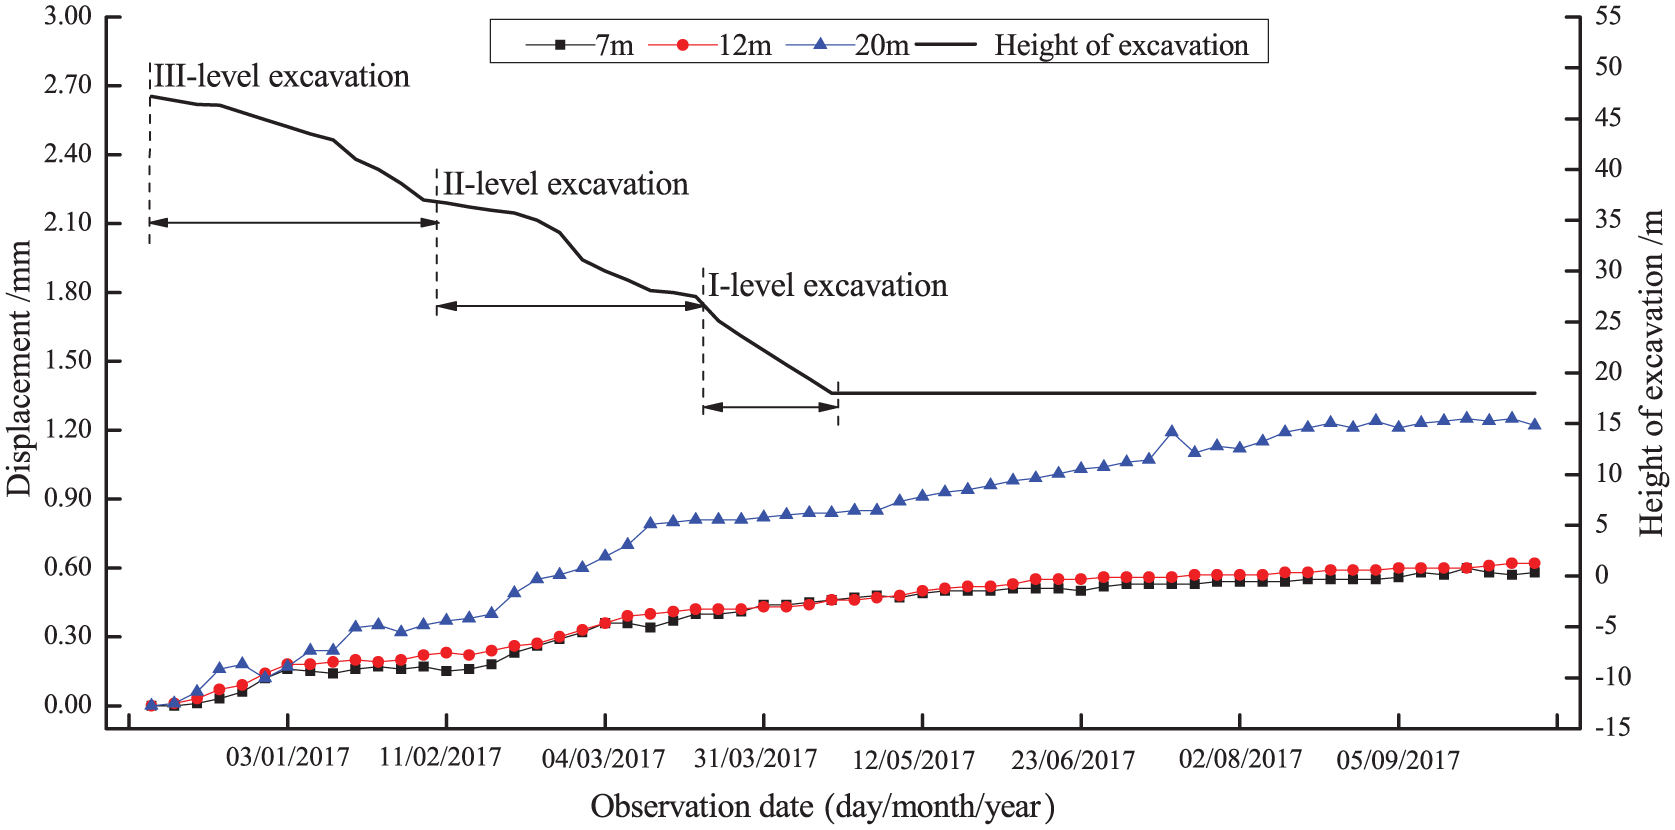
The multipoint displacement meter coded as E-SPK02 was set on the III-level step. The monitoring achievement is presented in Figure 15. Among the three measurement points of the multipoint displacement meter, the point with a hole depth of 20 m also presented a maximum displacement, and the displacement tended to be a stable value of 4.18 mm after completion of the excavation in May 2017. The point with a hole depth of 7 mm presented a minimum displacement, and the displacement tended to be a stable value of 2.36 mm. It is suggested that the impacts of the excavation on the rock deformation are most significant at the horizontal 20 m depth site. The deformation of the rock mass is relatively mild in the shallow part of the slope. The slope displacements are relatively large during the I- and II-level slope excavation, and the rate of slope displacement change gradually slows down after the completion of the excavation. The site with a horizontal depth of 20 m is near the boundary between the crystal tuff rock formation and the strongly weathering tuff rock formation. After completion of the excavation, displacement rates of all measurement points converge, and the rock mass generally shows no deformation.

Variation of observed displacement by multipoint displacement measures E-SPK02.
The multipoint displacement meter coded as E-SPK03 was set on the middle part of the IV-level step. The observation achievement is presented in Figure 16. Among the three measurement points of the multipoint displacement meter, the point with a hole depth of 20 m presented a maximum displacement, and the displacement tended to be a stable value of 0.45 mm after August 2017. The point with a hole depth of 7 mm presented a minimum displacement, and the displacement tended to be a stable value of 1.23 mm in May 2017. It is suggested that the influences of the slope excavation on the deformation of rock mass are relatively larger in the horizontal hole with a depth of 20 m. But the shallow rock mass of the slope presents relatively mild deformation and is slightly affected by excavation disturbance. As the three measurement points are located in crystal tuff, which generally has no oblique bedding, the rock mass displacements of the slope are relatively small. After completion of the excavation, the performances of all measurement points tend to converge.

Variation of observed displacement by multipoint displacement measures E-SPK03.
Horizontal displacement measured by the inclinometer
The A1 and B1 clinometer boreholes were observed from 4 December 2016 to 27 June 2017, and the relations between horizontal displacements and boreholes depths are indicated in Figure 17. It can be viewed from Figure 17 that the displacements within the A1 clinometer borehole are relatively larger at the 0–12 and 16 m depth sites. The overall displacements in the 0–12 m section are large (about 5.60 mm). It can be viewed from the typical vertical section profile of a slope that the slope rock of the section is stony clay and completely crystal weathering tuff with weak strength and poor stability. The excavation disturbance influences the stability of rock mass more significantly. Stony clay easily results in a landslide. To guarantee application safety, corresponding slope reinforcement measurements shall be taken. The site with a borehole depth of 16 m is located in the junction of crystal tuff rock formation and completely weathering tuff rock formation of the slope. The structural plane is also affected by excavation in a relatively significant way, and the displacement reaches 5.02 mm. It can be viewed from Figure 17 that the B1 clinometer borehole presents a maximum displacement at the 8 m depth site, the maximum value is 11.02 mm, and the elevation is about 28 m. The site is the interface between strongly weathering tuff rock formation and moderately weathering rock formation of the slope. The structural plane is well developed. There is a relatively large fault fracture zone, and it is significantly influenced by excavation disturbance and unloading action and is vulnerable to rock relaxing and dislocation of structural planes. The displacement at the borehole is about 8 mm, and the deformation rate is about 0.04 mm/d.

Variation of observed horizontal displacement with depth.
Conclusion
This article analyzed the deformation law of a typical slope excavation by surface deformation and internal displacement monitoring of rock mass by field monitoring. The following conclusions can be drawn:
From the start to the end of the slope excavation, the displacement of the slope increases and then tends to a stable level. Based on the data of horizontal displacement monitoring, it can be viewed that the silty clay layer on the slope top presents the potential safety hazard of overall slide down the rock lower soft structural plane. After the end of the excavation, the internal displacement reaches 5.91 mm, and the displacement tends to reach a convergence. Therefore, faults, tension cracks, and free face of a slope significantly influence the stability of the slope during construction.
During the slope excavation, both the surface displacement and horizontal displacement of the slope present larger changes at the start of the II-level slope excavation. Proper excavation of the II-level step rock mass plays a critical role in controlling global slope stability. Strongly weathered rock and moderately weathered rock are the main components of the site. Therefore, special attention shall be paid to lithological features of excavation sites during slope excavation. If the weathered rock is to be cut, monitoring of slope deformation shall be enhanced, and timely enhancement and support are required to avoid collapse, landslide, and other geological disasters.
In the monitoring data about influences of slope excavation disturbance on the surface slope layer, displacements at the UX, UY, and UZ directions are all larger in the V-level step. The lithological feature of the V-level step is silty clay, which is completely different from its lower rock mass for structure, mechanical property, and failure mode. The site is located in China’s south-east coastal area with relatively high precipitation, which results in increased water content of the soil layer. During a rainy season, the site is vulnerable to landslide disaster. Therefore, effective enforcement measures shall be taken for the silty clay layer.
Footnotes
Handling Editor: Paolo Barsocchi
Declaration of conflicting interests
The author(s) declared no potential conflicts of interest with respect to the research, authorship, and/or publication of this article.
Funding
The author(s) disclosed receipt of the following financial support for the research, authorship, and/or publication of this article: The research described in this study was funded by the Project Supported by Natural Science Basic Research Plan in Shaanxi Province of China (program no. 2019JQ-114), and the National Nature Science Foundation of China (NSFC) (grant no. 51978059). These financial supports are gratefully acknowledged.
Data accessibility statement
The data used to support the findings of this study are available from the corresponding author upon request.