
Abstract
Parkinson’s disease is found as a progressive neurodegenerative condition which affects motor circuit by the loss of up to 70% of dopaminergic neurons. Thus, diagnosing the early stages of incidence is of great importance. In this article, a novel chaos-based stochastic model is proposed by combining the characteristics of chaotic firefly algorithm with Kernel-based Naïve Bayes (KNB) algorithm for diagnosis of Parkinson’s disease at an early stage. The efficiency of the model is tested on a voice measurement dataset that is collected from “UC Irvine Machine Learning Repository.” The dynamics of chaos optimization algorithm will enhance the firefly algorithm by introducing six types of chaotic maps which will increase the diversification and intensification capability of chaos-based firefly algorithm. The objective of chaos-based maps is to select initial values of the population of fireflies and change the value of absorption coefficient so as to increase the diversity of populations and improve the search process to achieve global optima avoiding the local optima. For selecting the most discriminant features from the search space, Naïve Bayesian stochastic algorithm with kernel density estimation as learning algorithm is applied to evaluate the discriminative features from different perspectives, namely, subset size, accuracy, stability, and generalization. The experimental study of the problem established that chaos-based logistic model overshadowed other chaotic models. In addition, four widely used classifiers such as Naïve Bayes classifier, k-nearest neighbor, decision tree, and radial basis function classifier are used to prove the generalization and stability of the logistic chaotic model. As a result, the model identified as the best one and could be used as a decision making tool by clinicians to diagnose Parkinson’s disease patients.
Keywords
Introduction
Parkinson’s disease (PD) is a disorder of central nervous system and was first identified as “shaking palsy” 1 by Doctor James Parkinson in 1817. It is a progressive nervous system disorder caused by degeneration of brain cells which controls movement of different parts of the body and is the second most neurodegenerative disease after Alzheimer disease. 2 The first symptoms which characterize this disease are the problems of movement. The problems in movement include tremors and stiffness of limbs, impaired postures, and bradykinesia, whereas the other symptoms include sleep disorder, cognitive disorder, and neurobehavioral problems. 3 The findings of earlier research say nearly 90% of PD patients are affected with a motor-related symptoms called dysphonia and have been used for PD diagnosis. 4 In fact, this symptom can be observed even 5 years before being the patient diagnosed clinically with PD. Hence, this has been used as a reliable measure for detecting and monitoring PD. 5
Many functional learning algorithms have been used by researchers for diagnosing PD patients using dysphonic measurements as the symptoms. A Gaussian radial basis kernel 6 used as the learning function for support vector machine (SVM) for predicting PD dataset after applying search model to reduce the size of search space. Hence, four different dysphonic features, namely, “Recurrence Period Density Entropy, Harmonics to Noise Ratio, Pitch Period Entropy, and Detrended Fluctuation Analysis” were selected to identify PD patients. For early detection of PD, a hybrid instance-based learning model has been proposed 7 by combining a “chaos-based bacterial foraging optimization (CBFO)” with a “fuzzy-based k-nearest neighbor (FKNN).” The model shows better performance than other optimization methods when simulated with vocal measurements of PD patients. A hybrid model combining an “enhanced chaos-based firefly algorithm (ECFA)” with “radial basis function (RBF) kernel–based SVM” 8 develops an efficient model by predicting discriminant speech patterns from PD dataset and also helps to develop telediagnosis and telemonitoring models.
An efficient classification model is designed in Dash et al. 9 by identifying relevant features from microarray dataset employing a hybrid model by combining a meta search method based on information theory with chaotic firefly algorithm (CFA). The experimental outcomes of the research prove the quality of the hybrid model. It is observed so far from the literature that Naïve Bayes algorithm can predict the binding residues of DNA/RNA, whereas Murakami and Mizuguchi 10 have reported a novel kernel density estimation (KDE)–based Naïve Bayes algorithm which can also predict the residues for binding proteins in protein sequences. An adaptive block-wise Naïve Bayes kernel machine model is discussed in Minnier et al., 11 which operates in multistage to improve the estimation of genomic biomarkers in a diseased dataset.
Smart algorithms and optimization techniques have been used for a long time to diagnose diseases. Recent examples of research 12 include adaptive neural net for diagnosing diabetes, 12 “multi-stage classification of congestive heart failure based on short-term heart rate variability,” 13 and “early prediction of paroxysmal atrial fibrillation based on short-term heart rate variability.” 14 Recently, metaheuristic search algorithms have been used efficiently for solving optimization problems of different domains. Mostly, the metaheuristic algorithms mimic the characteristics of living and nonliving things and are not dependent on the characteristics of the given optimization problem. Therefore, the above-mentioned characteristic helps to broaden 15 the field applications. There are two types of metaheuristic search algorithms used for feature selection process, namely, single solution–based metaheuristics (SBM) and population-based metaheuristics (PBM). The difference between these two methods is that the former uses a single solution for manipulation during the search, whereas a population of solutions is used for searching operation. Hill climbing, Tabu search, and simulated annealing are some of the representative examples of SBM, 16 which suffer local optimum. Unlike SBM, PBM methods adopt an iterative improvement of the population of solutions. Some of the PBM algorithms are genetic algorithm (GA), 16 particle swarm optimization (PSO), 17 differential evolution (DE), 18 and bat algorithm (BA).19,20 All these algorithms start with an initial population of random solutions at the beginning of the computation and then use iterations for subsequent evaluations.
Among them, the most important algorithm in the family of swarm intelligence is FA, which has been used in several areas of approximation problems including engineering practice.15,21–23 The FA is conceived on the “idealized behavior of the flashing characteristic of fireflies.” The literature study shows that 22 FA has surpassed the “GA” and “PSO.”
The two important characteristics of metaheuristic search algorithm which play a crucial role in achieving global optima are exploitation and exploration. Many researchers have proposed several methods24–28 to equalize them to improve the performance of metaheuristic algorithms. Recently, a paradigm of mathematics known as “chaos theory” is combined with the domain of stochastic optimization algorithms to increase the efficiency. The three dynamic characteristics of chaos,29–31 such as (1) “quasi-stochastic property,” (2) “sensitivity toward initial conditions,” and (3) “ergodicity,” are attributed as the key factors to be dealt with the stochastic optimization algorithms.
The random parameters of the probabilistic algorithms are replaced by chaotic maps.29–32 Different types of chaotic maps are used for tuning the attractiveness parameter β in the FA to enhance the convergence rate and accuracy and “a chaos-enhanced FA 32 is introduced to automate the tuning of parameters.” Yang 21 developed a chaos-based FA applying a “logistic map for attractiveness” and “absorption coefficient in place of Gaussian or Lévy flight distributed random variables” and applied to a global optimization problem. A novel metaheuristic algorithm “chaotic crow search algorithm (CCSA) was developed by Sayed et al. 33 to optimize the feature selection problems employing 10 different types of chaotic maps to enhance 34 the classification performance and identify a reduced feature set.” In Dos Santos Coelho et al., 15 “a modified FA is developed by combining chaotic map to solve reliability and redundancy based optimization problem.” In this case, the logistic map improves the quality of the absorption coefficient as well as the randomized parameter and moreover shows outstanding performance over other optimization techniques, like dynamic programming, integer programming, and mixed-integer programming. A “Tinkerbell chaotic map” 23 was combined with the chaotic firefly and was tested against a multi-loop proportional–integral–derivative (PID) controller with promising results. The hybrid model was also compared with GA, PSO, standard FA, and modified FA. The randomizing and attractiveness parameters were enhanced with tent chaotic map 35 for solving the economic load dispatch application, and the reported results shown good convergence characteristics on test cases when compared with other soft computing techniques reported in literature. In Gandomi et al., 30 the attractiveness and absorption coefficient parameters of chaos-based FA were enhanced with chaotic maps of 12 different types and applied to a global optimization problem. The result was promising and showed that some of the chaotic maps have surpassed the results of the standard FA. Similarly, a metaheuristic CFA 36 was proposed for finding optimal solutions for “support vector regression (SVR) parameters” that was used to forecast the pricing of stock market considering all three parameters of FA, that is, “randomized parameter, attractiveness and absorption coefficient” that were augmented with “logistic chaotic map.” The efficiency of the algorithm has beat the results obtained by “chaotic genetic algorithm–based SVR (SVR-GA),”“firefly-based SVR (SVR-FA),”“artificial neural networks (ANN),” and “adaptive neuro-fuzzy inference systems (ANFIS).” In addition to this, the components of FA which are responsible for the movement of FA that is, “attractiveness and absorption coefficient,” were augmented with a “sinusoidal chaotic map” 37 for a parallel calculating numerical integration in engineering problem. The simulation results showed a high convergence rate, high accuracy, and robustness of the proposed CFA. In Fister et al., 38 various probability distributions like uniform, Gaussian, and Lévy flights as well as logistic and Kent chaotic maps are used to develop a randomized FA, wherein the randomized parameters were enhanced with the probability distributions and chaotic maps and also produced a promising solution. CFA was adopted for optimization of skeletal structure design. 39
The applications of firefly metaheuristic algorithms can be found in many advanced problems like multi-lingual named entity recognition 40 and financial option pricing where parallelization of firefly technique 41 is applied.
Selection of most relevant features or the patterns from the complex and large datasets is a challenging task. The feature selection technique of data mining and machine learning is the appropriate measure to handle this task by removing irrelevant and redundant features. 42 This method has been employed very effectively in many areas namely, cancer diagnosis and prognosis, 43 text categorization, 44 genome project, 43 and image retrieval. Basically, the feature selection techniques are categorized based on the use of classification algorithms for evaluation purpose. Two most widely used feature selection algorithms are filter and wrapper-based algorithms. 42 Filter-based algorithms use statistical methods for evaluating the feature subsets which are efficient in terms of computing time than wrapper algorithms as it evaluates the feature subsets using classification algorithms. They provide better results than filter methods, but are computationally expensive. Therefore, to alleviate this deficiency of wrapper methods, metaheuristic search methods are required 9 that could help to reduce computing time to achieve optimal solution rather than stuck up at local optima.
The adaptive searching characteristic of metaheuristic search algorithms increases the possibility of finding optimal solution from the feature space. Several metaheuristic algorithms have been employed effectively in many complex optimization problems. Some of them are PSO,18,45,46 crow search algorithm (CSA), 32 Grey Wolf Optimizer (GWO), 33 teaching–learning–based optimization (TLBO), 47 harmony search (HS), 48 BA,19,49 moth-flame optimization (MFO), 50 and animal migration optimization (AMO). 51
CFA literature indicates that enhancing the chaotic maps in the CFA has achieved higher convergence rate, higher accuracy, and robustness. This implicates that it increases the explorative power in the search process that helps to overcome local optima problem. Therefore, finding the best feature subset with no loss of classification accuracy in diseased datasets particularly in small complex clinical datasets is a major challenge. The literature survey has shown that the developments in addressing this issue with the help of metaheuristic search algorithms 9 on the basis of comparison of numerous features, classification accuracy, and generalization of features are very limited. However, there is further scope to improve the search process to detect the significant markers and to develop the generalized predictive models for disease diagnosis. Such that our work is a continuous study of Dash et al. 31 in which we analyzed how firefly algorithm can be implemented for diagnosing PD.
The main contributions of this research are explained in the following: a comprehensive study is designed to assign the initial values to the population of candidate solutions chosen for fireflies using six different chaotic search maps and also use the same to update the value of absorption coefficient γ. This work introduces a hybrid algorithm that uses the functionalities of the Naïve Bayes algorithm based on kernel estimation approaches for assessing the quality of the proposed objective function. Here, again objective functions of six different types are considered by combining six types of chaotic maps with standard firefly algorithm (SFA). The efficiency of the chaotic search models is evaluated in terms of PD dataset in view of the length of subsets, light intensity, p values, and fitness values. In the final step, the credibility of the resulting subsets is tested applying five well-known classification algorithms.
The organization of this article is as follows: an overview of the functioning of kernel density estimation–based Naïve Bayes algorithm is presented in section “Kernel density estimation function–based probabilistic algorithm.” A description of the problem methodology is given in section “Description of methodologies used.” Section “Proposed kernel density estimation–based probabilistic chaotic firefly algorithm (CFA-KNB)” presents the proposed kernel density estimation–based probabilistic chaotic firefly algorithm (CFA-KNB) and the dataset and the environment of experiment is explained in section “Settings of the experiment.” The analysis of the experiment and discussion is explained in section “Results and discussion.” Section “Conclusion” concludes the article with future work followed by an exhaustive reference section.
Kernel density estimation function–based probabilistic algorithm
Naïve Bayes is a probability-based learning algorithm to be used in specific scenarios involving supervised learning problems. Generally, it is a specialized form of Bayes Rule called as Naïve as it depends on two important assumptions. 52 In particular, for the given class, the predictive features are conditionally independent from each other and the second assumption asserts that any hidden features cannot affect the prediction model. The NB algorithm has proved its efficiency in variety of application areas such as disease diagnosis, 53 text processing, 54 and image processing. 55 The core functioning of Naïve Bayes algorithm is exemplified as in an instance, the class value is assigned as “C” and X is a random variable representing the observed values of the attributes. Let the observed feature values of the training dataset (X, C) be vector X = (x1, x2, x3, …, xn) for C = (c1, c2, …, cm). The predictive features of the observed sample of a given vector and the probability of each corresponding class values can be evaluated with the help of equation (1)

where j = 1, 2, ……, c.
P(Yj) is the prior probability of class Yj and P(Yj|X) is the conditional probability density function of the class Yj.
For the given dataset, it is assumed that each variable has achieved conditional independency. Hence, equation (2) can be applied to estimate the test dataset using the training dataset
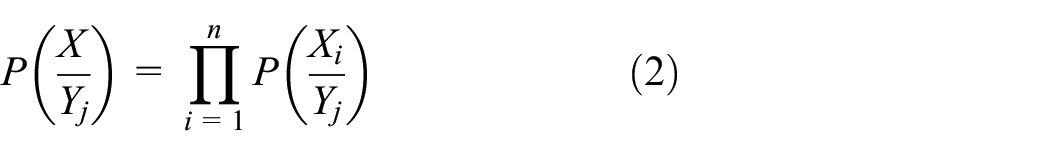
where j is the class value that varies from 1 to c, Xi is the value of ith attribute of vector X, and n is the total number of attributes.
Moreover, equation (3) is used to calculate the probability distribution function over the set of observed features

where Ci is the ith class.
However, NB handles continuous and discrete attributes in a different way. For each discrete attribute, the probability that the attribute X will take a particular value x when the class value c can be assigned by a single real number either 0 or 1 and is represented as p(X = x/C = c), whereas each continuous feature is modeled by some continuous probability distribution over the range of the values of the attribute. In Naïve Bayesian approach, often an assumption is made that the values of the continuous features are normally distributed within each class which can be represented as mean

where

Equation (5) represents the probability density function (pdf) of a normal distribution function and the first term is the conditional probability estimation. The drawback of it produces a small set of parameters for estimating training data.
To overcome this issue, the density of each of the continuous features 56 of the PD dataset is estimated using KDE function, and then, the calculated density estimation is averaged over a large set of KDE for identifying PD patients from healthy one. Hence, the conditional probability Pi(xi|C = c) can be estimated using KDE for the training dataset applying equation (6)

where σ and K are replaced by h and g (x, μ, 1). The advantage of kernel density estimator–based NB over simple NB is that the former computes the pdf n times and the later computes only once for each of the observed values of X in the class c that indicates K as the possible number of unique values of features of input X.
Description of methodologies used
In this section, firefly algorithm and the chaotic maps are highlighted before being used to develop the proposed model.
Firefly—a metaheuristic algorithm
Firefly algorithm is a member of the family of swarm intelligence algorithms and was developed by Yang. 22 The lighting bugs called fireflies generally seen flashing their lights in the sky during summer nights. The significance of the flashing behavior of fireflies is either to draw attention of a mating partner or to get shielded from the exploiters. Another important characteristic of fireflies is that not only the intensity of the light I gets decreases when the firefly is away from the brighter one but the air also affects the light intensity by absorbing it when the distance increases. As a result, the value intensity of light is directly corresponding to the fitness value. However, the complexities of the natural behaviors of fireflies motivate to make three assumptions for developing a working principle of the algorithm. The suppositions are as follows:
All fireflies assumed to be unisex and attraction happened among them regardless of their sex.
Attractiveness is relatively proportional to the brightness of fireflies and it reduces as the distance increases between them.
The brightness or the light intensity is computed by the feasible solutions of the objective function.
It is very clear from the suppositions that the intensity of light I(r) of fireflies is inversely related to the distance r as it decreases when distance increases and again light also gets absorbed when passes through the air. The notation γ is used as coefficient of light absorption. As a result, equation (7) shows the variation of intensity of light I(r) 22 of fireflies with respect to distance r

where I0 is the initial value of intensity at the source and the attractiveness parameter β can be defined in two different ways as shown in equations (8) and (9)

or

when distance r = 0, the attractiveness parameter is denoted by β0.
The movement of fireflies is computed 22 from the following behavioral rule that is when the firefly at position xi gets closer by the attractive power of a brighter firefly at position xj, then the new positional value is calculated following equation (10)
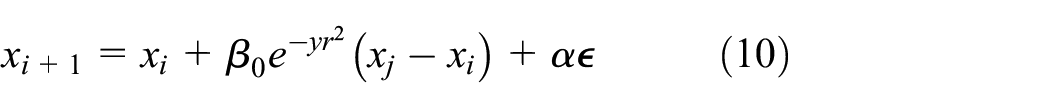
where α represents randomization parameter and
Characteristics of chaotic maps
The chaos optimization theory is a nonlinear phenomenon29,30,32 that develops the trajectories to traverse all the states nonrepetitively in a certain range, hence enabling to provide an optimal search configuration for the problem. The chaos theory transforms the candidate variables from chaotic sequences to solution space by strictly adhering to the initial condition. Three of the characteristics of chaotic optimization theory, namely, “randomness,”“ergodicity,” and “regularity,” of chaotic motion help to secure global optimal solution avoiding the limitation of local optima. Hence, the integration of chaotic maps into the metaheuristic algorithm enhances the efficiency of nature-inspired metaheuristics33,34,57 by using the deterministic chaotic maps instead of the random variables. However, from the literature study, it can be surmised that sharpening the chaotic maps in the CFA structures will lead to the following enhancements: “higher convergence rate, higher accuracy, and higher robustness.” These introduce a higher diversity in the search process preventing it from being localized. Retrospectively, Fister et al. 38 indicate the importance of the problem in the efficacy of the algorithm.
In this research, chaotic maps of six different types are used for initializing the population of firefly algorithm and also used for varying the value of absorption coefficient instead of maintaining a constant value throughout the search process. This hypothesis helps to identify most relevant subset of features from PD dataset to optimize the predictive accuracy and generalize the predictive model.
Six different chaotic mappings, namely, logistic map, sine map, Chebyshev map, circle map, gauss/mouse map, and piecewise map, are surveyed here to generate chaotic sequences for the FA. The objective of this problem is to select the best mapping of chaotic map with FA after making a comprehensive comparison of all six chaotic mappings30,32 based on the basis of length of the feature subset, accuracy, and generalization.
Logistic map
Second-order polynomial function 15 is used to generate the chaotic sequence

where r denotes the control parameter. The range of values assigned to x0 and r are as follows: 0 ≤ x0 ≤ 1 and 0 ≤ r ≤ 4. The logistic map, x0, should not take the value from {0.0, 0.25, 0.75, 0.5, 1.0}. Equation (11) indicates a deterministic dynamical system with discrete time. When r = 4 and the values bounded within the ergodic area, 0 ≤ x0 ≤ 1, the system enters to fully chaotic state. This configuration of the map is adopted in this article.
Sine map
The following discrete time dynamical system 29 is produced by sine map

where λ is the control parameter in the range 0 ≤ λ ≤ 1 and the range of ergodic area is [0,1].
Chebyshev map
The following iteration function 58 is used to produce the Chebyshev chaotic sequence

where k represents the number of iteration, and the range of ergodic area for the map is [0,1]. This map is used to obtain the chaotic time series xk.
Circle map
The following iteration function is used to generate the chaotic sequence xk in circle map using a = 0.5 and b = 0.2 37

The range of the ergodic area of the map is [0,1].
Gauss/mouse map
The nonlinear iterated function given in equation (15) is defined by Gaussian function 32

The deterministic chaotic sequence is produced in the interval
Piecewise map
The following iterated function 33 is used to evaluate the four linear pieces that generate the chaotic sequence for the map

where the endpoints of the four subintervals are denoted by d range of values set as dϵ [0, 0, 5] and the computed chaotic time series capture the interval xnϵ [0, 1].
Proposed kernel density estimation–based probabilistic chaotic firefly algorithm (CFA-KNB)
The proposed kernel-based metaheuristic model integrates a chaos-based search algorithm for optimizing the search operation and a kernel-based stochastic learning algorithm to measure the fitness of the subsets of feature obtained from each iteration.
In this model, the fireflies are represented as chaotic variables rather than randomly distributed variables. The initial population of the search algorithm is selected using chaos-based firefly algorithm. The chaotic sequences xi developed by different chaotic maps update the positions of fireflies and the absorption coefficient γ in the solution space. Even though, the random initialization generates a homogeneously distributed fireflies in the solution space, but the convergence to the optimal solution is not sure. On the contrary, the chaotic mappings not only select
37
important fireflies from homogeneously distributed fireflies but also enhance the precision and convergence rate of the coupling metaheuristic algorithms. Since the random vector term


where
From equation (10), it is quite apparent that the social movements of fireflies which play an important role in finding most relevant candidates from the population are regulated by the attractiveness parameter β which in turn depends on the light absorption parameter γ. Generally, it assumes a fixed value throughout the optimization process. Though this parameter controls the changes in the attractiveness, and its value determines the speed of convergence and behavior of FA algorithm, therefore, in this study six types of chaotic maps

The parameter γ now characterizes the variation in the attractiveness, and its value is crucially important in determining the speed of the convergence and how the FA algorithm behaves. The chaotic map

Initialization of experimental parameters of CFA
The chaotic sequences generated by equations (11)–(16) are being used by the population of fireflies to create an initial mapping and also change the chaotic values of absorption coefficient γ during the iteration process. The initialization of the remaining parameters is done with the values following Goldberg16 with few exceptions described in section “Results and discussion” and summarized in Table 1. The position of each of the firefly in the population indicates a subset of features of varying sizes.
Values of the parameters used in the experiment.

FA: firefly algorithm; CFA: chaotic firefly algorithm.
Fitness evaluation function
The fitness function is used to evaluate the discriminative power of each of the candidate solutions (fireflies) iteratively using 10-fold CV scheme. The stability of the model could be achieved through 10-fold CV by randomly splitting the dataset into two training and testing datasets. The fitness function given in equation (20) is designed by considering the objectives of the proposed model, namely, optimizing the rate of accuracy and the length of the subset. Both of them are assigned with weight factor proportional to their contribution in the process of optimization. A kernel density estimator–based probabilistic supervised algorithm, that is, KNB, is proposed to evaluate the efficiency of the feature subsets in view of learning accuracy and mean squared error (MSE). The advantage of KNB over standard NB is each of the observed value of X in a class c is computed n times, which is called the kernel (K): the number of possible unique values of features in input X
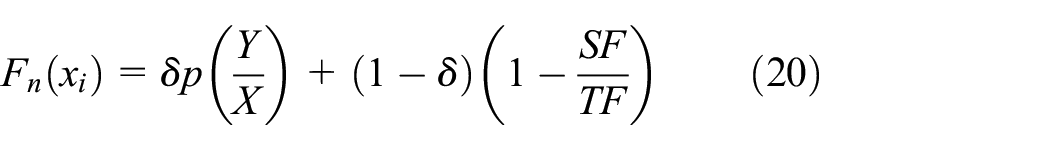
where P
Termination criterion
Generally, the termination criterion for an optimization algorithm is set to either maximum number of iterations or the intended solution to be reached. In this problem, maximum number of iterations is considered as the termination criterion of the optimization algorithm. The algorithm will terminate its operation when it reaches to the maximum number of iteration which is fixed to 20 for the whole experiment.
Settings of the experiment
Brief description of the Parkinson dataset
The symptoms, namely, trembling of legs, arms, hands and postural instability, bradykinesia, and tremor are quite reliable characteristics1–3 to diagnose Parkinson disease. Besides, studies4,6 of many researchers showed that voice measurement is one of the reliable techniques for diagnosing PD patients. According to the published literatures, more than 90% of PD patients show voice deterioration4,5 of some kind. Parkinson’s dataset used here is created by Max Little 59 of University of Oxford, in collaboration with the National Centre for Voice and Speech, Colorado, who recorded the voice signals. In this experiment, biomedical voice measurement dataset submitted by Little et al. 59 in UCI public domain repository is used to conduct the experiment. The data set contains the voice measurements of 31 participants, 23 with PD, and 8 healthy people. The age of the participants ranged from 46 to 86 years. The PD dataset shown in Table 2 comprises 195 voice recordings of 31 individuals recorded in rows and voice measures of 22 types recorded in columns of the table. There are around six recordings per patients available in the dataset. The disease status of each patient is represented in a column which is added as the last column of the data table. 59 The status column is used to discriminate the PD patients from healthy, where the status is set to 1 for PD and 0 for healthy people.
Features of Parkinson’s disease used in the experiment adapted from Little et al. 59

Experimental setup
The empirical study of the kernel-based probabilistic model for predicting potential subset of features and classification of the model CFA-KNB is implemented in Java using Weka API and executed in Windows 10, Intel(R), core-i7-7500U CPU at 2.70 GHz and 12.0 GB RAM. Clinical dataset contains outliers and extreme values which affect the overall performance of the model. Here, the outliers of the PD dataset are removed using a pre-processing tool called interquartile range (IQR).
In this article, chaotic maps of six different types are integrated into firefly algorithm, thus form six different types of chaotic firefly search algorithms that are used as search models. The chaotic mappings, namely, logistic, sine, Gauss/mouse, Chebyshev, and piecewise, are used to enhance the variability of the population by increasing the randomness while generating the new solutions. The execution of each of the chaos-based Firefly algorithms is fixed to 20 times as the generation is fixed to 20 for a population of size 50 along with other parameters which is given in Table 1, adapted from Dash et al. 9
The results were evaluated by k-fold CV 60 to guarantee robustness and reliability of the selected feature subset. Generally, k assumes value of 10. This method splits the data into 10 folds and keeps nine folds to form training set and the 10th fold to form test set. Then, an average result is computed by averaging over 10 trials. The chaos-based hybrid firefly models and other models used for comparison are tested by using a stratified 10-fold CV that ensures to achieve stable and generalized solutions by assuming all test sets to be independent from one another. Stratified 10-fold CV also tests the classification performance of the model. The working principle of the validation scheme is it divides the whole dataset into folds of samples of equal proportion for a given class. Hence, by doing that the proposed model could able to efficiently manage the skewness of the PD dataset. Moreover, the final solutions of the approximation model are obtained by averaging over 10 independent iterations to select the best configuration of the chaotic CFA-KNB model that ensures best optimum solution.

Flow representation of CFA-KNB model.
Performance metrics
The best fitness and average fitness values are taken to evaluate the effectiveness of the features selected from PD dataset. These two measuring values are calculated based on the accuracy and MSE of the classifier algorithm KNB. The classification performance 61 of the model and other classification counterparts are evaluated on accuracy (ACC), sensitivity, F-measure, confusion matrix, MSE, false-positive rates (FPR), Mathew correlation coefficient (MCC), area under receiver operating characteristic (AUC), and model building time. Some of the metrics are defined as follows


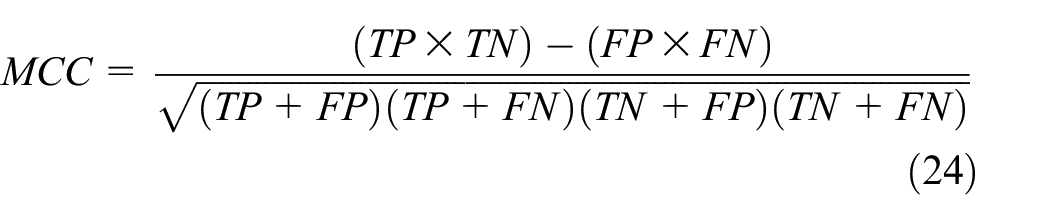
where TP is the “True Positive,” which specifies the number of patients correctly classified as PD patients by the model; TN is the “True Negative,” which specifies the control observations identified as healthy; FN is the “False-Negative,” which specifies the number of patients falsely identified as healthy, and FP is the “False-Positive” that shows the number of healthy patients incorrectly identified as PD by the induction algorithm.
As the PD dataset is an imbalanced dataset, F-measure and MCC are more reliable metric than accuracy measure for evaluating the performance of the model. In F-measure, β is set to 1, which handles the weight factor of sensitivity and precision that varies from 0 to ∞ in this experiment. MCC takes value between −1 and +1, and +1 indicates desired prediction and −1 shows a disagreement between actual and predicted and 0 as random predictions. In addition to the above measures, MSE, AUC, 62 model building time, number of kernels evaluated for each selected features for building the classifier models and two visualization techniques, namely, receiver operating characteristic (ROC) curve and calibration curve, are used to evaluate the quality of the model.
Results and discussion
The experimental results are analyzed and discussed in two subsections supported with two types of graphs.
Analysis of the performance of kernel-based probabilistic model (CFA-KNB) with respect to six chaotic mappings
The pre-processing step of the experiment has reduced the size of the instances from 195 to 178 by removing outliers and extreme values of the dataset. As a result, the skewness of the dataset increases from 32.65% to 33.83%. Then, the efficiency of the six different probabilistic chaotic models (CFA-KNB) is compared with respect to the least value of light intensity, best and average fitness value, least Wilcoxon’s p value, and feature subset size. The results of the above parameters are compiled in Table 3 for identifying the best mapping of (CFA-KNB) feature selection model for the imbalanced dataset 9 like PD. The value of chaotic parameter is set by trial and error within the range of 0.1–4.0 shown in Table 1.
Selected features by kernel-based search model (adapted from Dash et al.). 31
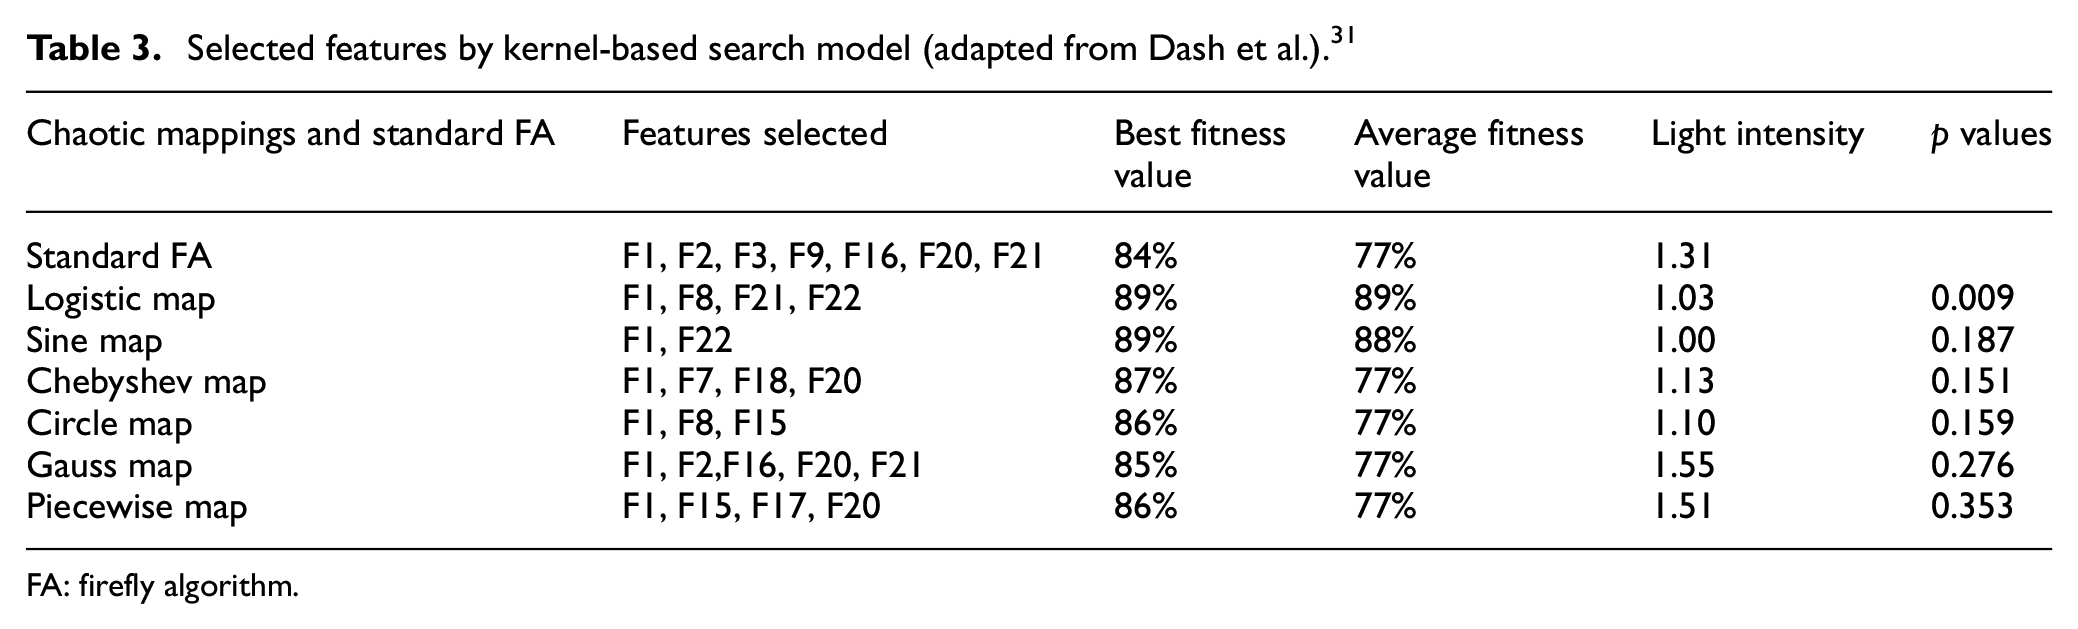
FA: firefly algorithm.
The comprehensive results achieved from six different probabilistic chaotic models (CFA-KNB) mappings and standard (FA-KNB) model are summarized in Table 3 for best and average fitness, light intensity, and Wilcoxon’s p value using 10-fold CV where each fold iterated 10 times. In this table, the chaotic sine mapping of the probabilistic model (CFA-KNB) has achieved a smallest subset of (F1, F22) as the discriminating features. The best and average fitness obtained by the sine model is 89% and 88%, respectively. Also, it has obtained least light intensity of 1.0 and p value of 19%. Then, the performance of the logistic chaotic mapping that performs better with the (CFA-KNB) model in terms of least p-value of 0.009, light intensity of 1.03, best and average fitness value of 89%. The feature subset selected by logistic mapping of the (CFA-KNB) model is (F1, F8, F21, F22). Next is the circle mapping which selects three features (F1, F8, F15) with best fitness of 86%, average fitness of 77%, light intensity of 1.10, and p value of 0.159, followed by Chebyshev (F1, F7, F18, F20) with best fitness of 87%, average fitness of 77%, light intensity of 1.13, and p value of 0.151. Piecewise mapping (F1, F15, F17, F20) selects four features, whereas Gauss chaotic model selects highest five features (F1, F2, F16, F20, F21). Comparing the performance of these two models, no such significant achievement is observed for the remaining parameters.
In this experiment, SFA is used only for computing p values for six chaotic mappings. Although, logistic, Chebyshev, and piecewise mappings have selected four features each but logistic model has acquired the most significant results on the basis of attaining best p value, light intensity value, and best and average fitness value. Hence, the analysis and comparison of results of Table 3 clearly indicate that the logistic mapping–based model (CFA-KNB)8,9 has obtained significant solution in the search domain with respect to all the measures, that is, light intensity, p value, and best and average fitness value which is considered as criteria of evaluation of feature set except the size of the feature set. Even though sine and circle mapping have selected small feature set, their performance in other three criteria of evaluation is insignificant.
The results of the above-mentioned chaotic mappings are also statistically tested using Wilcoxon’s rank sum test which is a robust estimation tool that depends on rank estimation. 63 The p values are presented in Table 3 for the standard FA-KNB versus six chaotic mappings and that shows the p value <0.01 for logistic mapping. Therefore, the performance of logistic chaotic (CFA-KNB) model is highly significant in comparison to other chaotic models. In addition to the above findings, another important pattern is derived from the occurrences of features in the feature subsets that help to understand the diagnosis process of PD patients. Analyzing the subsets given in Table 3, it is found that 11 features, that is, F1, F2, F7, F8, F15, F16, F17, F18, F20, F21, and F22, are selected in different combinations from the six different chaotic models. The first feature F1 appears in all six chaotic models, F20 appears in three chaotic models, and each (F2, F15, F21, and F22) appears twice in the computation of subsets. However, the features (F7, F8, F16, F17, and F18) appear once in the feature subsets. Finally, the most interesting outcome from this analysis is that the group of features (F1, F8, F21, and F22) selected by logistic mapping have been repeatedly selected by other chaotic models. Hence, this set of features can be recognized as clinical biomarkers for PD diagnosis and prognosis. Summing up the whole analysis of Table 3, it is quite apparent that the logistic mapping 29 has improved the characteristic of diversity of the population of fireflies and thereby helps in finding an optimal feature subset to design the diagnostic model for PD. In addition, the above findings can be interpreted as the length of the feature subset cannot be considered as a strong evaluator of optimal feature subset selection model for a small clinical dataset like PD as argued with evidence.
To develop a diagnostic model for a clinical dataset, a group of potential features of subset with high discriminating power which can improve the classification accuracy is highly essential for quick decision making. 64 In this regard, the classification performance of the kernel-based Naïve Bayes (KNB) algorithm is recorded in Table 4 for all six chaos-based (CFA-KNB) model on the skewed PD dataset. The measures used for studying the performance of the algorithm are accuracy (ACC), F-measure, sensitivity, MSE, MCC, AUC and model building time, which are measured over 10 iterations of stratified 10-fold CV. The 33.83% skewness of the PD dataset is handled effectively by the stratified 10-fold CV.
Classification performance of KNB on standard (FA-KNB) and (CFA-KNB) model using stratified 10-fold CV.

KNB: kernel-based Naïve Bayes; FA: firefly algorithm; CFA: chaotic firefly algorithm; MCC: Mathew correlation coefficient; MSE: mean squared error; AUC: area under ROC curve.
The logistic chaotic kernel–based predictive model (CFA-KNB) has outperformed all other models by efficiently attaining best results for KNB classifier for all measures, namely, 89.33% of accuracy (ACC), 89% of sensitivity, 88% of F-measure, 29% of MSE, 30% of FPR, 70% of MCC, 91% of AUC, and 7.14 s of model building time. The best performance values of the logistic model are highlighted in bold letters and the worst performance of Gauss Chaotic Model is shown in italics and bold in Table 4. However, the model building time of worst model is the second lowest, that is, 11.79 s. The poor performance of other models can be attributed to the selected features that are not adequate or redundant to identify the PD patients from healthy persons that is apparent from Table 6. Another four models such as (CFA-NB), (CFA-RBFC), (CFA-KNN), and (CFA-J48) evaluated for all six chaotic mappings and the results are displayed in Tables 7–10.
Further, a 2 × 2 confusion matrix is computed for all the six chaotic models to find correct decisions and error committed in the classification experiment. Table 5 summarizes the confusion matrices obtained from the proposed model with six chaotic maps and the nonparametrical sign test for all models. The weighted average FPR of logistic model is 30% as shown in Table 4, the smallest among all the results of chaotic maps. Piecewise model has got the highest FPR 34%. This observation is fully supported by the results of Table 5. The confusion matrix gives a comparative result of all the models and that proves the diagnostic efficiency of logistic (CFA-KNB) model over others.
Confusion matrix with nonparametric sign test result of six different chaotic (CFA-KNB) classification models.

CFA-KNB: chaotic firefly algorithm-Kernel-based Naïve Bayes.
In addition to the above analysis, two types of visual presentations, namely, area under ROC and calibration curves, depicted the quality of classification result of six different chaos mapping of (CFA-KNB) model and helped to find the optimal chaotic map of (CFA-KNB) model.
Figures 2 and 3 show the calibration curve for the healthy and a PD patient for all six chaotic models. The curve is traced in both figures using estimated probability against the observed probability for healthy and PD patients based on 13 equal frequency bins. This curve actually preserves the order of the samples to achieve a well-calibrated model, which could distinguish the samples accurately, thereby attains higher accuracy, and the curve generally represented by a diagonal on the graph. Examining both Figures 2 and 3, it is summarized that the calibration curve for PD and healthy patients are well traced in (CFA-KNB) logistic-based model over other models.

Calibration curve of six chaotic mappings for healthy patients.

Calibration curve of six chaotic mappings for PD patients.
The ROC curves for all six chaotic (CFA-KNB) models for PD and healthy patients shown in Figures 4 and 5 represent how well the models distinguish positive and negative samples of the skewed PD dataset. It is observed from all six ROC curves traced for all six models for healthy and PD patients that a smooth curve drawn for logistic (CFA-KNB) model goes smoothly through the upper left corner and the area bounded by the curve is 91% as reported in Table 4, which is a significant achievement with respect to other five models. The empirical results establish that the integration of chaotic sequences into the search model improves the chances of attaining global optima faster.

ROC curve of six chaotic mappings of healthy patients.
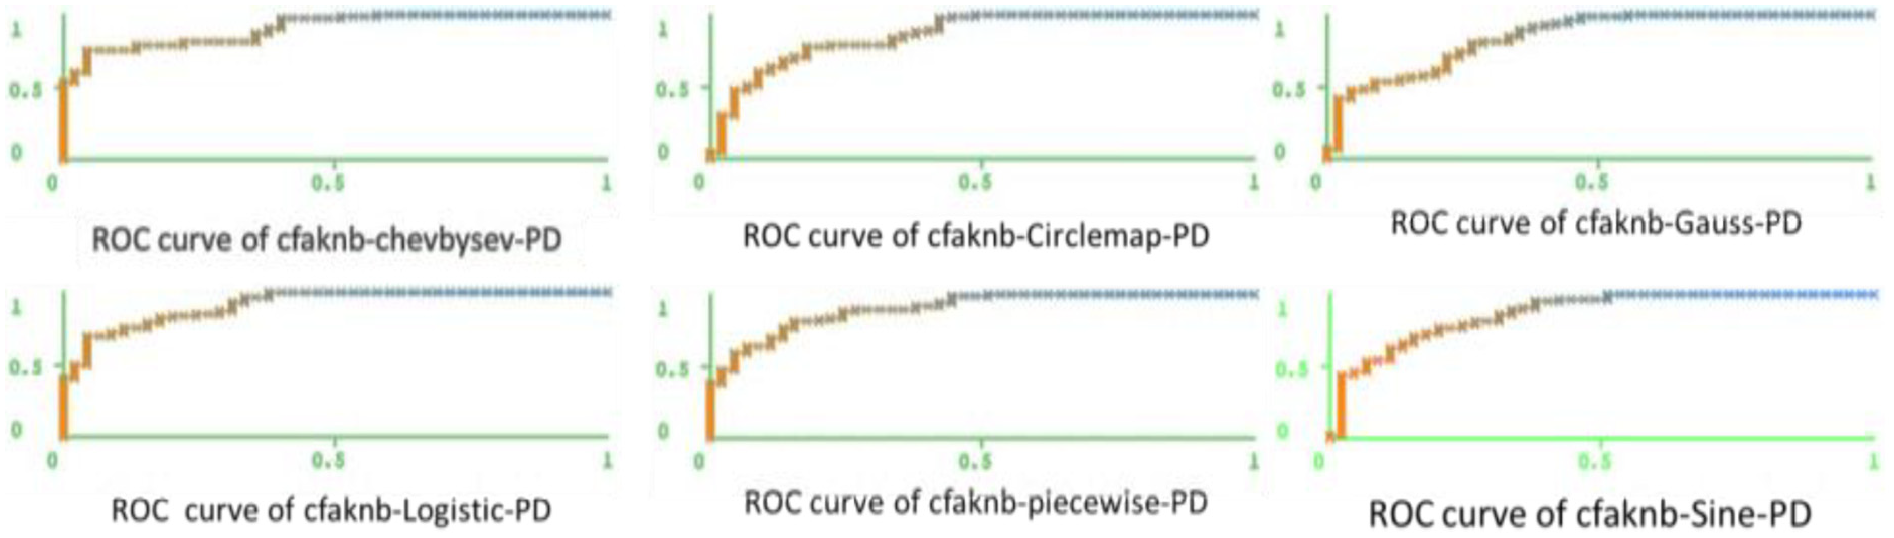
ROC curve of six chaotic mappings of PD patients.
Comparison of classification performance of (CFA-KNB) model with other models
Tables 6–10 summarize the classification accuracies obtained by the proposed chaos-based (CFA-KNB) search model with six different mappings for five well-known classifiers, namely, kernel-based Naïve Bayes (KNB), Naïve Bayes (NB), radial basis function classifier (RBFC), k-nearest neighbor (KNN), and decision tree (J48). The study has already proved that logistic-based (CFA-KNB) search model is one of the effective models for disease diagnosis when compared with other five models. The classification efficiency of logistic chaotic model for all classifiers shown in Tables 6–10 is far superior from other chaotic models except RBFC and J48. Chebyshev model is performing relatively better than logistic model for RBFC classifier in terms of ACC, sensitivity, and F-measure, and for remaining metrics, logistic model does better. For J48 classifier, piecewise performs better for all the metrics except model building time which is followed by sine, Chebyshev, gauss, and circle chaotic models. The logistic model achieves 90% accuracy for KNN, which is the highest, 89% for KNB, and 84% for NB classifiers. Therefore, the above arguments are sufficient enough to select logistic (CFA-KNB) as the best predictive model for all the classifiers as it achieves better generalization as compared to other combination of models.
Classification results of (CFA-KNB) model.

KNB: Kernel-based Naïve Bayes; ACC: accuracy; MCC: Mathew correlation coefficient; MSE: mean squared error; AUC: area under ROC curve.
Classification results of (CFA-NB) model.

CFA-NB: chaotic firefly algorithm-Naïve Bayes; ACC: accuracy; MCC: Mathew correlation coefficient; MSE: mean squared error; AUC: area under ROC curve.
Classification results of (CFA-RBFC) model.
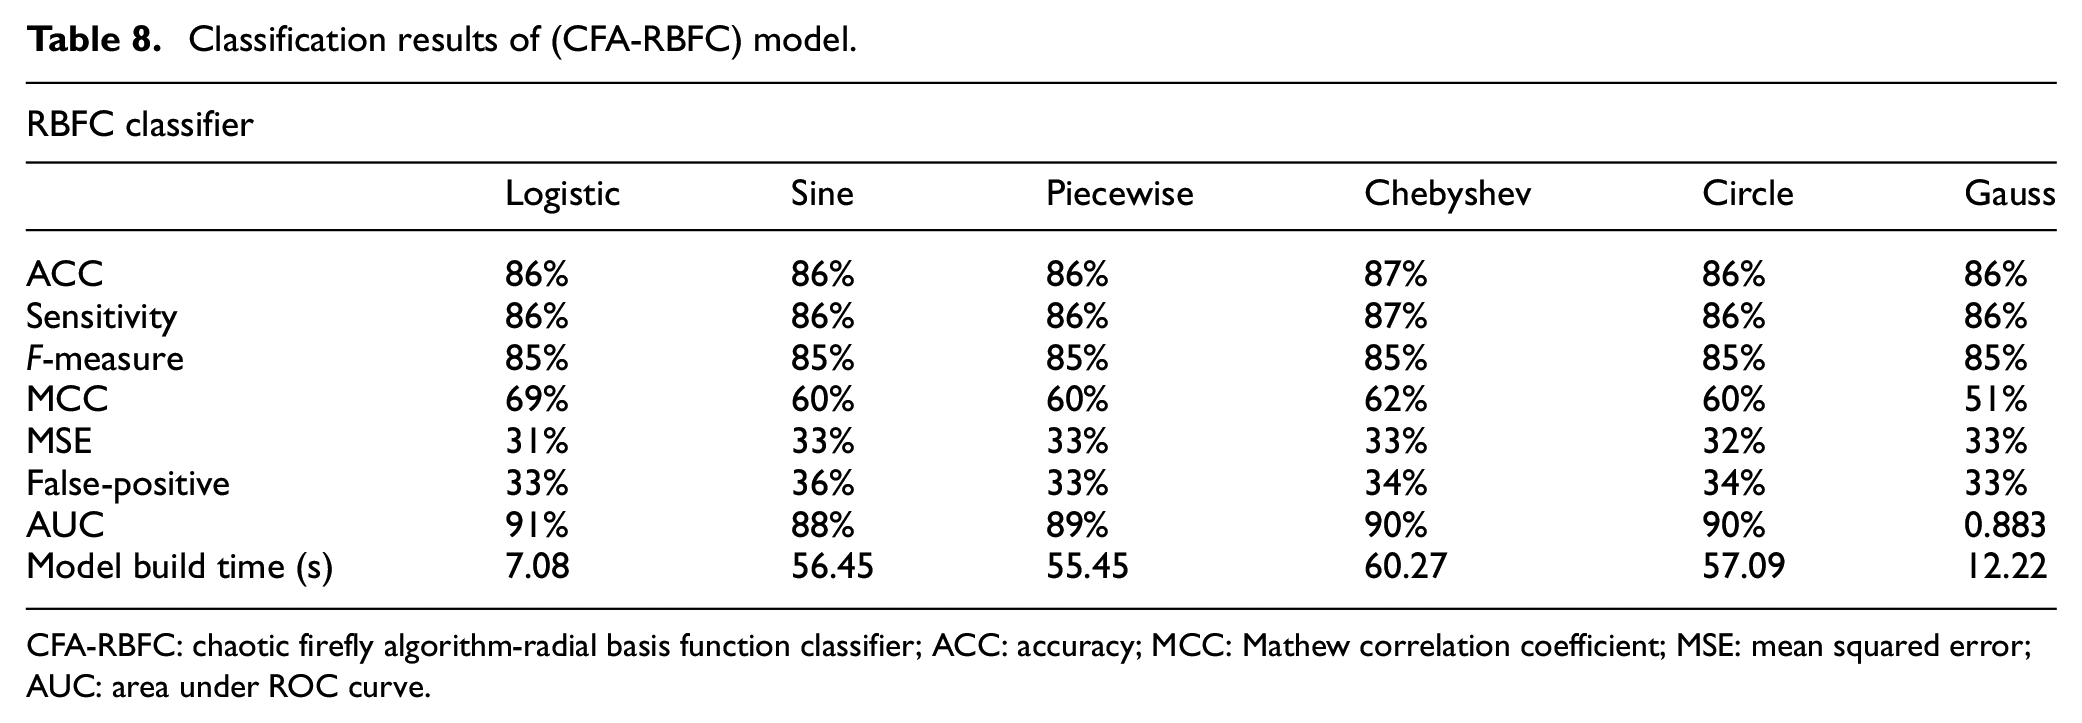
CFA-RBFC: chaotic firefly algorithm-radial basis function classifier; ACC: accuracy; MCC: Mathew correlation coefficient; MSE: mean squared error; AUC: area under ROC curve.
Classification results of CFA-KNN model.

CFA-KNN: chaotic firefly algorithm-k-nearest neighbor; ACC: accuracy; MCC: Mathew correlation coefficient; MSE: mean squared error; AUC: area under ROC curve.
Classification results of (CFA-J48) model.

CFA: chaotic firefly algorithm; ACC: accuracy; MCC: Mathew correlation coefficient; MSE: mean squared error; AUC: area under ROC curve.
Conclusion
In this proposed work, a new hybrid kernel-based probabilistic chaotic metaheuristic feature selection model is presented. Six different chaotic mappings have been employed to develop chaos-based firefly algorithms which in turn combined with a nonparametric kernel density estimated Naïve Bayes classifier for selecting most discriminative features that could develop a robust, reliable, and generalized diagnostic model for PD patients. The performance of six chaotic mappings was compared based on their best fitness values and p values to find the best chaotic combination with the CFA-KNB model which selects most reliable features from PD dataset. The performances of all the six chaotic CFA-KNB models with respect to four perspectives such as discriminative feature set, classification performance, robustness, and generalization were measured through five well-known classifiers. The experiment here proved that for very small clinical data set, a good set of discriminative features matter more than considering a small set of features which could not able to characterize the whole problem. Therefore, it can be concluded that kernel-based Naïve Bayes logistic firefly search model surpassed the remaining five chaotic models with respect to the selection of most significant features of PD set. In addition, the logistic-based (CFA-KNB) model has achieved best results for all the metrics for three listed classifiers: KNB, NB, and KNN and has not performed relatively well for RBFC and J48. On the contrary, the convergence of the algorithm is very fast comparing with other models. This proves the stability of the proposed model and hence can be used as a diagnostic tool for small clinical datasets. As a future research work, the same chaos-based algorithm can be compared with other metaheuristic algorithms for developing a more robust generalized optimal model for feature selection and classification for small clinical datasets.
Footnotes
Handling Editor: Shinsuke Hara
Declaration of conflicting interests
The author(s) declared no potential conflicts of interest with respect to the research, authorship, and/or publication of this article.
Funding
The author(s) disclosed receipt of the following financial support for the research, authorship, and/or publication of this article: This work is partially supported by Opole University, Poland through the funding received by Jolanta Mizera-Pietraszko. This work also has been partially supported by National Funding from the FCT—Fundação para a Ciência e a Tecnologia through the UID/EEA/50008/2019 Project; by RNP, with resources from MCTIC, Grant No. 01250.075413/2018-04, under the Centro de Referência em Radiocomunicações—CRR project of the Instituto Nacional de Telecomunicações (Inatel), Brazil; by Finatel through the Inatel Smart Campus project; and by Brazilian National Council for Research and Development (CNPq) via Grant No. 309335/2017-5 by Joel J.P.C. Rodrigues.