
Abstract
With the development of streaming data processing technology, real-time event monitoring and querying has become a hot issue in this field. In this article, an investigation based on coal mine disaster events is carried out, and a new anti-aliasing model for abnormal events is proposed, as well as a multistage identification method. Coal mine micro-seismic signal is of great importance in the investigation of vibration characteristic, attenuation law, and disaster assessment of coal mine disasters. However, as affected by factors like geological structure and energy losses, the micro-seismic signals of the same kind of disasters may produce data drift in the time domain transmission, such as weak or enhanced signals, which affects the accuracy of the identification of abnormal events (“the coal mine disaster events”). The current mine disaster event monitoring method is a lagged identification, which is based on monitoring a series of sensors with a 10-s-long data waveform as the monitoring unit. The identification method proposed in this article first takes advantages of the dynamic time warping algorithm, which is widely applied in the field of audio recognition, to build an anti-aliasing model and identifies whether the perceived data are disaster signal based on the similarity fitting between them and the template waveform of historical disaster data, and second, since the real-time monitoring data are continuous streaming data, it is necessary to identify the start point of the disaster waveform before the identification of the disaster signal. Therefore, this article proposes a strategy based on a variable sliding window to align two waveforms, locating the start point of perceptual disaster wave and template wave by gradually sliding the perceptual window, which can guarantee the accuracy of the matching. Finally, this article proposes a multistage identification mechanism based on the sliding window matching strategy and the characteristics of the waveforms of coal mine disasters, adjusting the early warning level according to the identification extent of the disaster signal, which increases the early warning level gradually with the successful result of the matching of 1/N size of the template, and the piecewise aggregate approximation method is used to optimize the calculation process. Experimental results show that the method proposed in this article is more accurate and be used in real time.
Keywords
Introduction
With the development of streaming data processing technology, real-time event monitoring and querying has become a hot issue in this field. The monitoring and identification of mine disaster events is a real-time event monitoring and query problem based on data stream. In this article, the authors carried out the research with coal mine disaster events as the background, and a new anti-aliasing model and a multistage identification method for abnormal events are proposed.
With the increasing depth and intensity of excavation, problems of coal mine dynamic disasters 1 are becoming more and more serious. Also, the current collection and storage works of coal mine disaster data mainly make use of the sensor base stations around mines. The perceived data can be decomposed into three components of different directions: east-west, north-south, and vertical. A conclusion can be drawn from the analysis of the micro-seismic data of historical coal mine disasters that for every kind of coal mine disaster, there is a unary N sublinear relationship 2 in each of the three components in different directions. Thus, we can transform it into continuous-waveform signal by mathematical model, and then the typical template waveforms 3 of classified disasters can be obtained. Therefore, it is a hot issue to take advantage of micro-seismic signals to monitor, identify, and provide early warning about coal mine disasters in the field. Putting forward an effective method for identifying disaster events is of great significance in reducing casualties and property losses caused by coal mine rock-burst power disaster accidents. With the influence of the nature and the structure of rock mass, micro-seismic signals usually carry the information of both the signal source and the rock masses4,5 that appear in the route of transmission; the micro-seismic signals of the same kind of disasters may produce data drift6,7 to a certain extent like weak or enhanced signals, causing a stretch or compression of the waveforms, which affects the accuracy of the identification and early warning of coal mine. The anti-aliasing model and multistage identification method of the data drift in coal mine disasters proposed in this article are aimed at solving this problem. First, we need to seek an access to identify whether the perceived waveforms are similar to disaster waveforms. However, we cannot make the real-time signal match the template through traditional method based on data flow because of the data drift, for which an anti-aliasing model has to be constructed to normalize the drifted data. Therefore, first, this article takes advantages of dynamic time warping (DTW),8–10 which is widely applied in the field of audio recognition, to build an anti-aliasing model, warp the three components of the real-time signal at the same time, and make the similarity fitting results coincide with the template waveform. Second, in the fitting process, when the similarity fitting is successful to some extent, which means the perceived data waveform is likely to be a disaster waveform, the process enters the early warning stage. In order to realize the similarity fitting, the start point of the matching between perceived data and the template waveform needs to be located to achieve real-time matching, or when the two waveforms could not be aligned, it may influence the accuracy of matching. Therefore, this article proposes a strategy based on a variable sliding window11–13 for aligning the two waveforms, with the perceptual window sliding forward gradually indicating the start point to guarantee the accuracy of the matching. Finally, this article proposes a multistage identification and early warning mechanism based on the sliding window matching strategy and the characteristics of the waveforms of coal mine disasters, improving early warning level gradually with the result of the matching of 1/N size of the template as the warning threshold. And it introduces piecewise aggregate approximation (PAA) 14 to optimize the calculation process, improving its efficiency. The main contributions of this article are as follows:
It proposes the anti-aliasing model based on the DTW and identifies whether the perceived data are disaster signal based on the similarity fitting between them and the template waveform.
It proposes the sliding window strategy (SWS) to align two waveforms, locating the start point of the matching between perceived data and the template waveform, which guarantees the accuracy of the matching.
It proposes a multistage identification and early warning mechanism based on the sliding window matching strategy, increasing the early warning level gradually according to the extent of the similarity fitting, in order to guarantee its real-time characteristic.
Related work
At present, research works about monitoring, identification, and warning of data-drifted micro-seismic signals at home and abroad mainly focus on the following aspects:
C Guo and Y Chen 15 presented a mine filter which can change parameters adaptively according to the signal. In the actual measurement of vibration signal, power-line interference 16 and baseline drift17,18 often lead to the addition of some extra frequency components and influence the quality of signal, whereas this method can filter the signal and eliminate the influence. However, the signals with obvious power-line interference attenuate to some extent near 50 Hz.
J Fan 19 put forward a concept to monitoring the change of blowing rate, which can be transformed to monitoring the fluctuation of air volume and the drift of windage; thus, we can change the nonlinear function of blowing rate change into a linear one through Taylor sequence expansion, building a mathematical model to analyze the fluctuation and drift. The sensitivity matrix of ventilation network serves as the guide to identify the causation branch and the windage variation and to obtain the statistical characteristics of the fluctuation and drift data of the windage of mine, which can effectively guide the identification of hidden dangers and the maintenance of the windage data of mine ventilation. However, the accuracy of identification of windage drift under complex conditions remains to be improved.
A speech keyword detection method based on DTW is proposed by Hou et al. 20 According to the framework of keyword detection and DTW, this article proposes a partial matching strategy based on phoneme boundaries to solve the problems of the approximate query. This strategy can enhance the performance of the system to a large extent.
A line anti-aliasing algorithm based on field-programmable gate array (FPGA) is proposed by Jia et al. 21 The algorithm combines the classic Wu anti-aliasing algorithm, calculating gray values according to the distances from the center of pixels to the ideal line and establishing the recursive formula, using integer shift, addition, and comparison to complete it. The calculation of the line anti-aliasing algorithm is simple, which is easy for hardware implementation and high-speed operation. However, this algorithm is more suitable for the feature of pixel construction in computer graphics, and it is not universally applied.
Fahy et al. 22 proposed the Fast-Match (FMA), a fast algorithm for approximate template matching under two-dimensional (2D) affine transformations, which can be used to sample using a density that depends on the smoothness of the image and capture the similarity between target image and template with only a small number of pixels being examined randomly. The algorithm is mainly used in the field of image recognition, migrating it to data stream processing; the fast matching of disaster events can also be realized, but the accurate location of disaster events cannot be determined. Random inspection also reduces the accuracy of recognition and makes the matching greatly affected by noise. Also, this algorithm only matches the real-time data within the window with the template sequence by a simple way, so it can only identify specific events with specific length, but it is impossible to identify disaster events with drift feature.
Li et al. 23 proposed a method for edge extraction of high-resolution images (disaster management exchange (DME)) based on directionlet transformation theory, combined with modulus maximum method. First, the original image is decomposed based on lattice to obtain a set of one-dimensional lines in any direction, and then wavelet transform is carried out to restore the image format to obtain a sub-band in the direction of high frequency. Then, the edge results are obtained using the improved modulus maximum method and the double threshold method. Finally, the mathematical morphology method is used to refine and join the edge extraction results so as to achieve the edge extraction of high score image. The recognition of disaster events can be realized in streaming data processing, but this method cannot realize real-time recognition of disaster events.
Qian and Hu 24 proposed a fast wavelet algorithm that pays out a few storage spaces by putting partial wavelet coefficient in memory beforehand based on sliding time window technology. Sliding time window technology refers to the use of a fixed time window in real-time detection to intercept an infinite signal sequence with a fixed time interval to obtain a fixed length signal sequence to be detected. Sliding time window technology has been widely used in computer communication network anomaly detection, power grid AC current anomaly detection, and image edge detection, which has become an important technology in real-time detection.
Aiming at the shortcomings of current real-time identification methods for streaming data events, this article proposes a hierarchical identification method for real-time abnormal events based on streaming data by considering the accuracy and efficiency of the identification of drift characteristics of events.
The anti-aliasing model for data drift abnormal events
The coal mine dynamic disasters mainly occur in the mining area with complex geological structure and stronger crustal stress, where the fracture activity is more significant, the mechanism of which can be summarized as the stored elastic energy of rock mass being greater than its maximum plastic energy dissipation, which is the critical value of the damage of rock mass. Therefore, residual energy releases in the form of kinetic energy, generates impulse wave and vibration signals, and spreads them around. Therefore, the recognition of disaster events can be divided into two steps: (1) obtaining the feature waveforms of disaster events, and (2) matching the real-time data with the feature waveforms to monitoring.
Extract feature waveforms of disaster events
Coal mine disasters can be divided into three major categories at present, each of which has a similar feature and regular pattern. Based on the mechanism of coal mine disasters, micro-seismic data are usually used for monitoring. Micro-seismic data are vector signals, which can be decomposed into three data components in horizontal and vertical directions: east-west, north-south, and vertical. When a coal mine disaster occurs, a unary N sublinear relationship exists in each of the three components, which can be transformed into continuous-waveform signal by mathematical model based on curve fitting, 25 after which template waveforms of classified disasters can be obtained. At present, there are several seismic data monitoring stations in each mining area, and the disaster event data monitored will be classified and preserved. Therefore, we can extract the characteristic waveform of the disaster event from the existing historical disaster events. When the historical disaster data size is massive enough, the excavated template waveform is able to reflect the regularity of micro-seismic signal of such kind of coal mine disasters for a period.
Data drift characteristics of real-time data
The template waveform can be seen as the norm to identify the occurrence of disasters to some extent. But as affected by the geological structure and energy losses, the micro-seismic signals of the same kind of disasters usually produce data drift, causing the signals to weaken or enhance in the time domain. Figure 1 is the schematic diagram of the drifted data waveform.

Schematic diagram of the drifted data waveform.
The perceived information of deformation, crustal stress, electricity, magnetism, and sound forms in the generation of dynamic disasters are the time sequence data. The Euclidean distance is often used to describe the disaster signals when we are comparing the similarity of the two segments of time sequence. But the waveforms of disaster signals may be generated in different time domains because of the varying energy and geological structure, which means the two sequences compared may not be of equal length. At this point, the traditional method based on Euclidean distance shows its limitations in the calculation of similarity; when two sequences with very similar shapes on the whole are not aligned on the time axis, we cannot calculate the distance (or similarity) between them effectively through the traditional method. Therefore, before comparing the waveform similarity of such coal mine disasters, it is necessary to warp one (or both) of them in the time axis to achieve better alignment.
Structure of anti-aliasing model for identification of disaster events based on DTW
As described above, the perceived micro-seismic data of the coal mine usually produce data drift in time domain, which may lead to the situation that it cannot match with the template waveform directly. Therefore, this article takes advantages of the DTW algorithm to construct anti-aliasing model to warp the perceived waveforms and carries out the similarity fitting 26 between them.
DTW sequences
The DTW is mainly applied in the field of sound recognition, which is a method to measure the similarity of two time sequences with different lengths, high efficiency and better warping effect, and other advantages, and it meets the requirements of real time and accuracy of monitoring, identification, and early warning of coal mine disaster. The algorithm measures the similarity
27
of two time sequences by seeking out the warping function,
28
corresponding to the minimum cumulative distance of the matching between them. According to continuity and monotonicity, there are only three directions: (i + 1, j), (i, j + 1), or (i + 1, j + 1). Our purpose is to find the path with the least structured cost:

where g(i, j) means that the two templates match successively from the initial component, and the i component in M and the j component in T have been reached; the matching to this step is the distance between the two templates. And it is adding d(i, j) or 2d(i, j) to the previous match and then taking the minimum. Figure 2 is a schematic diagram of the principle of the DTW algorithm.

Schematic diagram of the principle of the DTW algorithm.
As shown in Figure 2, the two solid lines above and below represent two time sequences, while the two end points of each dotted line represent a pair of similar points of the sequences. The algorithm, in other words, is to find a way to ensure that the cumulative distance of all of the pairs of similar points is the minimum in the whole proceeding of the matching. Cumulative distance can be used to measure the similarity of the two sequences, and the shorter the distance the higher the similarity of the sequence.
Structure of anti-aliasing model
Assume that the sequence γ(γ1, γ2, …, γn) is a typical coal mine dynamic disaster data sequence, while the sequence β(β1, β2, …, βm) is a data sequence that remains to be compared, and their lengths are n and m, respectively, for the equality m = n may not be contented, so it is necessary to structure the anti-aliasing model based on the DTW to compare the similarity of γ and β.
First, create a matrix grid with the size n × m to align the two sequences, each element (i, j) of which represents the alignment of the two points γi and βj, and the value of each element (i, j) is the Euclidean distance between γi and βj (written d(γi, βj)), which can be used to measure the similarity between the two points chosen from the two sequences, respectively, and the smaller the value, the higher the similarity. As shown in Figure 3, making the two sequences match with each other, in other words, is to make the similar points of the sequences align according to their order, after which a regular path passing through several lattice points is bound to be obtained in the matrix grid. The coordinates of each lattice point passing through the regular path indicate the order number of the pair of the aligned points located in the two sequences, respectively (such as if a path passes through the lattice point (i, j), it illustrates that the two points γi and βj are aligned in this run of matching), while the cumulative sum of the values (the Euclidean distance) of all the lattice point in the regular path is the price of the regular path, called the regular price (the price is not marked in Figure 3). The matching must be started from the respective first point of the sequence and stopped when all points have completed their matching, based on that the regular path is certain to start from the first lattice point (1, 1) and end up with the last lattice point (m, n), while the DTW algorithm is to find a regular path of two sequences with the minimum regular price and then use the value of the regular price to measure the similarity of the two sequences.

Schematic diagram of regular path.
The perceived data can be decomposed into three components of different directions: east-west, north-south, and vertical, so we can carry out the DTW to make all the three components match with the template waveform and get their regular price, respectively, and if two or more of the regular prices meet the requirements (i.e. its whole generation value is less than the threshold value), we can judge that it is probably a disaster signal. The setting of threshold value varies in different application scenarios and is usually set to 35 when applied for the identification of coal mine disaster events.
Multistage identification method for abnormal events
In the previous section, we introduced the DTW, which is widely applied in the field of audio recognition to build an anti-aliasing model. Identify whether a given waveform data are a disaster signal based on the similarity fitting between them and the template waveform of historical disaster data. In this section, the realization process of anti-aliasing model in real-time data monitoring identification and the realization process of multistage recognition are exactly elaborated.
The real-time anti-aliasing matching and identification of disaster events
Aligning the waveforms is the precondition to judge whether the coal mine power disaster occurs, which may result in an error in matching and in turn affect the accuracy of the identification.
Real-time waveform alignment strategy based on sliding window
As mentioned above, real-time monitoring data are the continuous streaming data, so even if the real-time data stream contains disaster event signals, we do not know the location of these signals (i.e. the time when the disaster occurred) and their length (duration of the disaster events). Therefore, a dynamic sliding window is introduced to align the real-time waveform with the template waveform, which moves gradually along the data stream, and its size changes regularly; then make the real-time data in the window match in similarity with template waveforms to achieve the purpose of disaster event identification.
Considering the drift characteristics of events, the window size should be set to an appropriate range, which should be able to cover the duration of various types of events. For example, if the duration range of typical mining dynamic disaster events is known as

Status of the sliding window when the waveform alignment strategy is carried out.
Algorithm description: As shown in Figure 4, the first initialization data window size is t0, and the window contains the real-time data and the template waveform similarity matching; if the match is successful (similarity meets the threshold requirement), it means that the window contains data as a disaster event, so immediately release them or, as a result, make a slip in the current position of the window (slide in the direction of time at a distance of the same length as the current size of the window) and continue to monitor the next event. If the match fails, the window increases linearly gradually,
Example
Assuming that the sequence γ(a, b, c, d, e, f) is the template waveform and the real-time data are β(x1, x2, x3, …, xn), the threshold of their similarity is

The assumed Euclidean distance of every pair of points in two different sequences.
Make the two sequences match in similarity with each other according to the DTW algorithm, and the minimum cumulative price of the matching, accumulated from the start points to any one pair of the aligned points of the two sequences, is shown in Figure 6. That all the points have matched, in other words, means that the respective last point of the two sequences is aligned with each other, the minimum regular price is 27 (the regular path denoted by an arrow in Figure 6), and there are seven nodes in the regular path, that is, DTW (γ, βwindow) = 27/7 = 3.86, which is bigger than the assumed similarity threshold of

The regular path and regular price of two sequences.
Optimization suggestion for the alignment strategy
In the process of matching and analyzing the principle of the DTW algorithm, we can find that if the real-time data window only increases its size and does not slide its position in a certain status change, making the real-time waveform in the enlarged window continue to match the template waveform, then the part of the last regular path before the window size’s enlargement, between its first lattice point and a particular lattice point P, will overlap entirely with the new path’s corresponding part. And the lattice point P is the lattice point at which it matches with the last real-time data point within the sliding window for the first time during the last time of matching, which is the first point on the far right of the distance matrix in which the regular path extends to from the starting point. As per the example in the previous section, the window size increases to Δt after the matching fails, as is shown in Figure 6. And if Δt corresponds to only one data point, the new regular path will be similar to that shown in Figure 7 (the new column in the distance matrix is the assumed Euclidean distances between the newly added data point in the sliding window and each of the data points in the template), and the lattice point P is marked in it. Observing the two regular paths in Figures 6 and 7, it is easy to find that the part from the first lattice point O to point P of the path in Figure 7 coincides exactly with the corresponding parts in Figure 6. According to the DTW algorithm, from the lattice point P to the next lattice point, the new regular path has only three possible extension directions as is marked in Figure 7. And according to the matching principle of the DTW algorithm, the new regular path from P to the next lattice point has only three paths, as shown in Figure 7.

The new regular path of two sequences when the sliding window enlarges its size.
Therefore, we can optimize the algorithm as follows: in each matching process, we set up a three-tuples F(t-index, r-index, p) to track and record the information of the lattice point P in the regular path, where t-index is the ordinal index of the data points of the template waveform and r-index is the index of the data points of the real-time waveforms in the window. The two-tuples F(t-index, r-index) actually represents the position in the matching matrix of the lattice point P, and p is the minimum regular price of the matching, accumulated from the start point O to point P. Then, before the next matching, if the window, compared to the previous one, has only increased its size (the position has not slipped), the matching continues from the point P(t-index, r-index), and set up the initial value of the regular price to be p; otherwise the matching still starts from point O. Update the three-tuples F in the matching process. If the price (p) of the lattice point P has already exceeded the default matching threshold, the price of continuing matching after window enlargement will continue to increase on the basis of p, and then the threshold value will also be exceeded. Therefore, we should stop the window from increasing in size ahead of time (assuming that the window has not yet grown to its maximum size in this time). In this way, we can greatly reduce repetitious work and improve the efficiency of the matching process.
Multistage identification method for disaster events
The coal mine dynamic disasters have the characteristics of sudden and instantaneous effect, whereas there is a lag in the warning given by the current identification warning strategies, and the warning information will be sent out only after the results from the disasters are recorded, which account for the less real-time use of these strategies. To solve this problem, this article proposes a multistage identification and warning method based on the SWS presented in section “The real-time anti-aliasing matching and identification of disaster events,” increasing the early warning level gradually according to the extent of similarity fitting, guaranteeing the accuracy of the identification, and providing real-time warning.
Optimization strategy of data reduction based on the PAA
The varied perceptual information produced during the dynamic disaster event generation is obtained by ultra-high-frequency structure activity monitor, and there are tens of thousands of data records produced per second; therefore, this article introduces the PAA to sample the original data to optimize the calculation process. The PAA is suitable for similarity query about time sequence; it can reduce the original time sequence from a high-dimensional (n dimensions) space to a low-dimensional (m dimensions, and m < n) space and filter the high-dimensional spatial data by computing the distance in the low-dimensional space, which can improve the efficiency of calculation. Figure 8 is the schematic diagram of the optimization effect of the PAA.

(a) The original time sequence and (b) time sequence processed by the PAA.
As shown in Figure 8(a), a time sequence with a length of 20 is given by
Multistage identification method based on the SWS
Algorithm description: The SWS needs to be changed a little to realize multistage identification. First, initialize the warning level to zero and divide the template waveform into N equal-length segments at the same time. Then carry out the SWS and divide the matching into N stage every time: divide the real-time waveform within the sliding window into N equal-length segments, too, as shown in Figure 9, and make each of the segments match similarity with the corresponding segment of the template. At the same time, increase the warning level gradually according to the amount of pairs of the segments matched successfully to one another, that is to say, add one level to the warning level every time when a segment within the sliding window matches successfully with the other one of the template it corresponds to and make the system issue the warning immediately when the warning level meets the assumed condition. Finally, after all the segments within the window have matched with the template, if the warning level meets the assumed condition (that means a warning has already been issued), the window status changes in the same way as it in the SWS, that is, the sliding window skims over the current window size and its size recovers to the original size t0; cancel the warning (reset warning level to zero) at the same time to continue the next matching and prepare for the next warning. On the contrary, if the early warning level does not meet the condition, cancel the warning first, and then the window status also changes as it is in the SWS, that is, to check whether the window size has reached its maximum size T, if true, make the window slide a fixed size
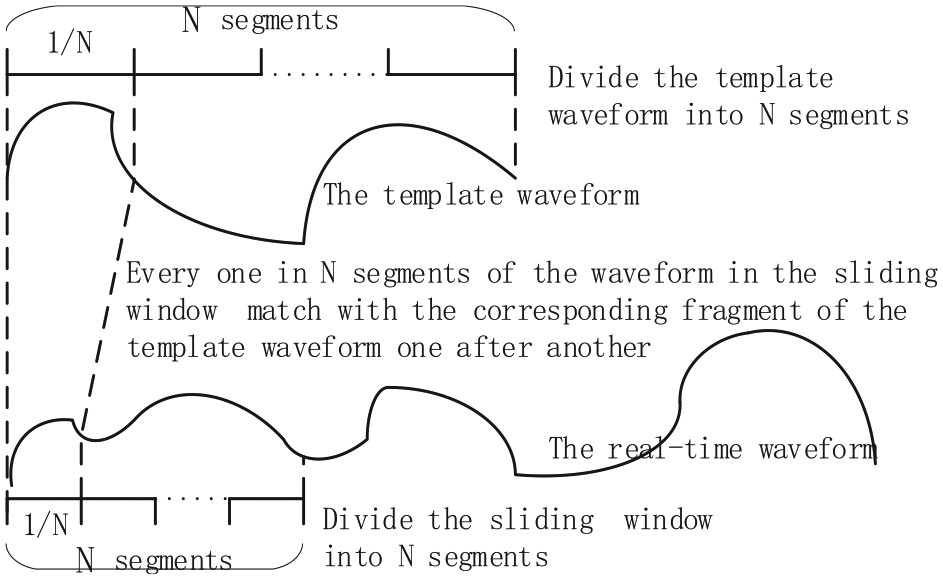
Divide the template and the window waveform into four equal-length segments in the matching.
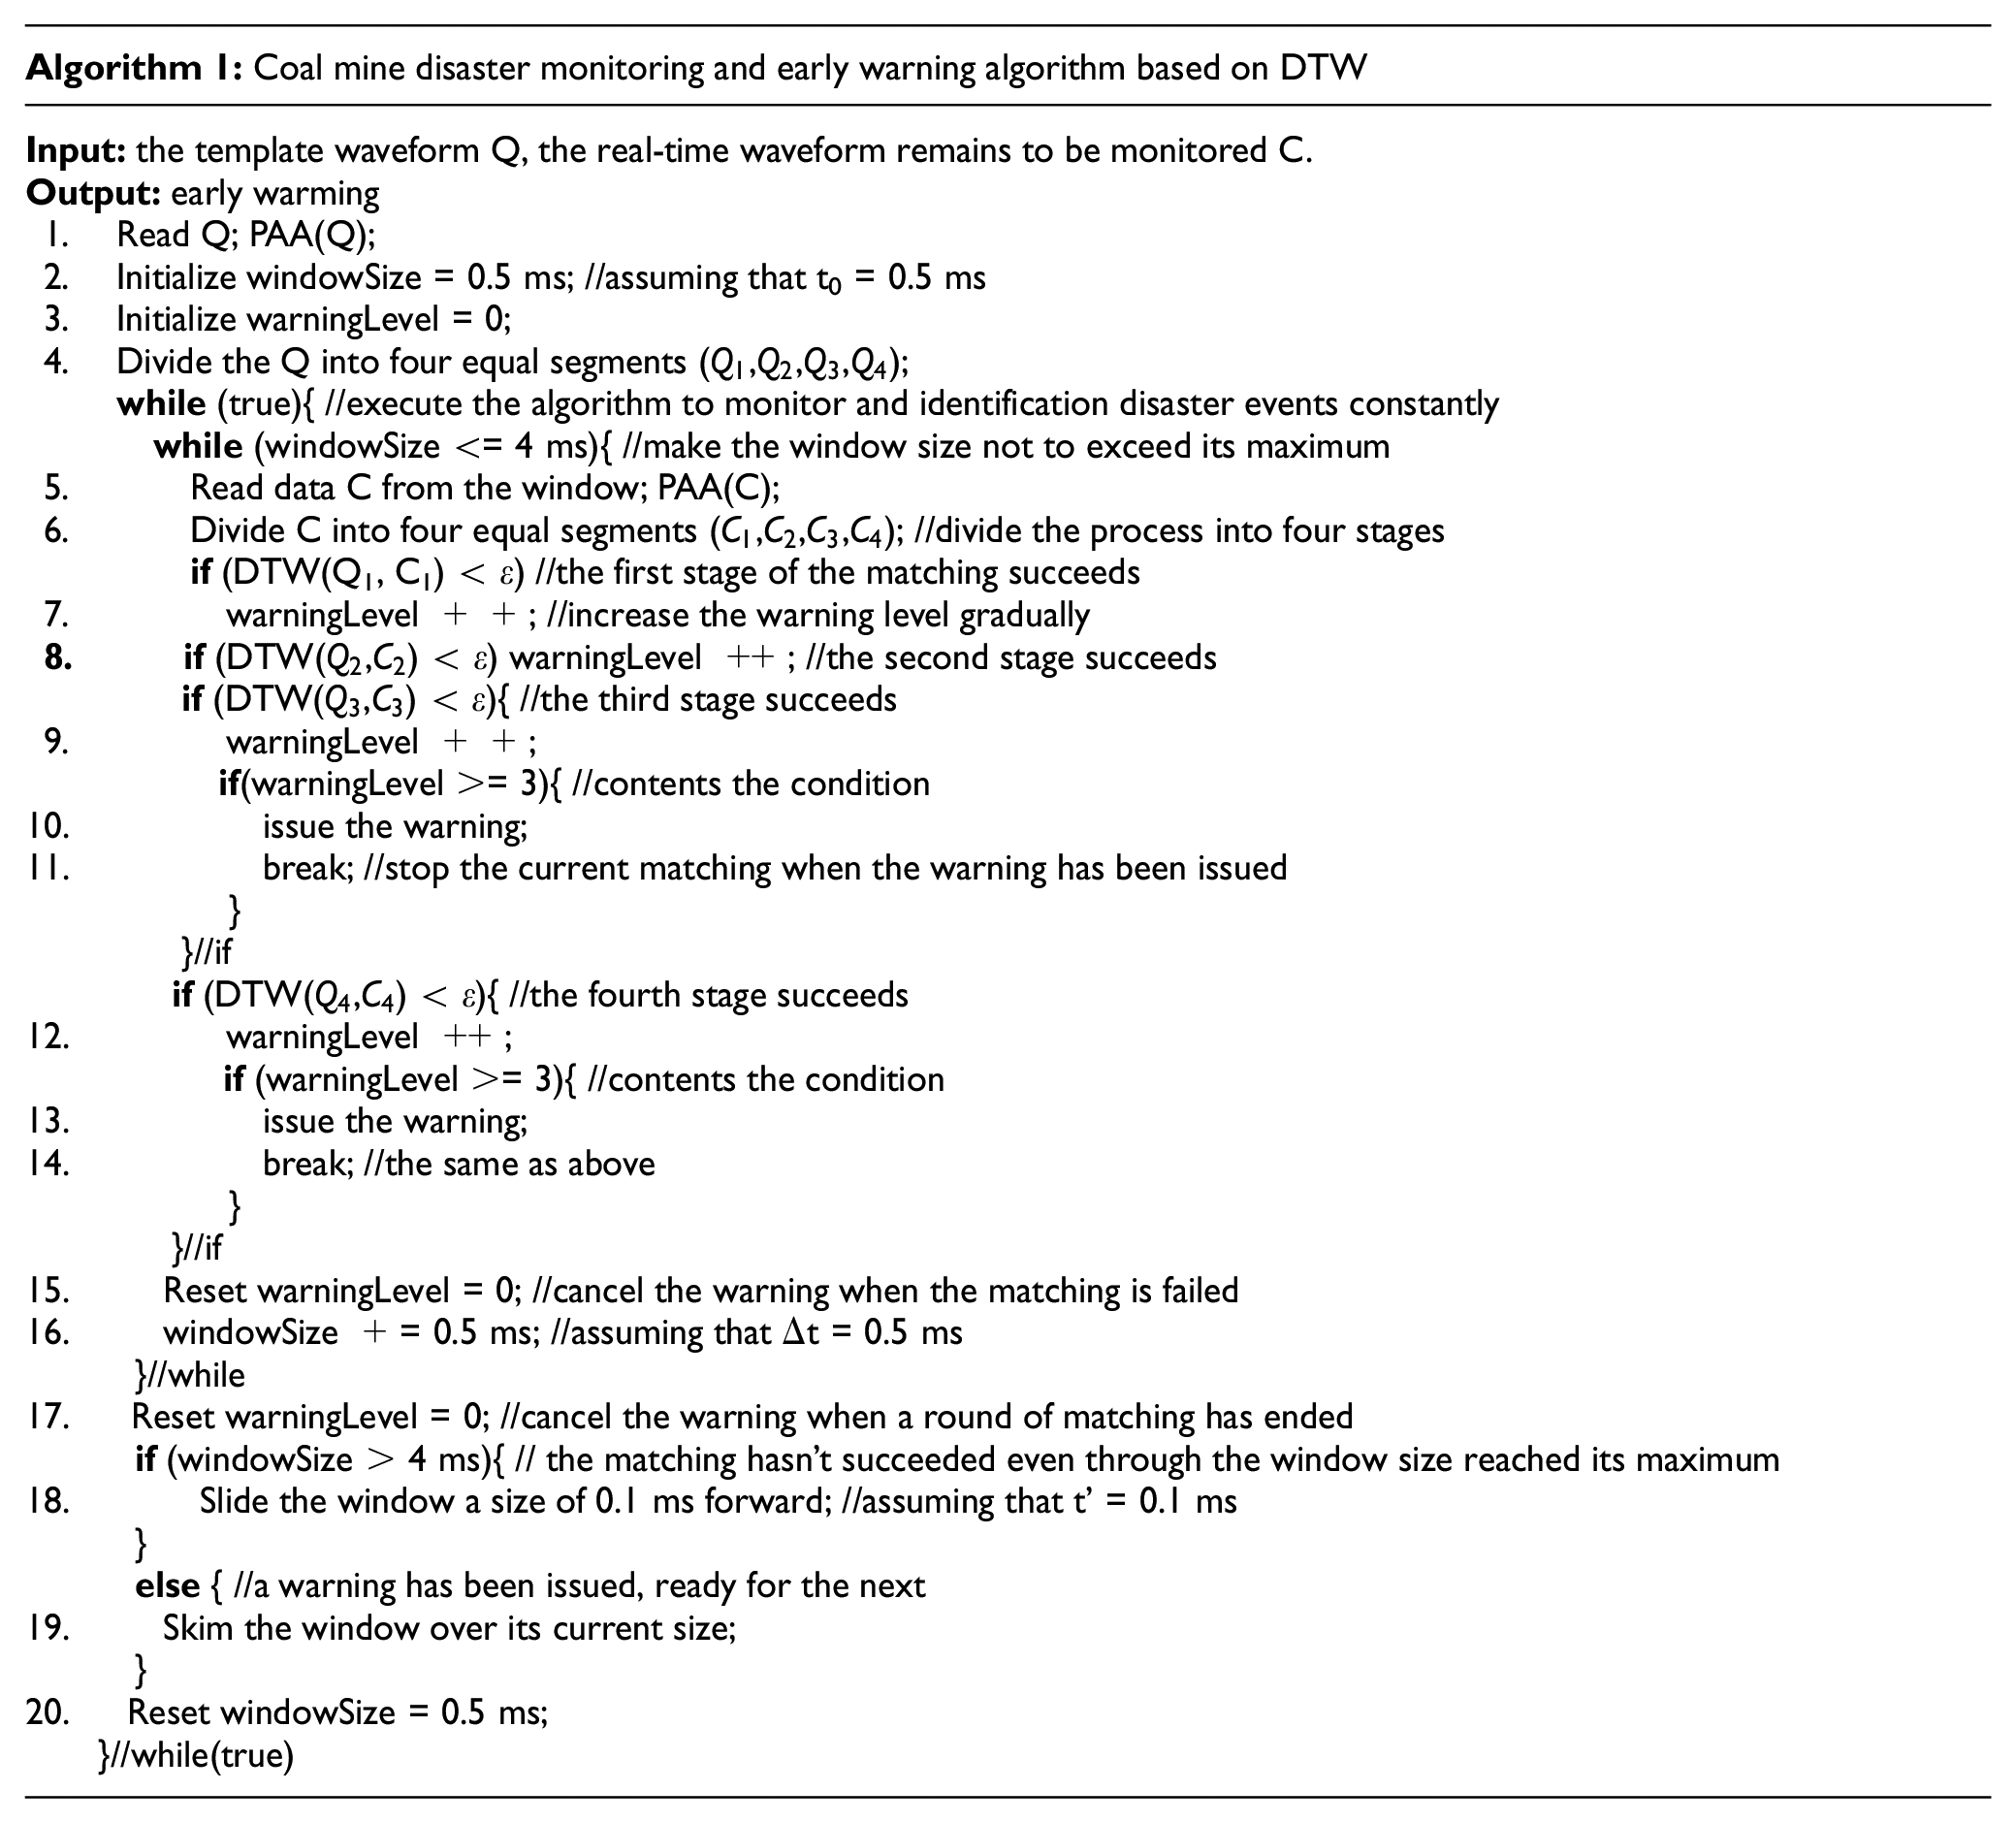
The engineering practice shows that the coal mine dynamic disaster duration is generally 0.5–20 s; therefore, the initial sliding window size should be set to t0 = 0.5 s, while the maximum can be increased to T = 20 ms. And in actual project, four warning levels are usually set up (namely, the template waveform needs to be divided into four equal segments in the matching). At the same time, in order to improve the real-time performance of early warning, we set up the system such that the warning will be sent out immediately when the warning level reaches 2. At this point, we can think that “there is a 50% (2/4) probability that a mine earthquake will occur,” so if a mine quake does occur (i.e. we identify a disaster signal successfully), we can issue a warning in the initial stage of the disaster, giving the underground workers time to evacuate to safety immediately. Combined with the previous algorithm description, the pseudocode of the whole algorithm is made up as Algorithm 1.
Experiment and analysis
Experimental environment and data
The experimental dataset is derived from the real micro-seismic sensing data of Jixian Coal Mining Group (the data are collected and stored by a high-frequency micro-seismic sensor with three data channels, which share the same timestamp and collect the different components of vibration signal in three different directions, respectively: east-west, north-south, and vertical). In the experiment, we take the data of one of the channels to calculate, and the sampling density of each channel is 5000 data points/s. The size of the dataset we used is about 500,000 data points (which correspond to a time span of 100 s; the original dataset does not contain disaster event signals). Four 5 s events are randomly inserted into the dataset as our experimental dataset. And the experimental environment is shown in Table 1. The data structure of the dataset is shown in Table 2.
Experimental environmental parameters.

Data structure.

As is shown in Table 2, ID represents the data number; X, Y, and Z represent the components in three different directions: east-west, north-south, and vertical; and TIME represents the data acquisition time.
Experimental results
Effects of the sliding distance of sliding window position t′ and the increment of sliding window size Δt on algorithm performance
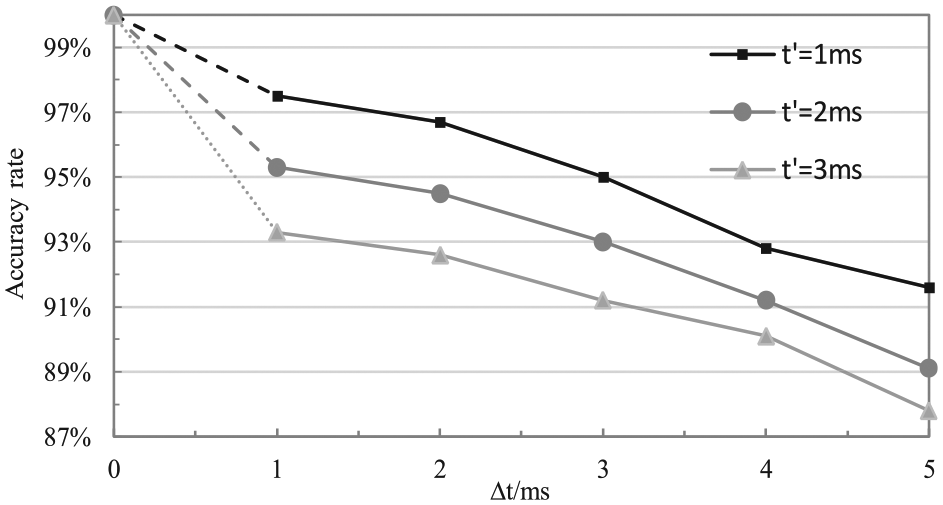
This experiment has compared the accuracy rate of different conditions under different Δt (Δt = 1 ms, Δt = 2 ms, Δt = 3 ms, Δt = 4 ms, Δt = 5 ms), at the same time making the sliding window mechanism realize the alignment with different sliding distance
The accuracy rate analysis of different conditions.
It can be seen from Figure 10 that when the sliding window slides to align the waveforms, the smaller the sliding distance t’, the smaller the error rate, and the higher the incremental value of Δt, the lower the accuracy.
As can be seen from Figure 11, the smaller the window sliding value t, the higher the algorithm efficiency. The larger the window increment t, the higher the algorithm efficiency, and the algorithm efficiency gradually tends to be flat.

The efficiency analysis of different conditions.
It can be concluded from the analysis that when
Comparison and analysis of identification performance of different algorithms
The current source location and magnitude calculation algorithm of mine earthquake monitoring is based on monitoring a series of sensors with a 10-s-long data waveform as the monitoring unit; if there are more than five sensors meeting the preset conditions (rock-burst identification norm) within the 10 s, it will judge whether there is a disaster waveform present in the current 10 s data, trigger the source location and magnitude calculation program to obtain the source and magnitude, and save the information at the same time; otherwise it will discard the current 10 s data and go on to monitor the next 10 s data. Its core algorithm is the long and short time average (STA/LTA) energy ratio method, in which STA is the change trend of micro-seismic events’ signal amplitude or energy, and LTA is the change trend of background noise signal amplitude or energy, required to define the characteristic function and then based on the characteristic function of moving window calculate the value of STA and LTA, respectively. According to the characteristics of signal itself, when it arrives, STA value changes faster than LTA value, and further the LTA value is relatively stable. The corresponding STA/LTA value increases suddenly when the signal arrives. Under the condition of artificially set threshold (THr), when the ratio is greater than THr, this point is considered as the first arrival moment of micro-seismic wave, so as to judge. The formula can be written as follows
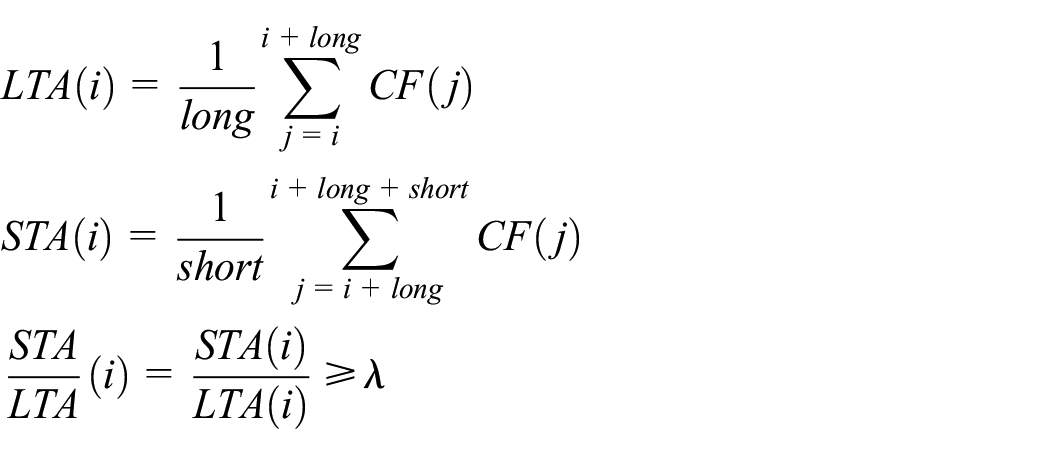
where i is the sampling time, long is long window length, short is short window length, λ is the set trigger threshold,; and CF(i) is the characteristic function value corresponding to micro-seismic signal at time i, representing the change of amplitude energy of micro-seismic data.
Analyzing this algorithm, it is not difficult for us to draw the conclusion that this method leads to a lagged identification of disaster, and the algorithm monitors 10 s data per time, so only after 10 s of the occurrence of disaster can the system recognize the mine earthquake, resulting in that it is impossible to give early warning. In addition, the identification accuracy of this algorithm is a little low; considering the situation that there is only a part of disaster waveform that appears at the end of the current 10 s data (its another part is at the beginning of the next 10 s data), it is likely that the disaster waveform will be missed. While the mine earthquake disaster identification method proposed in this article identifies the disaster waveform by making the sliding window slide forward gradually, what’s more, it adopts the multistage identification and early warning mechanism so that it is not necessary for the system to recognize the disaster waveform completely; as soon as the identification degree meets the condition (the warning level reaches the preset warning threshold), the monitored data will be judged as a disaster waveform, and an early warning will be issued immediately. This method greatly improves the accuracy and real-time monitoring of mine earthquake disaster and also realizes the early warning for it. To sum up, the monitoring efficiency of the method proposed in this article is obviously better than that of the current algorithm.
When
Figure 12 is the schematic diagram of accuracy of each algorithm. The horizontal coordinate represents data volume and the vertical coordinate represents accuracy, and it can be seen from the figure that the accuracy of the algorithm in this article is not much different in the whole-window matching strategy and four-segment matching strategy, and the accuracy of other algorithms is obviously lower than that of the algorithm in this article.

The accuracy rate analysis of different algorithms.
It can be seen from Figure 13 that with the increasing amount of the data points to be measured, the triggering time of the early warning in both the strategies shows a gradually decreasing trend on the whole, while the growth rate in the four-segment strategy is slower than that in the whole-window strategy, and the triggering time in the four-segment strategy is always shorter than it in the whole-window strategy whatever the data size, proving that the four-segment strategy is better than the whole-window strategy in real-time performance. The efficiency of the algorithm in the article is obviously higher than other algorithms.

The efficiency analysis of different algorithms.
Conclusion
Real-time event monitoring and querying has always been an important and difficult problem in the field of streaming data processing. In this article, the author carried out the research based on coal mine disaster events, and a new anti-aliasing identification model and a multistage identification method for abnormal events are proposed. First, it introduces the DTW algorithm and identifies whether the perceived data are the signals of disasters based on the similarity fitting between real time and the template waveform. Second, it proposes the sliding window mechanism to locate the start point of the matching between perceived data and the template waveform, which can guarantee the accuracy of the matching. Finally, it proposes a multistage identification and early warning mechanism based on the sliding window matching strategy and the characteristics of the waveforms of coal mine disasters, increasing the early warning level gradually with the successful result of the matching of 1/N size of the template as the warning threshold. And it introduces the PAA to optimize the calculation process, improving its efficiency. Experiments show that the method proposed in this article is more accurate and be used in real time.
Footnotes
Handling Editor: Hai Nguyen
Declaration of conflicting interests
The author(s) declared no potential conflicts of interest with respect to the research, authorship, and/or publication of this article.
Funding
The author(s) disclosed receipt of the following financial support for the research, authorship, and/or publication of this article: This work was supported by the National Natural Science Foundation of China (No. 51704138, No. 61472169, No. 61502215), the Key Research and Development Program of Liaoning Province (No. 2017231011), Shenyang City Young Science and Technology Innovation Talents Support Program (No. RC180244), and the Engineering Technology Research Center and Key Laboratory of Liaoning Province (No.2017051023).