
Abstract
In this study, the conversion relation between deformed configuration and strain during structural monitoring was analyzed based on the basic mechanics principle of materials. A distributed fiber optic measurement system was used to measure the accurate values of structural surface strain, and then calculate the intensity of surface-deformed configuration further. An optical fiber was attached to the surface of a flexible steel ruler, and the generated strain data were used to precisely measure the endpoint-deformed configuration of the ruler. Furthermore, the calculated deformed configuration was calculated and compared with the actual deformed configuration. It was found that the curves of calculated deformed configuration basically coincided (with a relative error of less than 0.6%) with the curves of actual deformed configuration.
Keywords
Introduction
During structural health monitoring, the precise assessment of structural surface-deformed configuration that occurs under the application of certain loads can reflect the mechanical properties and the service condition of a structure. The variation characteristics of real-time structural-deformed configuration can also be used to determine the failure state of a structure. 1 Therefore, surface-deformed configuration is considered one of the important parameters for structural health monitoring. 2 RC Chang and CE Lan 3 presented an evaluating method of aero elastic effects with no values of structural flexibility matrix to solve the mathematical problems in engineering, which could be avoided by non-destructive inspection. MS Islam and A Bagchi 4 developed a new methodology based on statistical pattern recognition technology, which estimated the reliability of the data and potential damage using statistical pattern matching techniques since the relationship between data from various sensors was established.
Structural-deformed configuration measurement methods can be divided into two main categories: traditional manual observation methods and automatic monitoring techniques. Traditional methods include surveys with contact-type instruments (displacement gauge and dial indicator), conventional geodetic surveys with theodolite and level gauge, and the total-station survey method. Although the accuracies of these methods are very high, they are inefficient, time-consuming, and labor demanding.5,6 In contrast, automatic monitoring techniques manifest low accuracy and are susceptible to environmental conditions, such as illumination, terrain, and temperature. The most common automatic monitoring methods are global positioning system (GPS) survey, communicating pipe survey, photo-electronic imaging survey, and laser-image deflection survey.7,8 As an active monitoring method, guided wave–based structural damage identification and health monitoring methods have become one of the main methods in the field of non-destructive testing and structural health monitoring. However, the propagation mechanism of guided waves is complex, especially the description of dispersion relation of special-shaped composite materials is far from accurate. At the same time, the imaging methods of guided wave damage are various, and the robustness is insufficient.9,10
Traditional methods require a long-term monitoring duration and a large workload. Moreover, due to limited monitoring points, traditional methods cannot effectively measure the continuous deformed configuration data of a structure in real time, and thus satisfactory results are difficult to achieve. Most structural deformed configuration monitoring projects require long-term monitoring by a dynamic process; therefore, structural health monitoring is regarded as a real-time dynamic process.
With the emergence of optical fibers, sensors are being developed with high sensitivity, quick adaptability, and excellent stability. Moreover, due to their excellent suitability in a harsh environment, optical fiber strain sensors are extensively applied to structural health monitoring.11–13 When structural deformed configuration develops into a certain extent, the distributions of strain on the surface of a structure become certain and unique.14–16 Optical fiber strain sensors measure the changes in strains on the surface of a structure, and deformed configurations generally occur in the perpendicular direction of strains. Therefore, during structural health monitoring, the conversion of strains measured by an optical fiber sensor into deformed configurations is one of the most important steps.
Based on a high-accuracy distributed strain measurement system, the conversion relation between strain and deformed configuration was studied, as well as the conversion equation was derived in the current paper. The structural surface deformed configuration of a steel ruler was calculated based on the endpoint-deformed configurations (obtained by converting the calculated strain data) of the measured area. Moreover, multiple conversion experiments were conducted to verify the accuracy of the conversion equation.
Optical frequency-domain reflectometry optical fiber–sensing technology
Optical frequency-domain reflectometry (OFDR) has an extremely high spatial resolution and is used to locate scattered signals by measuring the frequency of Rayleigh scattering generated by a modulated probe light source. OFDR technology and demodulation devices are shown in Figure 1.
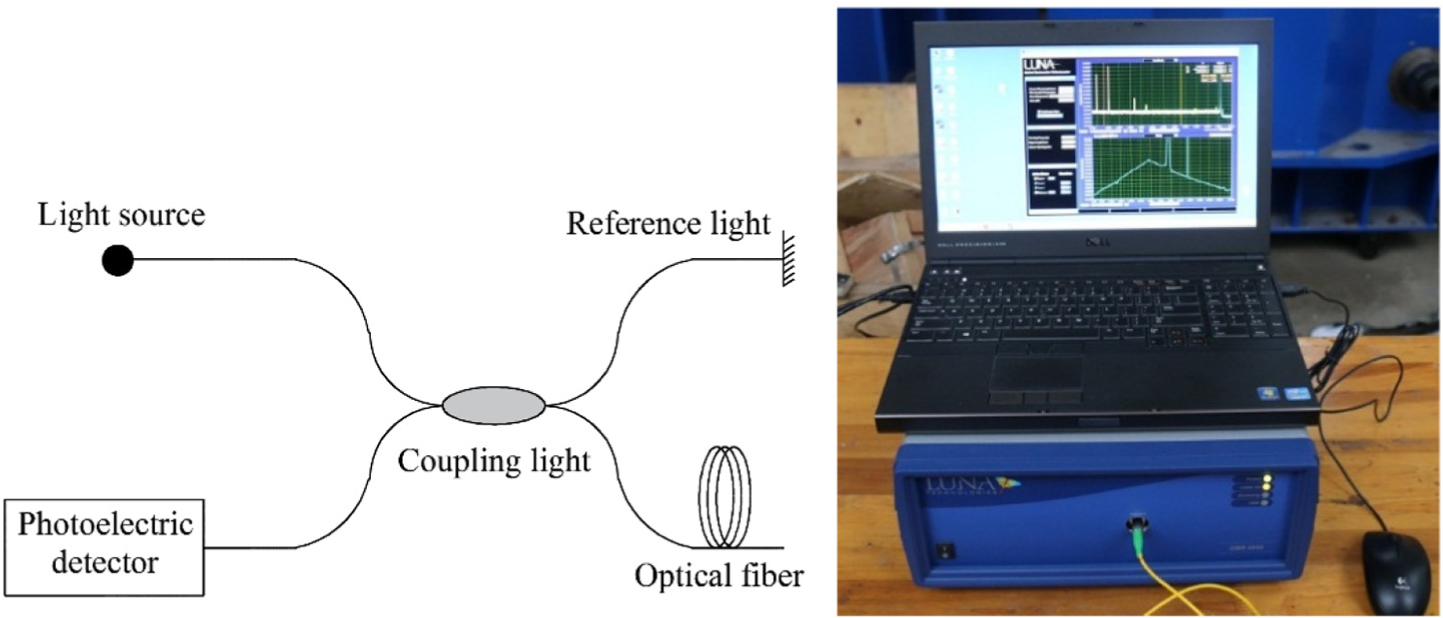
OFDR technology and demodulation equipment.
Under normal circumstances, the responsive changes in Rayleigh backscattering spectrum are mainly influenced by strain and temperature; therefore, any change in Rayleigh scattering in any area of an optical fiber causes significant changes in the corresponding backscattering spectrum, and these changes can be demarcated and converted into the changes in temperature and in strain. Each section of an optical fiber is regarded as an individual sensor; hence, a complete optical fiber is a continuous system of multiple sensors. 17
The type of OFDR system18,19 is ODSI-A, and the manufacturer is Luna Innovations Incorporated, USA, and the adjustable harmonic length interferometry technology used in the distributed optical fiber sensing system enables the measurement of distributed strain to have millimeter-level spatial resolution on a standard optical fiber that is 60-m long, and the measurement accuracy of strain can reach ± 1 με.
The strain can be calculated by equation (1)
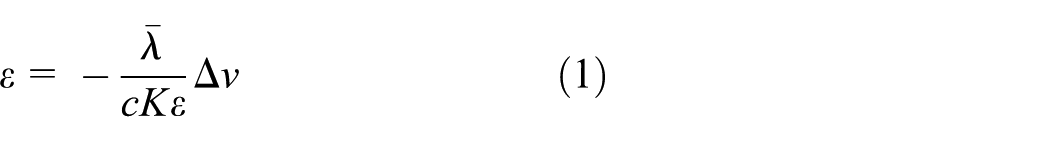
where
Derivation of the structural surface strain-deformed configuration conversion formula
The coordinate system of the horizontally deformed steel ruler (caused by a small deflection) is established in Figure 2. The steel ruler deforms in the Y axis perpendicular to the length direction (X axis) and the optical fiber paste in the middle of the ruler along the X axis direction.

Bending-deformed configuration of the steel ruler.
According to the basic principle of mechanics of materials, the differential equation of the deformed configuration curve can be expressed by

where E is the elastic modulus of the steel ruler, I represents the moment of inertia of the section about the neutral axis,

The corresponding second-order differential equation can be expressed by

where z is the distance (value of 1 mm) between adjacent strain data sampling points, and i is the generic one among the n number of strain measuring points. Furthermore, by substituting equation (4) into equation (3), the deformed configuration–strain relationship equation for the steel ruler can be obtained

It is evident from equation (5) that the structural deformed configuration of the steel ruler is only related to surface strain. Therefore, based on the obtained strain data of the measured points, several discrete strain functions can be formulated

The previous equations can be further rewritten in the following form

where
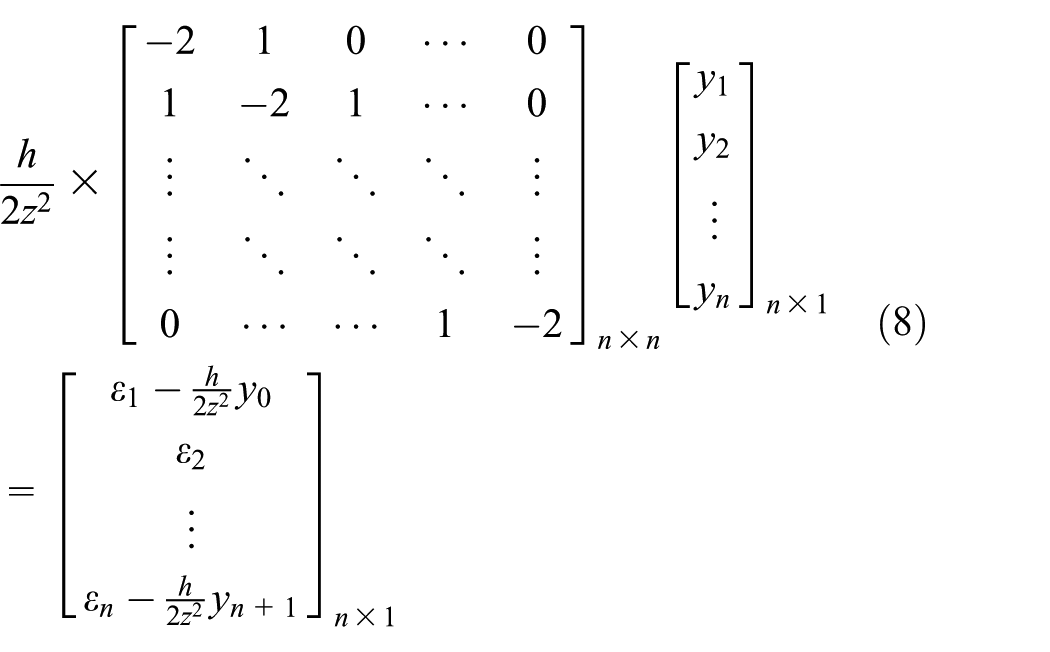
The coefficient matrix in equation (8) is a reversible square matrix. Therefore, the relationship between deformed configuration and strain can be obtained directly by matrix operation. The strain-deformed configuration transformation can be expressed by a continuous and intuitive deformed configuration field

where deformed configuration matrix
Deformed configuration of simply supported beam
When a load is applied to the structure, the structure will be deformed accordingly. As shown in Figure 3, the simply supported beam is subjected to a concentrated load
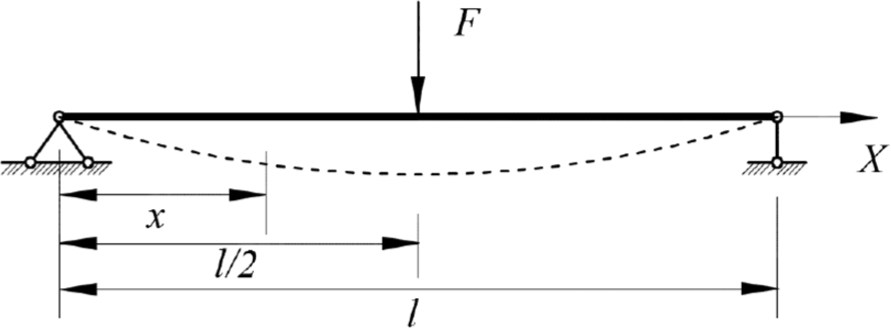
Deformed configuration of a simply supported beam under a concentrated load.
Although the geometric shape changes during the process of loading and the deformation is large, the structure is simple, the strain is small, and the change has no effect on the stress state of the structure, that is, the action point, direction and size of the force are not changed by the change of geometric shape. The structure is still in the elastic range, so the original theory (Hooke’s law) is still satisfied.
The deflection in a simply supported beam subjected to a concentrated load can be expressed by equation (10)

where
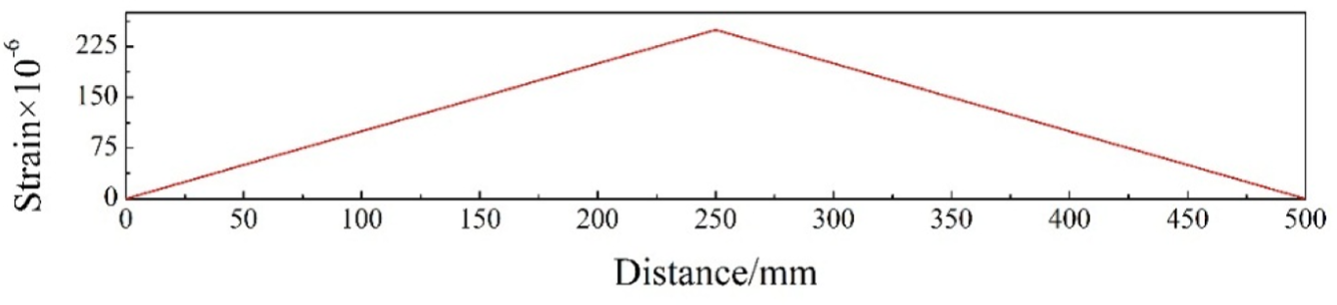
Strain distribution in a simply supported beam under a concentrated load in the middle.
Furthermore, the deflection of each point can be calculated from the strain-deformed configuration relationship presented in equation (10). The comparison of real deformed configuration and calculated deformed configuration is displayed in Figure 5.

Comparison of bending-deformed configuration results of a simply supported beam.
It is noticeable that the results of real deformed configuration were well consistent with those of the calculated deformed configuration, and the maximum and the minimum errors were found as 0.3129 and 0.3125 mm, respectively. The error rate curve followed a U shape, and the error rate at the middle region was close to 0. The error analysis is shown in Figure 6.

Error analysis.
Therefore, the strain-deformed configuration conversion algorithm based on OFDR strain measurement technology can effectively calculate the deformed configuration at any position of an optical fiber.
Deformed configuration measurement of a steel ruler
In order to verify the accuracy of the strain-deformed configuration conversion equation, a distributed optical fiber was attached to the surface of a flexible steel ruler (60-cm long, 3-cm wide, and 1-mm thick) (Figure 7).

Steel ruler with an optical fiber.
The optical fiber used in this test is a kind of tight-jacket fiber which was manufactured by Nanzee Sensing Co, Ltd, Suzhou Province, China. The type name of the fiber is SCDF-1-B with a polyurethane outer jacket and an acrylate coating around the fiber core. The adhesive used is a LOCTITE epoxy EP-120.
First, the surface of the steel ruler was polished and cleaned with alcohol. Second, the optical fiber was straightened along the center line of the steel ruler. Third, the epoxy resin was covered evenly on the optical fiber and ruler. The adhesive makes the optical fiber and the steel ruler bond tightly. Finally, the experiment was conducted after the epoxy resin was consolidated.20,21
Test plan
The first end of the ruler (left side in the figure) was simply supported, and a certain load was applied at the second end (right side in the figure) to bend it. After converting the strains measured on the surface of the ruler into deformed configuration, the actual deformed configuration was compared with the calculated deformed configuration. Since the test was performed on a mesh paper, the deformed configuration values were directly extracted by measuring the curved trajectory of the steel ruler. What we need to do in the actual test is to suppose the two ends of the ruler with both hands, so that the ruler can produce the required bending form. Temperature corrections were not needed because the temperature was kept uniform over the structure and constant since the start of load application. In case the temperature would have changed during the tests, a compensation procedure should be done on the data, as with any other strain gages.22,23 The material of the ruler is 304 stainless steel, Young’s modulus of the steel ruler is about 200 GPa, bending stiffness EI is 4.5 × 10⁵ N mm2 and tension–compression stiffness EA is 5.4 × 10⁶ N, which are larger than the fiber optic. The bond between optical fibers, adhesives, and steel rulers is perfect. Therefore, the influence caused by the stiffness difference can be ignored.
The deformation of ruler is the result of the interaction of force, moment, and end displacement. The test process can be simplified as the deformation of simply supported beam under the combined action of loads and moments as shown in Figure 8.
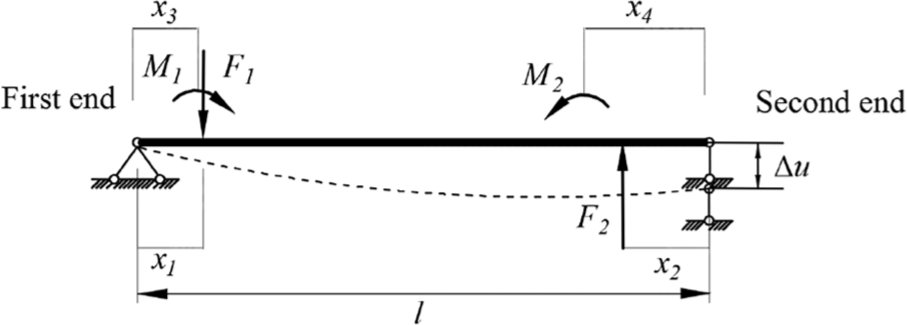
Loads diagram of the steel ruler.
As depicted in Figure 8, left hand of the tester grabbed the first end of the steel ruler to produce force F1 and moment M1, while right hand grabbed the second end of the steel ruler to produce force F2 and moment M2 when the experiment was conducted. The deformation of the ruler is the combined result of the interaction of force, the bending moment, and the end displacement. The deformation value had already been confirmed before the experiment was conducted. Forces and moments were adjusted to produce the designed deformation. But forces and moments may not be confirmed in some complex boundary conditions.
Test results
The test was carried out in four groups. Each group of test ruler was in a deformed state, and the deformed configuration trajectories of the ruler were analyzed. The sampling interval of strain data was set to 1 mm, and the results of strain measurement are illustrated in Figure 9.

Results of strain measurement.
The deformation degrees of tests #1, #2, and #3 are different, but the deformation directions are the same, that are all bent downward, while the deformation direction of #4 is upward. The purpose of tests #1, #2, and #3 is to verify the accuracy of the calculation method under different deformation degrees, while that of test #4 is to verify the accuracy under different deformation directions. In practical engineering, there are many aspects of deformation both degree and direction.
The bending degree of the ruler in tests #1, #2, and #3 varies with the value of these loads, while that of test #4 varies with the value and position of these loads, which makes the deformation degree and direction of the ruler different from the previous three tests.
The value and position of loads for each test are shown in Table 1.
Loads value and position.

Because the deformation directions of tests #1, #2, and #3 are downward, that is, the upper surface of ruler with optical fiber is compressed, and the strain state changes from positive (tensile) to negative (compressive) at the 150 mm of ruler, the strain values are mostly negative. While the deformation direction of test #4 is upward, that is, the upper surface of ruler with optical fiber is stretched, so the strain values are positive.
Correction of strain measurement results
When the steel ruler bends, the neutral layer keeps unchanged, the length near the neutral layer changes little, and the length far from the neutral layer changes greatly. Because the optical fiber sticks to the surface of the steel ruler, there is a certain difference between the strain detected by the optical fiber and the strain on the surface of the steel ruler. The factors affecting the difference are the thickness of the adhesive and the diameter of the optical fiber.12,13 The fiber and the bonding layer have a certain thickness, and tensile strain is larger than surface strains generated in the steel ruler after deformed configuration. In Figure 10, each section, after deformed configuration, is rotated by dθ relative to the center.

Bending deformed configuration diagram.
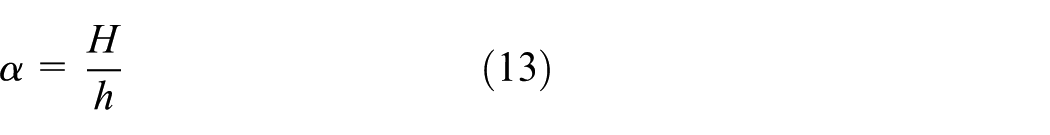
According to the definition of strain, the strain in the fiber can be calculated by equation (13)

where ρ is the radius of curvature.
Now, according to the working principle of a steel ruler

The bending radius
thus
where h is the thickness of the steel ruler (left of Figure 11), and H is the total thickness after sticking optical fiber (right of Figure 11). The thicknesses of the steel ruler before and after bonding with the optical fiber are presented in Figure 11.

Thicknesses of the steel ruler before and after bonding with the optical fiber.
The material parameters of steel ruler are as follows:
l = 600 mm, EI = E×b×h3/12 = 200 GPa×27 mm×1mm×1 mm×1 mm/12 = 4.5×10⁵ N mm2; and EA = E×b×h = 200 GPa×27 mm×1 mm = 5.4×10⁶ N.
The bending degrees were measured after every 60 mm along the direction of the steel ruler. The actual deformed configuration curves of the ruler are illustrated in Figure 12.
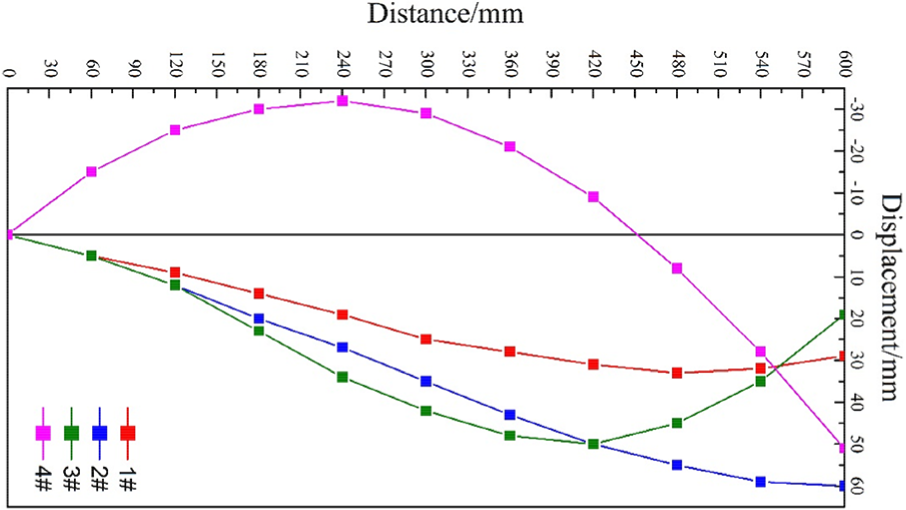
Actual deformed configuration results.
The measured strain data were further analyzed by equations (9) and (15) to calculate the deformed configuration. The results were shown in Figure 13.

Results of deformed configuration calculation.
It is clear that the strain-deformed configuration transformation results based on the differential algorithm were almost identical to the actual deformed configuration results.
Error analysis
For each test result, the comparison of actual deformed configuration and calculated deformed configuration was carried out at four different positions, as shown in Table 2.
Comparison of actual deformed configuration and calculated deformed configuration.

It is evident that the actual deformed configuration results were well consistent with the calculated results, and the maximum error was found to be less than 0.6%, as shown in Figure 14.

Results of error analysis.
Conclusion
This article studies the conversion relationship between strain and deformed configuration on a loaded specimen. Based on the basic principle of mechanics of materials, the strain-deformed configuration conversion equation was established.
Then, the accuracy of the conversion relationship was verified by the deformation test of steel ruler. The surface strain of steel ruler measured by optical fiber and the deformed configuration curves of all measured points were plotted. The calculated deformed configuration (based on the measured surface strains) of the steel ruler was found to be well consistent with the actual deformed configuration, and the maximum error was less than 0.6%.
The strain-deformed configuration conversion calculation method based on the optical fiber sensing technique can be extensively applied to bridge deflection analysis, to dam deformed configuration monitoring, and to horizontal displacement measurement of soil mass.
Footnotes
Handling Editor: Hai Nguyen
Declaration of conflicting interests
The author(s) declared no potential conflicts of interest with respect to the research, authorship, and/or publication of this article.
Funding
The author(s) disclosed receipt of the following financial support for the research, authorship, and/or publication of this article: This work was supported by the National Science Foundation for Young Scientists of China (grant no. 51608528); the Provincial Basic Research of Jiangsu (grant no. BK20161467); and the China Postdoctoral Science Foundation (grant no. 2016M601815).