
Abstract
The development of wireless acoustic sensor networks has driven the use of acoustic signals for target monitoring. Most monitoring applications require continuous network connectivity and data transfers, which can rapidly exhaust nodes’ energy. Consequently, sensors must collaborate in an adequate architecture to perform target recognition and localization tasks and then to send the results to a remote server with a reduced data volume. The design of an energy-efficient scheme that achieves acoustic target recognition and localization remains an open research problem. Accordingly, this article proposes a low-energy acoustic-based sensing scheme for target recognition and localization to be implemented in a cluster-based sensing approach designed to appropriately balance energy consumption and local processing performed by sensor nodes. A reduced set of low-complexity feature extraction methods in the time domain signal are used in the recognition process. The scheme uses the received energy of the acoustic signals for the target localization. This article details the network architecture, the scheme specification, and its implementation. The results show that the scheme can classify targets with 81.34% accuracy. It requires 3.2 mJ of energy when executed in MICAz, achieving 99% energy savings compared to streaming 3 s of an acoustic signal to a remote server.
Keywords
Introduction
Wireless sensor network (WSN) applications have experienced remarkable successes in recent decades and continue to attract the attention of researchers and industry. The primary factors driving the design of applications based on these systems are self-configuration, self-organization, easy deployment, and low costs. Nevertheless, the demands for multimedia-based applications have caused a shift from the use of traditional scalar sensors to sensors equipped with multimedia data-streaming capabilities. This shift has encouraged the adoption of wireless acoustic sensor networks (WASNs) consisting of smart microphone nodes capable of sensing, processing, and communicating audio streams. Acoustic sensors hold great potential for a wide range of applications due to their capability to provide abundant information. These systems are considered to be a promising infrastructure for many applications, particularly for hearing aids, ambient intelligence, and acoustic monitoring.
Target monitoring is among the most practical applications of WASN, in which sensor nodes are used to detect, identify, and locate acoustic targets in two-dimensional (2D) space. Acoustic source monitoring has great importance in environmental monitoring, home and office controls, and battlefield surveillance among many areas. Despite these benefits, most monitoring applications require continuous network connectivity and data transfer, which may hinder the widespread deployment of WASN. In-depth acoustic sensors often use high sampling frequencies of acoustic signals, inevitably resulting in high energy consumption during wireless transmission of the whole sensed acoustic signal. To avoid the problem of row acoustic data streaming to a remote server, which can rapidly exhaust nodes’ energy, an interesting alternative is to detect acoustic events locally and then report them to end users. In general, most acoustic target monitoring systems require the capability to both recognize and localize targets in the environment. In WASN, the success of an approach implementing these tasks depends on a sensor’s capability to perform accurate target recognition and to collaborate with other sensors to determine its location with minimal energy consumption. Whereas some previous works addressed acoustic-based target recognition,1–9 other works studied approaches for target localization in WSN.10–22 However, a solution that efficiently combines these capabilities in WASN has not yet been designed. Thus, a research work is still required to design a low-complexity, energy-aware recognition and localization scheme for WASN.
This research work is a new contribution in the area of acoustic-based sensing and target localization in WASN. It aims to specify and to design a new energy-aware sensing scheme to detect, recognize, and localize a target in a surveillance area using WASN. We extend our previous work 23 that focused on the design of an approach for target recognition intended to be used in habitat monitoring applications. The new proposed scheme is based on a low-complexity processing algorithms and communication techniques that reduce per-node energy consumption to prolong the network’s lifetime while guaranteeing the required application performance. The basic premise is to avoid data streaming required in classical acoustic–based sensing by detecting the event of interest at the source sensor before data transmission. Energy savings are achieved by local recognition of the target using optimized tasks for feature extraction from the received audio signal employed for classification. The received acoustic signal power measurements are then used for target localization employing energy-based localization techniques. The research work proposes, also, efficient task distribution over the sensors in the cluster-based architecture to achieve energy and time efficiency through a collaborative execution of the scheme.
The rest of the article is organized as follows. Section “Related work” reviews the related work, while section “General approach for target recognition and localization” describes the general approach for target recognition and localization in the low-energy acoustic sensing scheme. Then, it details the specification and the design of the proposed sensing scheme. Finally, the article discusses the results and the performance analysis before giving our conclusion and highlighting the future works.
Related work
Environmental monitoring is a fundamental problem that has increasingly attracted the attention of biologists in recent years. To optimize the management of ecosystems, animal recognition and localization has become an important research topic. Animal monitoring systems can produce valuable information that helps in protecting animals, planets, and overall natural environment. In this context, the use of WASNs for target recognition and localization has become an interesting low-cost approach for animal monitoring. Although these networks offer many advantages, there are several design issues and challenges associated with the deployment of the WASNs for monitoring purposes. Specifically, energy constraints, limited hardware processing resources, and the lack of efficient communication protocols represent problems associated with the use of WSNs that have not yet been entirely solved. 24
The majority of animal recognition algorithms described in the literature are based on the extraction of relevant features from an acoustic signal and then on the use of suitable classification algorithms to make a recognition decision. Among all existing audio features, mel-frequency cepstral coefficients (MFCCs) have been shown to be some of the most effective features in animal recognition systems. Noda et al. 1 deployed MFCC and linear frequency cepstral coefficient (LFCC) feature extraction methods to classify reptiles using two classification techniques: a support vector machine (SVM) and a k-nearest neighbor (kNN) algorithm, while Xie et al. 2 developed an intelligent recognition scheme to classify frog species based on six features that were extracted using several acoustic indices and cepstral coefficients. In other studies,3–5 the authors adopted MFCC and other features such as LFCC and energy entropy, in combination with syllable features to classify anurans species. These studies proved that the selection of a mixture of different domain features possess better discrimination ability when used for classification tasks compared to individual features such as MFCC, LFCC, or both MFCC and LFCC combined. Xie et al. 6 used a set of MFCC, linear predictive coding (LPC), and syllable features to recognize frog species using five different machine learning algorithms. Colonna et al. 7 also deployed syllable feature extraction methods to classify anuran species using several time domain features, such as the signal energy and zero crossing rate (ZCR).
The schemes presented for these animal recognition systems were computationally expensive, since they required a large set of different high complexity features that involve implementing signal transformation to convert a signal from the time domain to the frequency domain before applying the extraction technique. In addition, Luque et al. 8 claimed that syllable extraction is a highly complex task and is not suitable for a noisy environment; they suggested processing a waveform over successive frames as an alternative simple technique. However, despite the superior performance of the features proposed in the literature compared to time and frequency domain features, these schemes have seemingly insatiable demands for processing time, memory space, and computational power. In addition, most of the aforementioned animal recognition studies did not sufficiently address the transmission costs nor energy consumption of their proposed solution to demonstrate the feasibility of their approaches for a low-power sensor mote.
We believe that these schemes may not be adequate for real-time applications running on resource-constrained devices that provide timely data detection and transmission in order to locate and track a target of interest. Hence, it is important to fill this gap in the literature by designing an energy-efficient recognition scheme that best suits the specific requirements of sensor nodes. Applying a reduced set of low-complexity feature extraction methods in the time domain would be an efficient approach. These features may offer a simple and cost-effective solution, as they can be directly extracted from the original signal without any transformation. 25 ZCR and root mean square (RMS) are considered to be the most important and influential time domain features; thus, these features have been adopted by numerous applications, including speech–music discrimination, 26 sound/object classification,27–29 and animal classification tasks.5,9
As mentioned previously, we focused on using the average energy measurement of the detected acoustic signal to estimate a target’s location. Unlike the approach of locating a target using the time difference of arrival (TDOA) 10 and direction of arrival (DOA), 11 this approach is not very demanding in terms of processing power and data transmission. TDOA-based approaches typically require strict time synchronization between multiple microphone pairs, which requires high sampling rates, increased computational power, and complicated infrastructure at each sensor. 12 Such approaches also require accurate acquisition of the phases of the signals arriving at different motes. 13 Similarly, DOA-based localization methods require nodes equipped with multiple microphones, which should be capable of detecting the source signal and producing a DOA bearing estimate. 14 Hence, compared to TDOA and DOA methods, energy-based approaches offer an attractive option since they are applicable to WASNs and do not require microphone pairs at each sensor, high precision hardware, or a synchronization mechanism.
Owing to their ease of implementation and low costs, many energy-based localization methods have been introduced to estimate the target positions using WASNs. These methods have been reviewed in several different studies13–15 and include least square estimation (LSE), 16 weighted least squares (WLS), 17 projection onto convex sets (POCS), 18 semidefinite programming (SDP), 19 and convex second-order cone programming (SOCP) methods. 20 Meng and Xiao 13 studied the localization accuracy of these methods and proved that LSE methods can have relatively low localization accuracy compared to other methods. Nevertheless, Steen et al. 12 have shown that LSE methods, particularly the quadratic elimination (QE) least square method, can provide better localization accuracy than other localization methods in the presence of noise.
We used the QE least square method 16 in our approach to estimate the target location. The basic idea of QE is to pair the available signal power measurements to form hyperspheres. The circumferences of these hyperspheres intersect at the point in which the potential target may reside. Li and Hu 16 first applied this algorithm in 2003 to localize a single target object using its acoustic signal power17–21 and then adopted this algorithm to locate multiple target objects. 22 A more recent development is the application of the QE method to track target objects during wind gusts and background noise. 12 To the best of our knowledge, this approach can provide a good trade-off between estimation accuracy and computational complexity compared to other localization techniques published in prior studies. In fact, most of the reported works are algorithm developments and have not examined the performance in terms of energy consumption. Therefore, the primary contribution of this article is the design of an energy-efficient scheme and its energy efficiency for WASN, which can fill the research gap in this area.
General approach for target recognition and localization
In the proposed solution, the network comprises a set of distributed nodes aggregated using a suitable clustering algorithm (Figure 1). The cluster’s membership depends specifically on the adopted clustering technique, with which the distance and energy of the nodes are usually considered. The clustering in the proposed acoustic network could be performed based on a low-energy clustering method such as low-energy adaptive clustering hierarchy or low-energy adaptive clustering hierarchy-centralized algorithms. 30 The scope of this article does not cover the clustering process; instead, it focuses on the design of the energy-efficient sensing scheme, and it proposes a distribution of the tasks of this scheme among the sensors of the cluster, to perform a collaborative execution of detection, recognition, and localization.

Framework for the proposed target recognition and localization scheme in WASN.
The proposed smart edge-sensing strategy helps to restrict the transmission flow in the network and avoid transmitting the whole acoustic signal, which may contain useless information, to the end user. This approach is based on extracting a set of features, from the received signal, which are used for local classification and then transmitted to the cluster head (CH) when the target object is recognized. The target detection is based on a low-cost classification algorithm that matches the similarity between the newly extracted features’ vector and the previously stored reference descriptor.
During the network’s setup phase, sensor nodes are loaded with the target’s signature reference. A configuration packet is forwarded to CH nodes to be broadcast to all member nodes of the same cluster. Figure 1 illustrates a network with three clusters and a bird in the area covered by cluster 1. Each member node should periodically sense a new acoustic signal over a constant time interval (T). The average signal power during that time interval is measured by all the sensors (S1, S2, S3, and S4) receiving its acoustic signal. Each of these sensors compares the detected average powers against a predetermined threshold value to decide the detection of a new acoustic event.
When a sensor detects a new acoustic object, it locally performs the classification. Sensors that subsequently recognize the target notify the event to CH1. These notifications include the features’ vector and the received acoustic signal power (Figure 2(a)). If the received number of notifications is sufficient, CH1 estimates the target location and generates a notification, as requested by the end user. The notification packet can contain one of the following: a few bits’ notification, the features’ vector, or the target location and the features’ vector (Figure 2(b)).
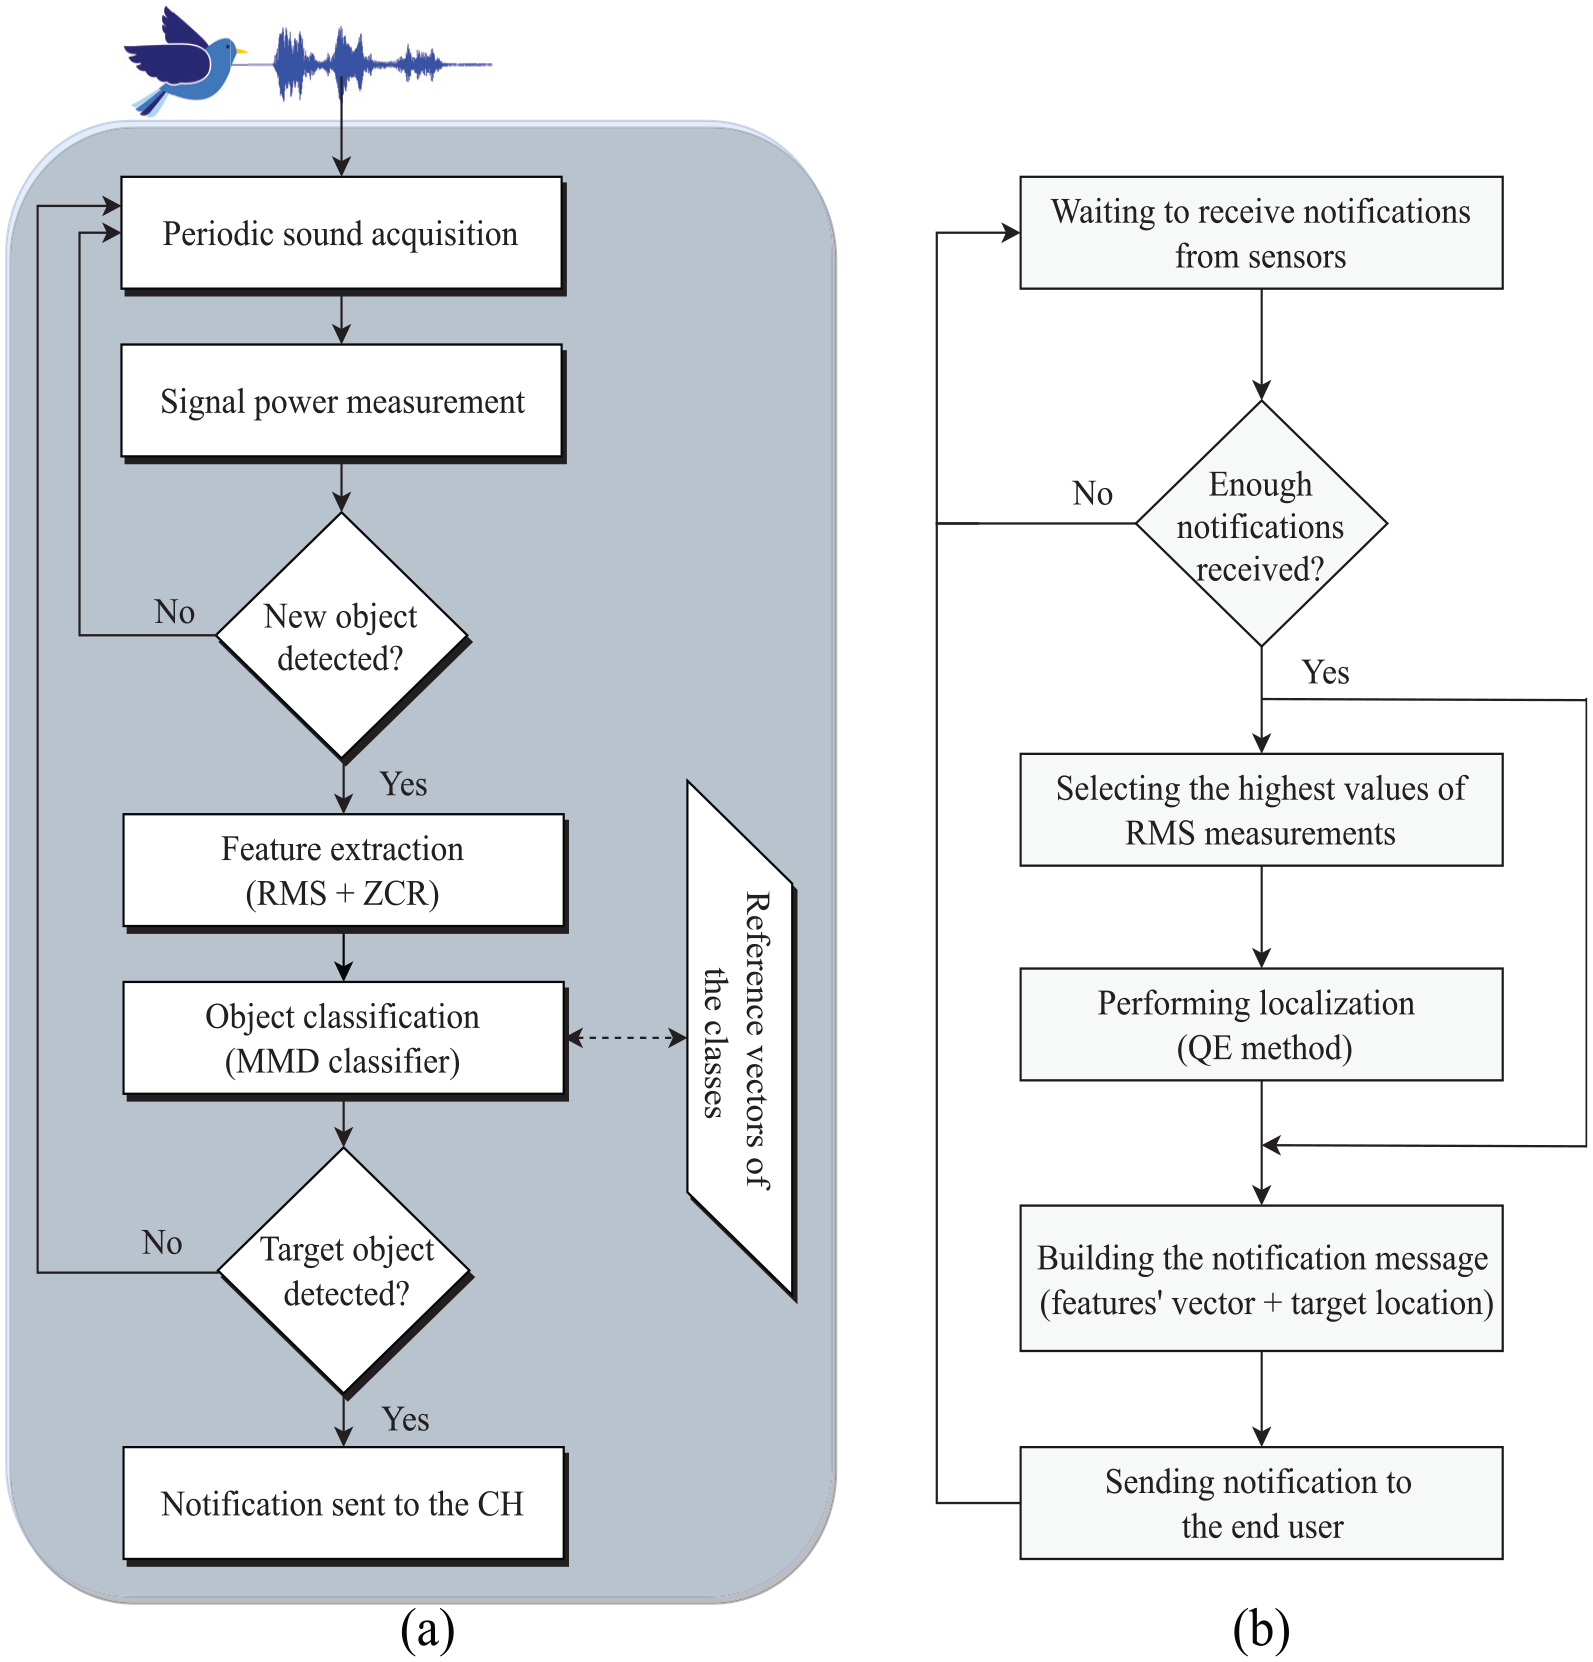
Flowcharts of the proposed sensing scheme for object recognition and localization at: (a) the sensor and (b) the cluster head level.
At CH1, estimation of the target location using all the received packets may not be the optimal way to save sensor energy. Indeed, the received packets may contain unreliable observations, usually dominated by high noise levels acquired by sensors far from the detected object. When these packets are considered in the localization, they decrease localization accuracy and increase energy consumption. To avoid this issue, CH1 should estimate the target location using a selected subset of the most informative measurements from the sensors closest to the target.
Nevertheless, most localization algorithms require a minimum number of observations for reliable location estimation. Therefore, CH1 should not perform the localization process unless a certain required number of measurements are received. This approach also guarantees that the localization task is not performed based on receiving a very few false detections caused by the target detection scheme’s uncertainty.
To reduce the volume of data transmitted to the remote server, the CH1 must select the features’ vector that comes from the sensor closest to the detected object, based on the received acoustic signals’ powers. The reduction in size of the notification data stream is intended to save further energy at the CH1, contributing to extending the network’s lifetime.
In fact, the proposed approach contributes to energy saving at different levels. It reduces computation overhead by deploying low-complexity feature extraction methods, a low-complexity classification method, and an energy-based localization technique. Furthermore, it uses, for the sensing scheme, a cooperative processing approach across the cluster-based network architecture (Figure 2) that balances the processing between the member sensors of the cluster. Also, among the set of packets communicated to CH1, a reduced number of signal power measurements are used to locate the target, which saves energy at the CH1.
During the notification to the end user, only a reduced number of packets that carry relevant data will be transmitted by the CH1, which reduces the radio transceiver activity. The reduced amount of data avoids the need for significant memory and storage space in the sensors. Therefore, considering the previously mentioned benefits, we think that the proposed sensing approach will significantly reduce the per-node energy consumption, extending the network’s lifetime. However, the validity and the efficiency of this approach will depend significantly on the designer’s ability to develop energy-efficient acoustic signal processing algorithms that ensure the objectives of the scheme.
Tasks’ specification of the proposed sensing scheme
As discussed previously, the efficiency of the proposed approach depends on the success of the adequacy between the implemented tasks of the scheme and the sensor resources on one hand and the performances at the application level on the other hand. The algorithms’ complexities related to the features’ extraction, object classification, and target localization should be energy efficient to ensure extended network lifetimes. The two main factors that should be considered in the design process are as follows:
Network resource constraints: data reduction is an effective approach to increase storage efficiency, to optimize bandwidth utilization, and to maximize energy efficiency. Therefore, it is necessary to define a low-dimensional vector of features that can represent a specific object uniquely using low computation cost extraction techniques. Moreover, the adopted classification model should be capable of producing predictions with the minimum number of predictor variables that achieve high classification accuracy. The localization algorithm should incur, on average, few sensor measurements and transmissions while preserving an acceptable level of accuracy.
Computational complexity: multimedia applications in WSNs often produce a huge volume of data that require deploying in-network data processing techniques in order to reduce the communication burden. 24 These methods contribute to decreasing the overall energy cost of wireless communication. However, the adopted algorithms must be computationally light with few mathematical operations that would reduce the number of clock cycles needed by the sensor processor to execute an algorithm and consequently decrease energy demands for data processing.
The structure for the proposed target recognition and localization scheme for acoustic-based sensing is represented in Figure 2. It is composed of several components that achieve the recognition and localization of the target.
Sampling period
In the proposed sensing scheme, the sampling period
Object detection
During the setup phase, each sensor acquires multiple new acoustic signals over a time interval (T). Each sensor computes the RMS time domain feature for every sensed signal and measures for all these acquired signals the average signal power

The object recognition phase comprises three main stages, which are signal framing, feature’s extraction, and object classification.
Signal framing
Signal framing is often a crucial pre-processing step applied to the acoustic signal before any further processing. Normally, an acoustic signal is not stationary, hence, the signal needs to be split into short-time segments in order to achieve stationarity. However, it is necessary to avoid any loss of information at the edge of frames when the signal is framed. Hence, it is important to divide these frames into a series of consecutive overlapping frames. Typical frame size in any signal-processing task has an overlap of 50% of the frame size.
31
The first step in the proposed recognition scheme (Figure 3) is to divide the continuous signal of

General scheme for features’ extraction process.
Features’ extraction
Features’ extraction is the basic processing step in the object recognition scheme as it helps to distinguish the target object from different objects with a relatively similar signal wave structure. Furthermore, in our approach, it is an efficient technique to reduce data for memory and bandwidth adequacy. In depth, the generation of small packets, containing the extracted features from the signal, to be transmitted upon the target detection, can reduce the communication overhead in the cluster and contribute to save energy.
For the features’ selection stage, we examined various types of feature extraction methods that have been adopted by similar works1–9 in the literature for animal classification purposes. These features’ extraction techniques can be divided into the following four categories:
Time domain features such as ZCR, short-time energy, sound amplitude, and peak detection.
Frequency domain features such as spectral centroid (SC), spectral roll-off (SR), bandwidth, and spectral flux.
Linear predictive cepstral coefficients.
MFCCs.
An extensive study of the algorithmic complexity and execution time of the method extracting these features has been conducted in different works.9,25 These characteristics are summarized in Table 1.
Feature extraction method computational complexity and execution time.

FFT: fast Fourier transform; LPCC: linear predication cepstral coefficients; MFCC: mel-frequency cepstral coefficients.
From this table, we can conclude that time domain features are the least computationally intensive features and can be executed in a short time. While frequency domain features require transforming the signal to the frequency domain first using the fast Fourier transform (FFT), which have the complexity of
The deployment of acoustic time domain features is sensitive to environmental noises such as blowing wind. 32 Therefore, many works have been proposed to combine the temporal features with more sophisticated frequency domain features in order to provide a robust solution against environmental noises.
We studied the behavior of four feature extraction techniques that belong to the time and frequency domain of signal: RMS, ZCR, SC, and SR. The selection of these features has been done based on similar works 5 that adopted these features to classify the acoustic signal into a specific animal class label. The classification performance of these features is measured using a collection of records belonging to 16 animals: cat, cow, dog, donkey, horse, parrot, sheep, buffalo, elephant, fox, leopard, lion, snake, tiger, vireo, and wolf. In our experiment, we extracted the selected four features from each record, and then we calculated the mean for each feature per class, as illustrated in Figure 4. The chart shows a similar sampling distribution for the mean value of the ZCR, SC, and SR features for different animal classes. Hence, we can infer that the three features can provide the same discrimination capabilities in the classification decision. However, computing the SC and SR requires higher computational cost and execution time compared to ZCR, although performing equally the same in the classification task. In addition, ZCR and SC can both be used to reflect the spectral shape of the acoustic signal.

Mean distribution for the: (a) time and (b) frequency domain features.
For this reason, RMS and ZCR 33 were selected to represent the target and to identify the detected object.
RMS: it is an effective feature to capture characteristics of the overall power of the audio signal. The RMS parameter is calculated according to the formula

where
ZCR: this feature reflects the spectral shape of the audio signal. It occurs when adjacent signals have different signs within a time window, which can be expressed as

where

The extraction of acoustic signal features follows three main steps as shown in Figure 3:
Removing silent frames: the recorded signal may include silent frames that do not contain appropriate features, which affect the quality of the extracted features. Hence, silent frames should be removed in order to improve the accuracy of the target recognition system. In the proposed silence-removing approach, a typical silent frame has an RMS value that is lower than 10% of the whole signal’s overall average power. Thus, the silence threshold value

If the

Extracting features for each frame: in this step, silence frames are discarded, and all the rest are passed through the ZCR feature extraction algorithm in order to generate a
Deriving feature vector: in the last stage, the vector of features that represents the full acoustic signal is constructed. Basically, the extracted features from all the (K) frames are combined to compute the mean value for each feature, and then concatenated into one feature vector {
Object classification
In the proposed scheme, we adopted the minimum mean distance (MMD) classifier 34 to recognize the target object. The main idea is to find the minimum Euclidean distance between the unknown object features’ vector and the target object signature vector. The advantage of the MMD classification algorithm is its model simplicity and its short execution time. In previous works, the MMD classifier has been commonly and successfully applied in acoustic target recognition systems. 35 In the proposed scheme, our emphasis will be on the development of a habitat-monitoring acoustic sensing approach that recognizes and locates a specific animal.
After extracting different features from the test data, we have noticed that there is a significant overlapping in the features’ vectors of different animals for the two features (RMS and ZCR), as shown in Figure 5. In fact, this figure shows that in the distribution of RMS and ZCR for the set of audio tests representing the dog and the cow, the values of ZCR and RMS overlap. The same is also true for the distribution of the ZCR and RMS extracted from the audio signals of the cat, donkey, and horse. This overlapping in the feature values makes it difficult to perform efficient recognition.

Vector of feature distribution for an animal dataset.
In order to define class boundaries correctly, the learning model needed an extended set of training recorders to capture the underlying structure of the data. However, with the limited number of records, it was very difficult to label the detected object to one target with high recognition accuracy. To overcome this problem, we developed a multi-label approach for efficient classification in which each detected object is classified as one of the two most matching classes (Figure 6). The couple of classes that is the output of the classifier will be notified to the end user for further accurate classification that could be based on deep learning process.

Multi-label classification process.
This method of classification is performed into the following two phases:
Pre-classification phase: it is an offline task that is implemented at the end user level in which the classes are defined for each target object as illustrated in Figure 7. Basically, each class of animals is represented by a single vector of features extracted from different training records that belong to the same animal class. First, the feature’s vectors containing RMS and ZCR features are extracted from the records. Then, for each feature, we calculate the mean value for all the extracted features. The target class signature and all the classes’ signatures will then be loaded into the memory of the acoustic sensors during the system setup phase, using a broadcasted packet that contains all the classes’ signatures.
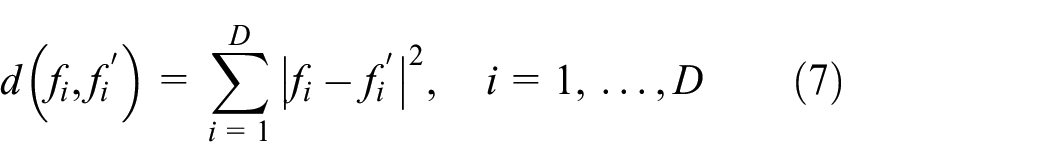
Classification phase: the classification process will be performed during the runtime at each sensor using the MMD classifier. Basically, the classifier measures the distance between the newly extracted object features’ vector

Creation of object classes’ process.
Object notification
The data communication in the network may have a major impact on the energy consumption levels in the WSNs. Thus, reducing the communication overhead in the notification process while considering the application requirements could significantly save energy. In the proposed scheme, a sensor node will assemble a notification packet according to its role in the cluster, which can be either a member sensor or a cluster head. In general, we adopted three notification types that might correspond to different application requirements.
To ensure the required exchanges in the proposed sensing scheme, different types of packets were specified (Figure 8). These packets will be used for configuration, notification, and acknowledgment purposes. The main packets were specified to ensure the required exchanges for the function of the proposed scheme. The configuration packet
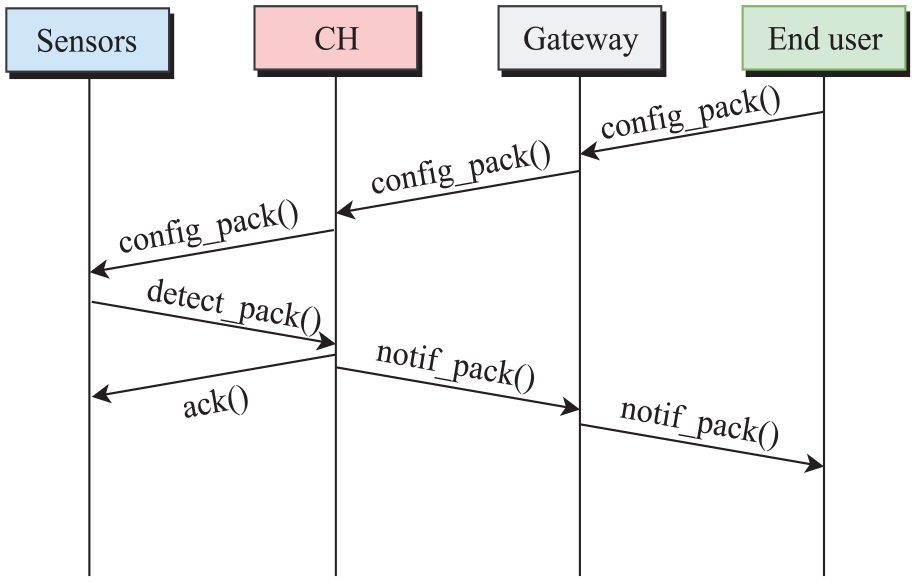
Exchanges in WASN for object recognition and notification.
Object localization
We adopted a lightweight acoustic source localization approach suitable for resource-constrained sensor nodes. The localization algorithm is based on the power of the received signals that is measured using the energy decay model 16 based on the inverse square law principle. 36 The main concept in this model is that the signal intensity emitted omni-directionally from an acoustic source is attenuated as the signal propagates toward the destination sensor node.
Consider a network composed of

where
A QE
16
method is formulated as a nonlinear optimization problem to solve the location of a single acoustic source within a 2D plane. The basic idea of QE is to group acoustic signal power measurements of a pair of sensors to form hyperspheres. The estimated location of the target can be obtained by taking the intersection of these hyperspheres on which the potential target

then, the energy ratio

The set of all possible points

where the center


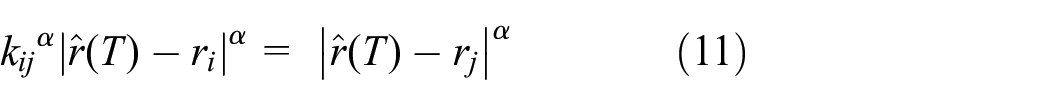
Based on these hyperspheres, a hyperplane will be formed by taking the intersection of two different pairs of circles (

denoting the theta

By pairing all hyperspheres,

which can be estimated by solving the following unconstrained QE least square problem

The general scenario considered for object localization using the QE method is depicted in Figure 9. The target is supposed to appear at a position (4.58, 2.66) in a cluster that is covered by a set of wireless acoustic sensors. Once the target is recognized, the surrounding sensors will measure the acoustic signal power
Concept of quadratic elimination term localization.
Meng and Xiao
13
have conducted an extensive study that examines the complexity of different energy-based localization methods.10–22 The reported computation complexity of different localization methods shows that LSE-based methods have a lower computation complexity compared to a WLS-based method, which has the complexity of
Implementation and performance analysis
The proposed scheme was implemented with the MATLAB tool 37 to evaluate its efficiency at the application level. For this purpose, several experiments were conducted to test the capability and accuracy of the proposed scheme to recognize and locate the target object successfully. Furthermore, we used the AVRORA tool 38 to evaluate the suitability of the scheme for low energy consumption and its effectiveness in reducing per-node’s energy consumption.
Performance analysis at the application level
Object recognition
To measure the success rate of the recognition process, we conducted several experiments using different audio records for a specific object class, each recorded under differing conditions. We mainly focused on evaluating the capabilities of the classifier to label a specific detected object to a multi-class target, assuming that only one target object is expected to appear in the area covered by the cluster. The classification model was tested using various animal records collected from multiple sources. Most of the records were obtained from Animals Birds Sound Effects CD. 39 The remaining records were collected from various open sound libraries. The dataset consisted of 114 animal audio recordings comprising seven animal classes (cat, cow, dog, donkey, horse, parrot, and sheep). These animals were grouped according to their habitat. An example of the records is presented in Figure 10, which represents multiple wildlife sample sounds of a cat and a dog.
Audio samples for two animals: (a) cat and (b) dog.
These animal calls were plotted before pre-processing the audio signal. Figure 10 shows that the signal was composed of some silent episodes between consecutive calls, which has to be removed to achieve efficient recognition. The collected records have different sampling rates and were saved in various file formats. Each record has variable recording durations and different levels of sound quality. In fact, some of these records were very noisy due to the environmental noises associated with the outdoor environment, such as wind, rain, and other animals. To fill these gaps, the records had to be pre-processed prior to the feature extraction stage.
In our solution, the pre-processing stage comprised three steps as illustrated in Figure 11, which were data cleaning, record segmentation, and signal re-sampling. These pre-processing steps were necessary to maintain acceptable classification accuracy and to avoid any bias in the recognition task. All records with poor sound quality were removed, and the remaining records were segmented into short equal length samples of 1–2 s. These records were then re-sampled at a unified sampling frequency of 44.1 kHz rate in a 16-bit wave format.

Audio record pre-processing steps.
Reference vector extraction and recognition accuracy
This step of learning model represents a basic task in the recognition process. A unique signature (one vector per animal type (
Mean value of the time domain features: (a) RMS and (b) ZCR feature values.
The capability of the scheme to successfully recognize the target was evaluated by measuring the number of correct predictions made by the classifier using the following metric

where
In our approach, we used MMD as a local classifier at the sensor level to classify the target object into one of the two classes. Table 2 illustrates the recognition ratio with successful classification for different animals. This table shows only five animal classes along with the overall average accuracy for all animal classes. For comparison purposes, the table also shows the classification results for other commonly used classifiers: the Gaussian mixture model (GMM), SVM, and decision tree (DT).
The recognition performance using four different classifiers.
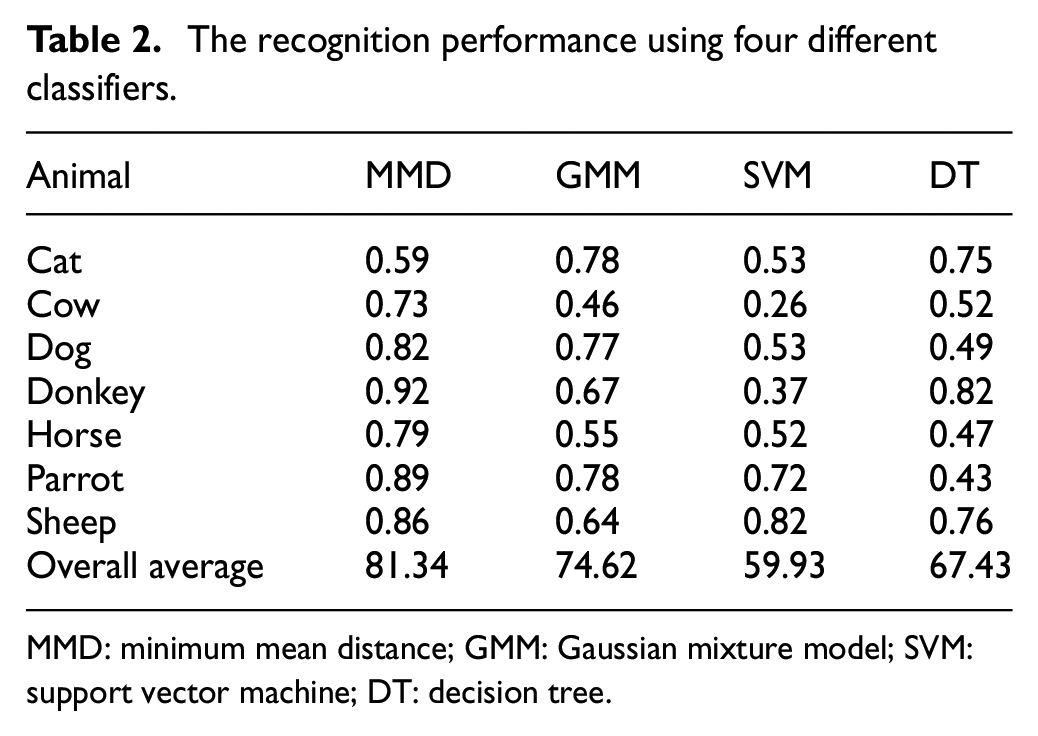
MMD: minimum mean distance; GMM: Gaussian mixture model; SVM: support vector machine; DT: decision tree.
From these results, it was found that the MMD classifier achieved better recognition results than the other classifiers, obtaining a total classification accuracy of 81.34%. The results presented in the table also showed that the GMM classifier was capable of outperforming the SVM and DT classifiers, gaining 74.62% recognition accuracy.
Object localization
We also investigated the capability of the proposed solution to accurately estimate the target location using the received acoustic signal power measurements. In the proposed architecture, the CH receives signal power measurements from its member sensors in the cluster that will be used to evaluate the location. Sets of experiments using different sensor distributions were conducted to localize one specific target in the surveillance area. For this study, we have adopted Monte Carlo simulations for a single target location using the MATLAB tool. 37 We were mainly interested in evaluating the performance of the QE algorithm for three case studies. Due to uncertainties in the energy-decay model, the proposed assumptions and parameter values are subject to error. Thus, in the first case, we explored the impact of the sensitivity of different model’s parameters on the accuracy of the location estimation. In the second case, we analyzed the capabilities of the QE algorithm to estimate the target position with varying numbers of sensor nodes in the cluster. In the third case, we investigated the effectiveness of using a reduced number of signal power measurements to obtain a reliable estimation of the target location.
The performance of the proposed method was verified using the location estimation error metric, which denotes the difference between the true target location and the estimated location. For this purpose, the root mean square error (RMSE) 12 defined by equation (21) was used to evaluate the accuracy of the location estimations obtained, considering all the numbers of Monte Carlo trails

where
The parameters used in the Monte Carlo simulation to evaluate the performance of the proposed scheme are shown in Table 3. The reduced set of studied simulation scenarios has been adopted by similar research studies,
16
and we believe that these parameters are the most relevant parameters for studying the performance of the energy-based decay model. We have considered several static sensors
Simulation parameters and configuration.
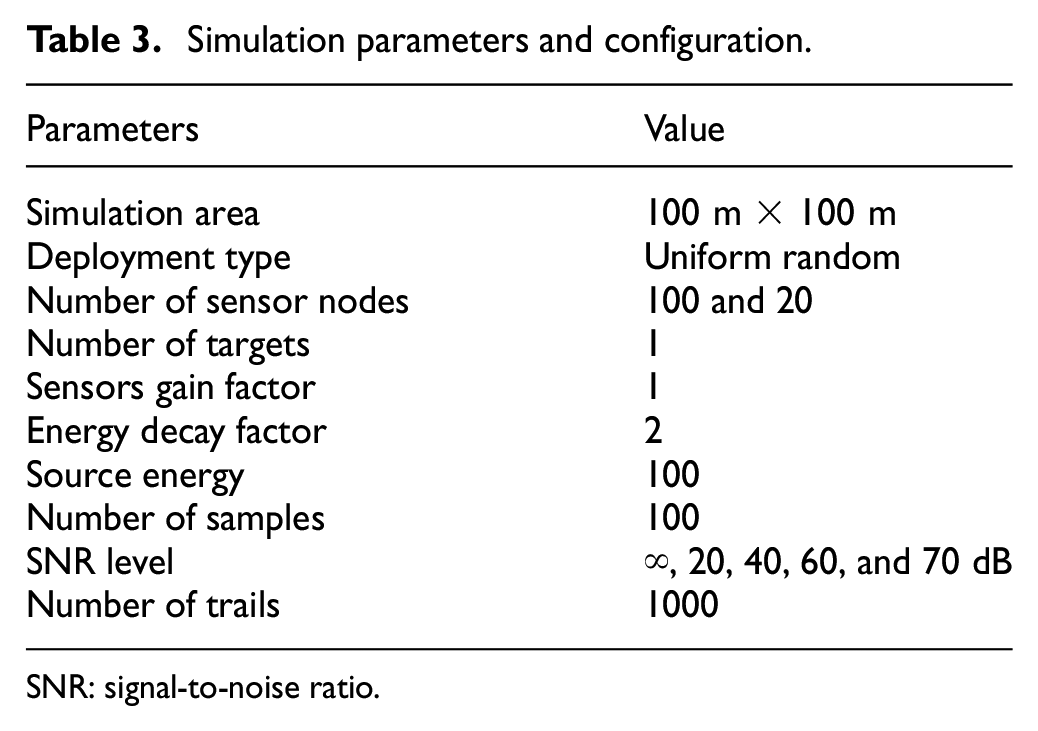
SNR: signal-to-noise ratio.
We investigated the sensitivity of the location estimation to different parameters. We analyzed the robustness of the localization method with respect to the variation in energy-based decay model parameters. The set of parameters considered in this study included the deviation of the real values of sensor location (r), the gain calibration factor (g), and the decay factor (α). Seven experimental configurations were considered in the simulations, as listed in Table 4. In the first configuration, the experiment was conducted with no noise or parameters’ variation, while the sensor’s location (r) was subject to a random fluctuation in the coordinate pair of configurations 2 and 3, respectively. In the fourth and fifth configurations, the sensor gain varied from its assumed fixed value
RMS error for different parameter settings.

SNR: signal-to-noise ratio; RMS: root mean square.
Due to the large number of Monte Carlo iterations (1000 runs), it was very difficult to show the results for all these iterations in one figure. Thus, for each configuration, the estimation results of only 20 iterations are presented (Figure 13). The impact of variation on sensors’ locations with values 0.5 and 1 is depicted in Figure 13(a) and (b), respectively. This figure shows that the accuracy of location estimation of the target was not heavily affected by the variation in the sensors’ locations for the values

Impacts of variations in model parameters on localization accuracy: (a) Δr = 0.5, (b) Δr = 1, (c) Δg = 0.5, (d) Δg = 1, (e) Δ
Figure 13(c) and (d) depicts errors in the location of the target with the variation in gain calibration factor (g) of the energy-based decay model with the values 0.5 and 1, respectively. The results in this figure show that the errors in the target location estimation are very significant with the variation of factor (g). Table 4 shows that the RMSE is very high for these values of variation in the gain calibration factor. The results in Figure 13(e) and (f) show that errors in the location of the target were not important with small changes in the value of the decay factor (α).
We investigated also the sensitivity of the location estimation in the presence of noise. Our aim in designing configurations 1 to 20 is to study the effects of different signal-to-noise ratios (SNRs) on the location estimate, which may also be affected by inaccurate measurements of parameters, as listed in Table 5. The impact of noise on the accuracy of the target location is illustrated in Figure 13(g)–(i) for the values of 60, 40, and 20 dB, respectively. This figure demonstrates that the accuracy of the QE localization method is very sensitive to noise. In particular, for SNR = 20 dB, the RMSE(s) values are greater than 40 m, reflecting a very low accuracy in the target location.
RMS error for different parameter settings in the presence of noise.

SNR: signal-to-noise ratio; RMS: root mean square.
Nonetheless, the configurations of SNR = 20 dB and SNR = 30 dB would correspond to very noisy environments, and in practical cases we expect to get higher level of SNR. Specifically, for high SNR values (greater than 60 dB), and without variation in the sensor gain calibration factor, the RMS error is low, which proves the efficiency of the QE method for target localization. We should note that the noise in the environment affects the power of the received acoustic signal at the sensor level, which not only reduces the localization performance of the energy-based localization methods but also affects the localization performance of the phase-based localization (TDOA 10 and DOA) 11 methods. 18 From Table 5, we can also note that the variation in the gain calibration factor impacts severely the accuracy of the target location estimation. Therefore, we can infer that precise gain calibrations and higher SNR values are critical success factors for the localization method in our scheme.
As expected theoretically, the localization error decreased as the number of deployed sensor nodes increased in the area. Figure 14 shows that the QE algorithm performed better when the cluster had more than 10 sensors. This figure also shows that the algorithm consistently performed almost as well when the number of sensors was equal to 20 or above. In fact, despite increasing the number of deployed sensors in the cluster (more than 20), the QE method did not offer significant benefit in terms of improving localization accuracy. However, the high density of nodes in the cluster would increase the classification rate.

Impacts of different numbers of sensors on localization accuracy.
Optimizing the number of acoustic signal power measurements
Intensive data processing is time- and energy-consuming and can severely reduce the sensor lifetime and the application viability. Most real-time monitoring applications require delay-bounded transmission of data. Besides radio transmissions, the internal data processing represents a significant overhead in time and energy. Thus, reducing data processing at the cluster head level would contribute to saving energy and meeting time constraints.
We have studied the optimal required signal power measurements that the CH has to consider for less-processing and accurate localization of the target. For this purpose, the simulation input parameters presented in the previous section were also assumed in this study, with only 20 sensors deployed in the cluster. The performance of the QE algorithm was evaluated at the CH for a variable number of reported signal power measurements ranging from 4 to 20. The sensors’ reported signal power measurements were selected based on the strength of the measurements. In the simulation, we initially started with four reported power measurements because the QE location estimator needs at least four measurements to obtain unique positions. 16 Figure 15 illustrates the results of target localization using the QE algorithm for a reduced number of sensors’ measurements.

Impacts of different number of selected signal power measurements on localization accuracy.
Figure 15 also shows that the localization algorithm was capable of performing with almost the same precision starting from six reported signal power measurements and above. Therefore, we can conclude that the optimal number of sensor power measurements needed to perform an accurate localization at the CH is six signal power measurements. This reduction in the number of signal power measurements significantly reduces the processing overhead at the CH, which consequently reduces its energy consumption. Furthermore, using only the highest received signal power measurements increases the accuracy of target localization since the CH selects the measurements reported by the node closest to the target.
Energy efficiency of the proposed scheme for sensor-based implementation
The capability of the proposed scheme in terms of energy efficiency and processing time was studied for the following three tasks: recognition, localization, and notification. We focused on measuring the number of clock cycles, reflecting the processing time, and the energy consumption of sensors in various scenarios. The AVRORA simulator 38 was adopted to evaluate these metrics. It is an instruction-level simulator emulating several sensor types, such as MICA, TelosB, and many other platforms. We estimated these metrics for MICAz motes, which have an ATmega128L microcontroller and 4 kB of RAM memory.
Object recognition
The energy efficiency and processing time for the tasks of new object detection, feature extraction, and classification were evaluated in each member sensor of the cluster. In this evaluation, the sensors were assumed to record sample signals at a frequency of 44,100 Hz. The simulation results for processing 1 s (44,100 samples) of the recorded sound are illustrated in Table 6.
Evaluation of the recognition cost on MICAz.
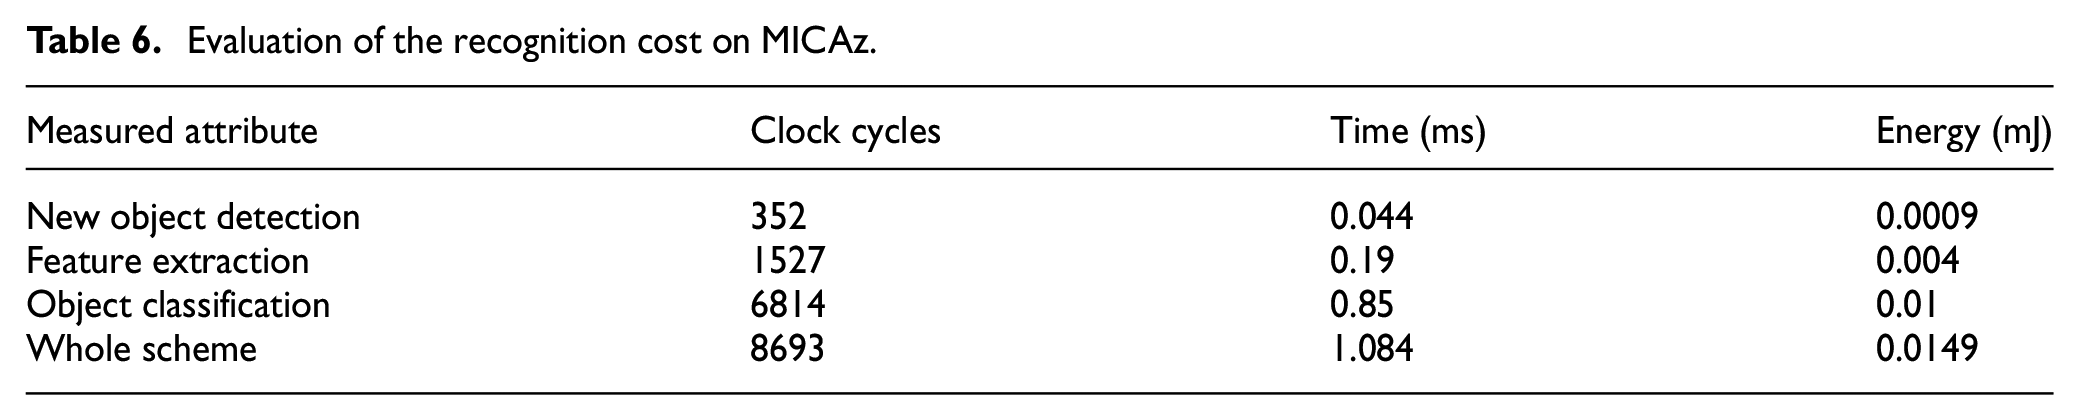
The information presented in this table shows that time and energy are highly consumed during the classification phase compared to other tasks. Object classification requires the processing of several mathematical operators using expensive computations that are performed while calculating the Euclidean distance between the features’ vectors. However, this step is fundamental in the strategy of smart edge sensing, since it detects events of interest and avoids streaming the whole acoustic signal. The reduction in the activity of the sensors’ wireless transceivers would reduce traffic in the network, consequently increasing the whole network lifetime.
The results presented in Table 6 prove that the proposed feature extraction and classification methods are suitable for implementation in resource-constrained sensor nodes. In fact, the proposed recognition scheme has less complexity and better recognition accuracy than other works when used to classify the target animal into multi-label classes. We believe that the small dataset used for testing the recognition performance has a major impact on the classification accuracy. Moreover, the significant overlap between the feature values for different animal classes is another important factor that influenced the recognition performance. Nevertheless, in spite of these limitations, the recognition scheme provided a good trade-off between cost and performance, leading to a prolonged system lifetime.
Object localization
This section evaluates the energy consumption of the CH node while performing the target localization (Table 7). In the first simulation, we studied the cost of the target location estimation in the CH for two different cases: using only six measurements or using all the reported measurements of sensors in the cluster.
Evaluation of the localization cost on MICAz.

Table 7 illustrates the time and energy consumption of the localization task for the two scenarios. As expected, minimizing the number of processed signal power measurements in the localization task can significantly decrease the residual energy consumption and processing time at the CH. In fact, the results indicate that the CH node can gain approximately 85.38% more energy when applying the selected signal power measurements approach, thus extending the CH node lifetime. In addition, it reduces the overall processing time and, hence, reduces the data transmission delay, which is critical for real-time applications, such as tracking tasks. Consequently, we can conclude that the adopted scheme with the reduced number of signal measurements minimizes the overall acoustic sensing cost and prolongs the lifetime of the acoustic-based application in the WSN.
Target notification
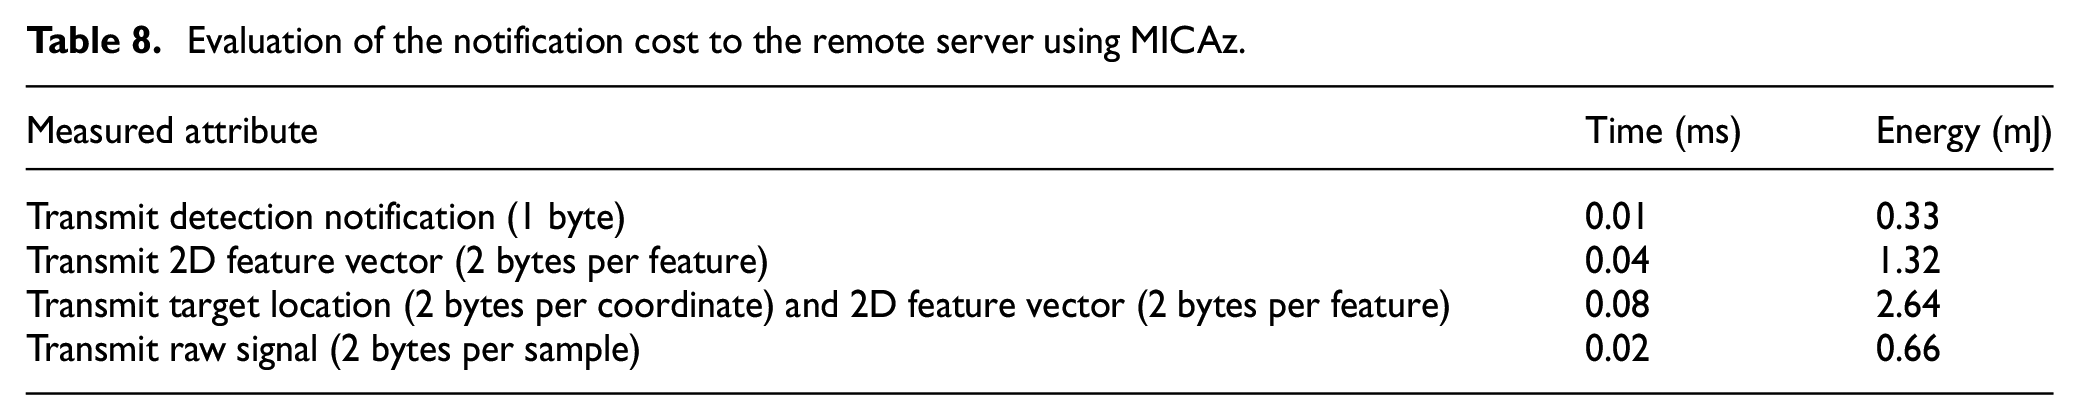
The processing time and energy consumption for the notification task are evaluated in this section. Table 8 provides the results of the notification cost. We considered several types of notifications that might correspond to different application requirements:
Notification of the target detection.
Notification of detection with the transmission of vector of features.
Notification of detection with the transmission of vector of features and target location.
Transmission of the whole acoustic signal.
Evaluation of the notification cost to the remote server using MICAz.
The sensor platform used for energy efficiency was MICAz. This sensor offers a bit rate of 250 kbps, which could be used to stream the received acoustic signal to the remote server. The signal has a sampling rate of 44,100 samples per second. Therefore, the energy consumed by a sensor during streaming of the recorded acoustic signal, denoted by

where
Using equation (22), the energy to transmit the full signal would be

where
Therefore, the gain in energy when using the proposed scheme is G = 99.9%, attesting to its energy efficiency when deployed for animal target monitoring.
Conclusion
In this article, we have proposed an efficient scheme for low-energy acoustic sensing in WASN. This scheme was designed to be implemented in a cluster-based architecture where tasks are processed over the sensors of the cluster and the CH. The presented sensing approach is intended to recognize a specific target using lightweight time domain features signatures extracted from the received acoustic signal. It was also designed to locate the target using an optimized, energy-based localization technique.
We studied the performances for low energy target recognition, localization, and notification. The results have shown that the adopted features’ extraction methods were able to generate unique signatures, which were successfully used to discriminate between different acoustic objects in the recognition process. It was also shown that the energy-based localization method was able to locate a target with an acceptable accuracy. Furthermore, the results have shown that the sensing scheme implemented in a cluster-based architecture was able to perform the required tasks with low energy consumption, which contributes to extending the network lifetime.
The approach and results presented in this article provide a foundation for many research works in acoustic sensing with WASNs. Further research should be conducted to extend the capability of the proposed scheme to more applications in acoustic monitoring, such as recognizing a target in a multi-object environment, localizing more than a single target within the sensor field, and tracking of single or multiple targets simultaneously. These contributions would improve upon and spur the development of acoustic monitoring applications. The implementation of the proposed scheme in a real sensor-based platform would also help to explore the actual performance of this sensing approach.
Footnotes
Acknowledgements
The authors extend their appreciation to the Deanship of Scientific Research at King Saud University for funding this work through research group number (RG-1439-023).
Handling Editor: Antonio Lazaro
Declaration of conflicting interests
The author(s) declared no potential conflicts of interest with respect to the research, authorship, and/or publication of this article.
Funding
The author(s) disclosed receipt of the following financial support for the research, authorship, and/or publication of this article: This research work was funded by Deanship of Scientific Research at King Saud University through research group number (RG-1439-023).