
Abstract
Currently, the boosting of location acquisition devices makes it possible to track all kinds of moving objects, and collect and store their trajectories in database. Therefore, how to find knowledge from huge amount of trajectory data has become an attractive topic. Movement pattern is an efficient way to understand moving objects’ behavior and analyze their habits. To promote the application of spatiotemporal data mining, a moving object activity pattern discovery system is designed and implemented in this article. First of all, raw trajectory data are preprocessed using methods like data clean, data interpolation, and compression. Second, a simplified density-based trajectory clustering algorithm is implemented to find and group similar movement patterns. Third, in order to discover the trends and periodicity of movement pattern, a trajectory periodic pattern mining algorithm is developed. Finally, comprehensive experiments with different parameters are conducted to validate the pattern discovery system. The experimental results show that the system is robust and efficient to analyze moving object trajectory data and discover useful patterns.
Introduction
With the rapid growth and widely used of GPS devices, RFID sensors, wireless communication, and satellites technologies during recent years, various moving objects can be traced all over the world. At the same time, more and more trajectories are collected and stored in databases. These data often contain a great deal of knowledge that requires urgent analysis. Currently, most research works focus on designing academic algorithms, and few of them concentrate on developing moving object data mining systems from systematic view. In fact, a powerful moving object data mining system can greatly promote the development and applications of moving object data mining and related technologies. Movement patterns are always with rich semantics that can be an efficient way to analyze the behavior and habit of moving objects. However, movement pattern discovering from trajectory database is a systematic work and needs complex computing. In this article, we aim to designing and implementing an effective and efficient moving object data mining system, which can be used to group moving object similar movement pattern and find their periodic pattern. It is hope that this work will serve as the stepping-stone for those interested in advancing moving object mining.
To give a comprehensive analysis on trajectory data, we design and implement a moving object activity pattern discovery system, which can be called APDS in brief. The APDS uses model, view, and control (MVC) architecture with object-orientation. Main functions and modules of APDS include trajectory preprocessing, trajectory clustering, periodic pattern discovery, and so on. Moreover, an extensible visualization module is also implemented for parameters interaction and results display. In the experiment part, taxi trajectory data in Beijing are used to valid the accuracy and efficiency of APDS. The main framework of APDS is given in Figure 1.

The framework of trajectory pattern discovery system.
Preprocessing is the most important foundation work in spatial and temporal data mining. It mainly used to clean raw trajectory, transfer coordinate, and compression redundancy. In real applications, location devices may be distorted in various environments and generate noisy trajectory, which may decrease the precision of trajectory analysis. Meanwhile, sampling earth coordinate should be transferred into plane coordinate to simplify the calculation in Euclidean space. Given a sampling point P = (<latitude, longitude>, sampling time), it should be transferred to P′ = (<x, y>, t). Moreover, there are also sampling points missing and redundant. For example, sampling points may disappear when an object moves to a closed space, and the sampling points may repeat at the same coordinate if a moving object stays in a region for long time. Therefore, raw trajectory need to be preprocessed before analysis.
Trajectory clustering analysis module can group similar trajectory pattern from micro-view by introducing trajectory structure concept. In order to find useful local pattern, sudden changed points in trajectories are found to partition trajectory into relative smooth segments. Second, structural similarity matrix between segments is calculated to measure inter features of segments. Then, a simplified density-based trajectory clustering is designed to group trajectory segments with similar movement patterns. Finally, a cluster representative method is introduced to denote a cluster with a representative line segment.
Periodic pattern discovery module can find the periodicity of moving objects based on cluster results. First, the total moving space is rasterized into grid cells. Second, cluster representative segments are mapped into cells. Then, a multi-granularity model is introduced to merge cells in different dimensions. Third, a periodic pattern discovery algorithm is developed to find periodic patterns with multiple granularities.
Visualization module mainly includes parameters interaction and results demonstration. In order to give a comprehensive analysis and intuitively display the results, this module is designed based on an electronic map. Visualization module also implements some experiment functions so that some comparison can be made.
In summary, the main works of this article are as follows:
A comprehensive framework for trajectory pattern discovery system is proposed from both arithmetic and systematic views. Typical algorithms with application value, such as preprocessing, clustering, and pattern discovery, are developed and integrated from application point.
A trajectory pattern discovery system is designed and implemented using MVC architecture with object-orientation, in which main modules on data mining are included. Each modules of the trajectory pattern discovery system are implemented in detail from both arithmetic and systematic views.
A series algorithms related to moving object activity pattern discovery, such as trajectory clustering algorithm and periodic pattern discovery algorithms.
The system and algorithms are validated and verified on real data set. Empirical studies demonstrate the effectiveness and efficiency of the system. Besides, visualization strategies are also developed to interact parameters and display results.
The rest of this article is organized as follows. The introduction and motivation is discussed in section “Introduction.” In section “Related works,” some related state-of-the-art works on trajectory data mining system are surveyed in breadth and depth. In section “Trajectory preprocessing,” trajectory preprocess and related techniques are developed to tidy trajectory data. A simplified density-based trajectory structural clustering algorithm is presented in section “Trajectory clustering.” Then, trajectory periodic pattern discovery algorithm is implemented in section “Periodic pattern discovery.” The empirical study and visualization are given in section “Experiments and visualization.” Finally, the conclusion and future work of our work are summarized in the last section.
Related works
During recent decades, with the development of location-aware devices, almost all kinds of moving objects equipped with positioning devices can be traced. These data often contain a great deal of knowledge that requires urgent analysis. The main tasks of spatial and temporal data mining include trajectory clustering,1,2 trajectory outlier detection,3,4 trajectory compression,5,6 moving object activity discovery, 7 and moving object pattern discovery. 8 Moving objects’ activity patterns mining is an important task for spatial–temporal data mining, and it is an efficient way to understand moving objects’ behavior and habits. However, most of the current researches focus on scientific problems, while few of them concentrate on the flexible and scalable data mining tools for massive-scale moving object data. Li et al. 9 designed a MoveMine system for sophisticated moving object data mining by integrating several attractive functions. Then, Wu et al. 10 further upgraded MoveMine to version 2.0 by adding substantial new methods (such as pairwise relationship patterns and following pattern) to find dynamic relationship patterns. A comprehensive moving object data mining system generally consists of the following modules: data model and management, data preprocessing, trajectory clustering, trajectory classification, and pattern discovery.
Moving object data management
Moving object data management is the most basic work for data analysis. Due to the diversity of location-based applications, there are quite many location information formats. Hence, a uniform data management platform is needed to model these location data. Yakufu and Atay 11 focused on knowledge discovery from moving object data. In their work, a moving object data model was implemented with the object-relational database system. With the data model, spatiotemporal data analysis and valuable information retrieving are performed. In order to give full view on moving object data management, Meng et al. 12 introduced some typical applications and key technologies about moving objects database (MOD). Zheng 13 gave an overview on trajectory data mining–related technologies and applications. Moving objects not only can be traced in outdoor environment but also can be located in indoor environment with the technology of indoor localization. Jin et al. 14 gave a comprehensive view on how to build a system to manage indoor moving objects. Except for location data itself, the storage and representation of deep semantic information also should be taken into account, because it can enhance the analysis ability for various location-based service (LBS) applications. Moreover, how to manage sparsity and uncertainty data is also crucial in MOD.
In order to enhance the access efficiency of moving objects data, many kinds of indexing structures are designed to improve moving objects’ patterns retrieval. Among the indexing and storage structures used in MOD, the famous ones include R-tree, 15 R*-tree, 16 and B-Tree. 17 Based on these techniques, some novel structures and indexes were proposed. For example, a new index tree was proposed to store trajectory data and their similarity matrix. 1 Moving objects in various environments needs different indexing structures. Krogh et al. 18 focused on network-constrained trajectory and proposed an SPNET (Shortest-Path compressed trajectories in NETworks) structure to exploit the parallel computing capabilities of modern machines and support both intra- and inter-query parallelism. Facing indoor moving objects, Kim et al. 19 proposed an efficient grid index to store and model indoor moving object data. These structures organize data and their distance matrix in an efficient way, using materialized technology to store pre-computed distance in materialized views, and trading space for time to improve the retrieval effectiveness. Therefore, how to balance the data storage and retrieval is very important in designing such a structure.
Moving object data preprocessing
Data preprocessing is quite crucial for moving object data mining. First of all, spatial trajectories are never perfectly accurate. Due to sensor noise and other factors, such as receiving poor positioning signals in urban canyons, 13 sometimes moving objects may be sampled at incredible locations according to their contextual environment. Therefore, some filtering techniques, such as mean and median filters, Kalman filter, as well as particle filter, should be applied to smooth the noise before the trajectory can be analyzed. For different purposes, there are various preprocessing tasks.
In road networks, Map Match13,20 is an important work for matching trajectories to corresponding road segments or representing road segments using trajectories. Liu et al. 20 proposed a map-matching algorithm called Passby to work on most simplified road networks, which can greatly reduce the storage size of a digital map in disk or memory after simplification. Goh et al. 21 focused on two improvements over existing hidden Markov model (HMM)-based algorithms and proposed an online map-matching algorithm based on the HMM. Noise and sparseness are two obstacles. In order to overcome these problems, noise filtering and cross-points detection are needed in designing robust Map Match algorithms.
Moving objects are often sampled with high frequency, and their trajectory data are trivial and redundant sometimes, which may bring the problems of storage, transmission, even analysis. Therefore, compression is also needed in data preprocessing. Sun et al. 6 classified trajectory compression algorithms into the following categories: line simplification, 22 road network–based compression, 23 feature-based compression, 24 code-based trajectory compression, 5 and online compression. 25 Besides, there are also some other technologies to transform trivial and redundant location points into event- or activity-based sequence. For example, in Yuan et al., 7 a grid-based approach was introduced to find the point of interests (POIs). Generally, code-based compression algorithms are often lossless, while the other algorithms are lossy ones. Line simplification algorithms sometimes have the highest compress ratio, but have the most information loss, whereas other compression algorithms are well balanced between compression ratio and information loss.
Different from noise, outlier detection is another way for data preprocessing, and it also can be viewed as knowledge discovery to certain degree. In many cases, outlier may have great impact on the final results and thus we should discover them first. There are quite many outlier detection algorithms in moving object data mining field. As discussed in Meng et al., 3 outliers can be classified into various categories according to different purposes. However, there are no ground truth data to demonstrate which data are outliers. Unsurprised methods are commonly used with some similarity matrices introduced to find objects which are most dissimilar to the others. For example, outlier is a by-product of clusters.
Moving object clustering
Clustering is to group data into clusters, making the data in one group more similar than that of others. 2 Clustering, as an unsupervised learning algorithm, has been widely used in moving object data mining. Trajectories in different environments may need different clustering algorithms. As discussed in Yuan et al., 2 and Zheng, 13 moving object clustering algorithms can classified into the following categories: spatial-based clustering, time-dependent clustering, uncertain clustering, semantic clustering, and road network clustering.
In order to find similar local movement patterns, Lee et al. 26 first used minimum description length (MDL) to approximately partition trajectories into segments. Then, they proposed a density-based clustering algorithm to group similar segments. Based on the idea from Lee et al., 26 Yuan et al. 1 tried to find similar trajectories from micro-view. First of all, a concept of open angle was introduced to find the sudden changed points, at which trajectories can be partitioned into segments. Then, they proposed a novel trajectory clustering algorithm based on trajectory structure features. Moreover, an index tree was designed to speed up the similarity retrieval. In many cases, trajectories are in the form of stream, thus how to find clusters in an ongoing trajectory stream has been becoming a meaningful task. Li et al. 27 proposed a two-phase online trajectory clustering algorithm, including online micro-cluster maintenance and offline macro-cluster creation. Micro-clusters are used to store compact summaries of similar trajectory line segments, which take much smaller space than raw trajectories. Macro-clusters are performed on the set of micro-clusters rather than on trajectories over the whole time span.
Different clustering algorithms are of different advantages. For example, density-based clustering algorithms are good at detecting noisy data. Partition-based clustering algorithms are relative easy to implement. Moreover, how to decide proper parameters is also a challenge. Therefore, clustering algorithms need iteration many times before they reaching final results.
Moving object classification
Classification is one of the popular supervised learning algorithms by identifying the similarity or distance with labeled data. Moving object classification is mainly used to find moving objects of different categories based on the features abstracted from their trajectories. Antonio 28 analyzed the speed and the acceleration or deceleration of each point that composes the traces, and then found the behavior of the implicated vehicles by comparing them with the general official data published by the traffic authorities. Nanni et al. 29 proposed a solution for the car insurance industry, where the mobility behaviors, different mobility needs, driving habits, and skills imply different requirements and risks, were deeply analyzed. Feng and Timmermans 30 tried to examine the merits of employing accelerometer data in combination with GPS data in transportation mode identification. Three approaches (GPS data only, accelerometer data only, and a combination of both accelerometer and GPS data) were designed and examined. Then, a Bayesian Belief Network model was used to infer transportation modes and activity episodes simultaneously. Zhang et al. 31 used Permutation Entropy of speed to measure of the complexity and uncertainty of GPS trajectory segment. Then they employed Extreme Learning Machine to distinguish GPS trajectory segments of different transportation.
Current trajectory classification is mainly used to find moving objects’ different activities and a wide application areas, such as driver behavior analysis and transport model detection. One difficulty for using classification algorithms is that there are few labeled data in moving object database.
Moving object activity pattern discovery
Activity pattern discovery is an efficient way to analyze moving objects’ habit and behavior. To tackle the challenge of efficient gathering patterns discovery, Zheng et al. 32 developed a set of novel techniques on archived trajectory data set. Afterward, they further proposed an online discovery solution by applying a series of optimization schemes for dynamic trajectory data. Facing many challenges in mining spatial–temporal sequence patterns, such as noisy and overlap of movement patterns, and complexity of group behavior, Verhein 33 proposed a series of solutions for these challenges, which can find spatial–temporal sequence association rules. Jeung et al. 34 developed three efficient algorithms that adopt the well-known filter-refinement framework for convoy discovery. First, distance bounds between the simplified trajectories were established, with which, convoys can be discovered efficiently without missing any actual convoys. Then, in the refinement step, the candidate convoys were further processed to obtain the actual convoys. In order to find periodic patterns from trajectory data. Yuan et al. 8 proposed a multi-granularity periodic activity discovery algorithm for moving objects. First, trivial and redundant trajectory were transformed into activities. Then, a spatial–temporal multi-granularity model was given to model their activities from different views. Finally, a novel periodic pattern discovery algorithm was proposed to find periodic patterns with unknown periods.
Although activity pattern discovery can find useful knowledge with high semantics, it is quite expensive computationally. Moreover, different activity patterns always may have different challenges. In order to find activity pattern efficiently, some filters and optimized methods are needed to reduce the computing complexity.
Moving object data mining system
The design and implementation of a moving object data mining system are a systematic work. Although some researchers, such as Li et al., 9 Wu et al., 10 and Nandan and Sinjaya, 35 developed spatial–temporal or moving object data mining systems, to some extent, they still focus on the related algorithms. In order to give a comprehensive view on moving object data mining systems, we design and implement a system (called APDS for short) for discovering movement pattern from trajectory database in this article. The APDS is designed in a comprehensive way, including data management, data preprocessing, trajectory clustering, periodic pattern discovery, and result visualization. Moreover, some state-of-the-art works are also used in the APDS for better performance. It is hoped that this research will serve as the stepping-stone for those interested in advancing moving object mining.
Trajectory preprocessing
Due to location acquiring devices and their sampling rates, trajectory sampling points are always trivial, noisy, and even missing. In order to enhance the analysis effect, these data need be preprocessed. In this section, the trajectory definition is given first. Then, preprocessing strategies, such as trajectory clean, missing point interpolation, and trajectory compression, are introduced to filter and smooth trajectory data in detail.
Trajectory definition
A trajectory represents a moving object’s continuous motion history in theory. It refers to the fine-grained location traces collected via a variety of devices. 3 Due to the limitation of location positioning devices (such as sensors and GPS devices), a trajectory in real world is a sequence of locations observed at discrete time instances.
Given TD as Trajectory Database which denotes trajectories set, and TD = {TR1, TR2, …, TRn}. A trajectory (TR) is a chronological sequence consisted of multi-dimensional points, which is denoted by TRi = {P1, P2, …, Pm} (1 ≤ i ≤ n). A sampling point Pj (1 ≤ j ≤ m) in a TR is represented as <Locationj, Tj >, which means that the position of the moving object is Locationj at the sampling time of Tj. Locationj is a multi-dimensional location point. A trajectory Pc1, Pc2, …, Pci (1 ≤ c1 < c2 < ··· ≤ m) represents a trajectory segment or sub-trajectory of a trajectory TRi, denoted as TS (Trajectory Segment), TSi ={Li1, Li2, …, Linum}.
Generally, a raw trajectory point is a two-dimensional location coordinate (x and y) or a three-dimensional coordinate with height information (h). To simplify, we assume each point is a two-dimensional coordinate.
Trajectory clean
Due to external factors or much disturbance on positioning devices in moving periods, there are many outliers existing in trajectory data. Outlier can be classified into two catalogs. One is activity outlier caused by moving object’s abnormal behavior. The other is unexpected noise caused by sampling error. Noise is one of the main negative factors in trajectory analysis. Therefore, the real trajectories may be quite noisy or even missing.
In Figure 2(a), P4 and P7 are two possible outlier points. We need to check the two points according to the following hypothesis: Given Pi – 1, Pi, and Pi + 1 are three points in chronological order, if Pi is a suspected outlier, then the speeds of [Pi – 1, Pi] and [Pi, Pi + 1] may be quite different from the average speed v between [Pi – 1, Pi + 1]. In other words, if the path length of [ti – 1, ti] is less than reachable radius r1 and the path length of [ti, ti + 1] is less than radius r2, then possible area that Pi may appear can be projected according to v, r1, and r2. If Pi appear in the cross area shown as the yellow part in Figure 2(b), then, Pi can be viewed as a normal point; otherwise, Pi is an outlier that should be removed.

Outlier detection in trajectories: (a) outlier detection from trajectory projection and (b) outlier detection from velocity analysis. 36
As discussed in Yuan et al., 5 particle filter is an effective and efficient way to smooth trajectory. There are mainly four stages of noise reduction: particle initialization, state transition, importance sampling, and re-sampling.
In the first stage, the frequency of events is used to indicate the probability of events themselves. Following the process of particle filter, a real and error-free trajectory can be denoted as a sequence of coordinates Xi = (xi, yi)
T
. The initialization step is to generate N particles
In the state transition stage, the state of each particle in a frame is estimated according to the state of all particles in their previous frame. The process that particles state transforming from previous frame to current frame is called transmission, which can be denoted as Xi = Xi – 1 + ui and Zi = Xi + vi—where the former is the state transition equation and the latter is the observational equation. ui and vi are Gaussian noise.
Based on the processing of the first two stages, it is concluded that not all the particles perform equally. Therefore, a particle weight
During the re-sampling stage, the particle set
Missing point interpolation
Due to environmental reasons, sampling points may miss sometimes. If such data are used for analyzing, the precision may be reduced. Therefore, missing data should be completed approximately. As shown in Figure 3, the black solid points are real sampling location, while the hollow points are approximately interpolated points following some rules. Given an example, if the points at t2 and t5 cannot be captured, then we need to infer the two locations. So, the efficient way is to interpolate proper points to this trajectory.
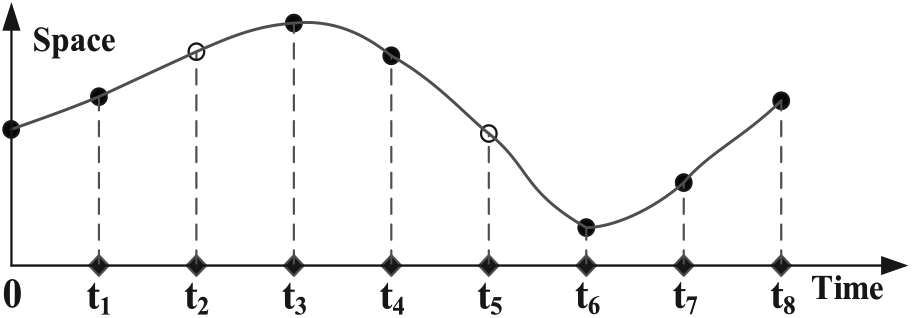
Trajectory missing data and interpolation.
First of all, we assume the object undergoes uniform motion in a straight line between each two points. Then, interpolation method can be used to insert approximate points into original trajectories. Suppose a trajectory as follows:
The average speed on X axis in

And, the average speed on Y axis can be computed using formula (2)

Then, at arbitrary


Trajectory compression
Contrary to interpolation, trajectory compression is another important aspect that should be paid attention to. As time goes on, the volume of trajectory data may increase exponentially, which presents a series of problems in storage, transmission, and analysis.
Douglas–Peucker (DP) algorithm provides an efficient way for curve simplification. It recursively selects points whose perpendicular distances (PD) are greater than the given threshold until all points reserved meeting the condition. Its advantages include translation and rotation invariance, namely, given a trajectory and a threshold, the compressed result is certain no matter how many times it executes. However, there is an apparent drawback on DP algorithm, that is, only spatial information considered and temporal information neglected. Therefore, in this article, we use synchronous Euclidean distance (SED) instead of PD. The Douglas–Peucker algorithm is given in Algorithm 1.
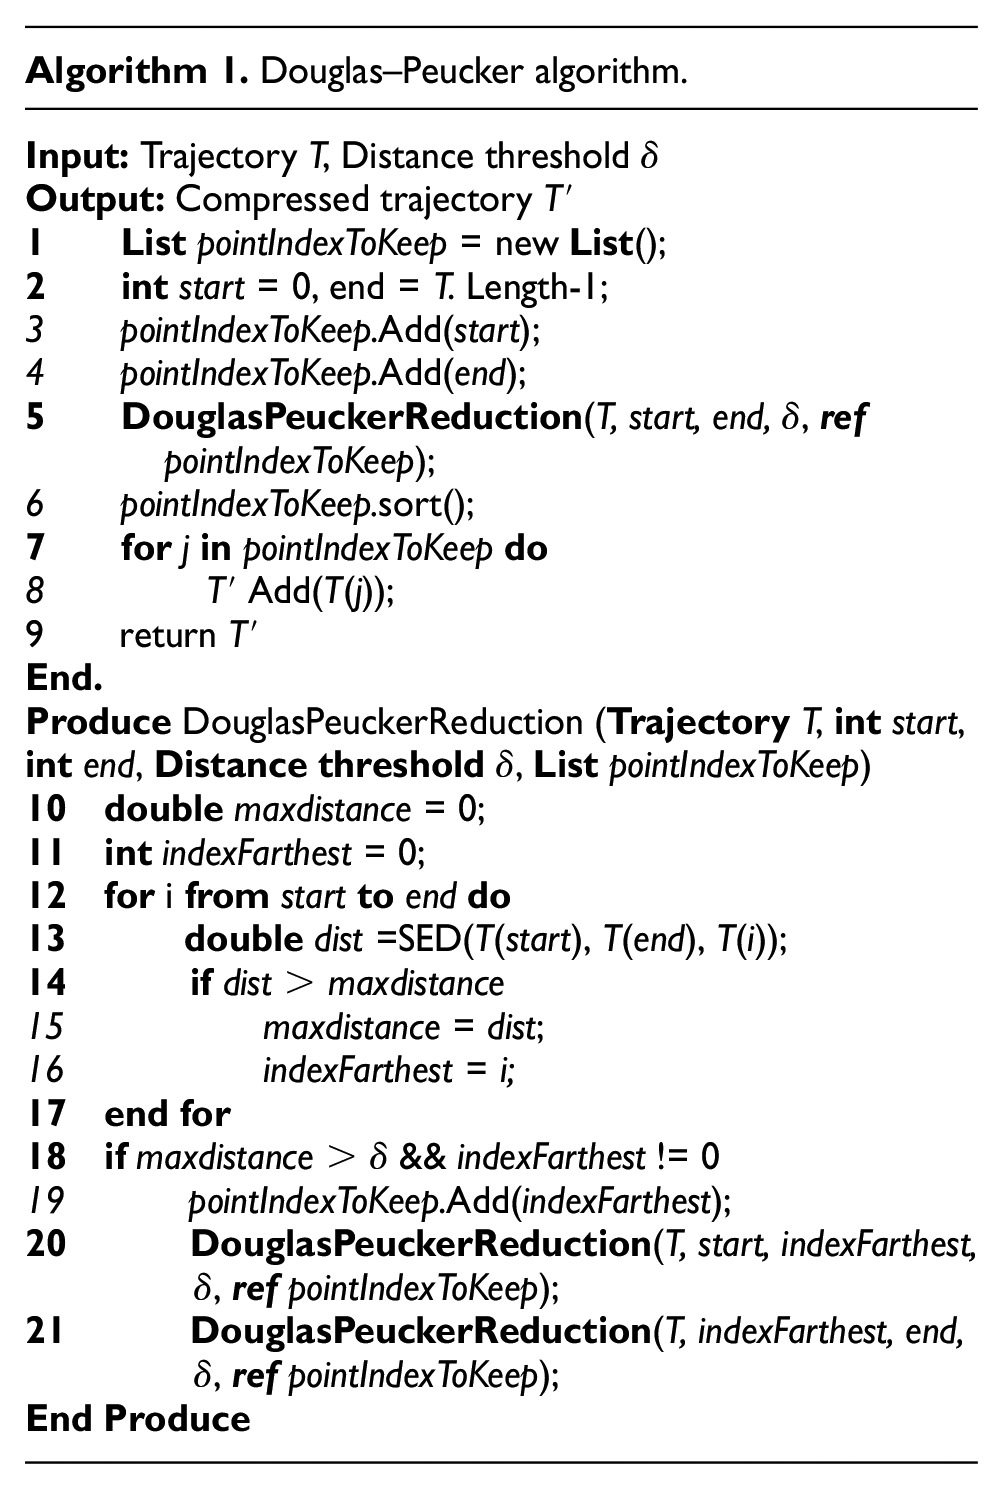
In Algorithm 1, points are selected recursively according to SED. For the line 1, a list is initialized to keep the indexes of all reserved points. Line 13 calculates the synchronous Euclidean distance from T(i) to line segment (T[start], T[end]). The worst-case running time of the original Douglas–Peucker algorithm is O(n2), where n is the number of original points. And, the complexity can be brought down to O(nlogn) using an convex hull approach. 11
The design of trajectory preprocessing module
Moving object activity pattern discovery system is implemented by modularized software design mode. Relationships within modules are high cohesion, and relationships between modules are low coupling. In this way, the scalability and stability can be greatly enhanced. Trajectory preprocessing module mainly includes two interfaces and five data classes. The class diagrams are given in Figure 4: the ConnData class implements ConnDB and ReadFile interface, through which data access method can be standardized. Point class is the abstraction of sampling points, while Trajectory and Segment classes are used to represent trajectory and its segments, respectively. DataPrepare is a class for trajectory preprocessing, and its methods include trajectory reconstruction, data clean, noise reduction, interpolation, and compression. Trajectory preprocessing module is the foundation of the whole system and mainly provides uniform data to its upper modules. In this module, trajectory data in many formats, such as databases and text files, are all can be read and treated.
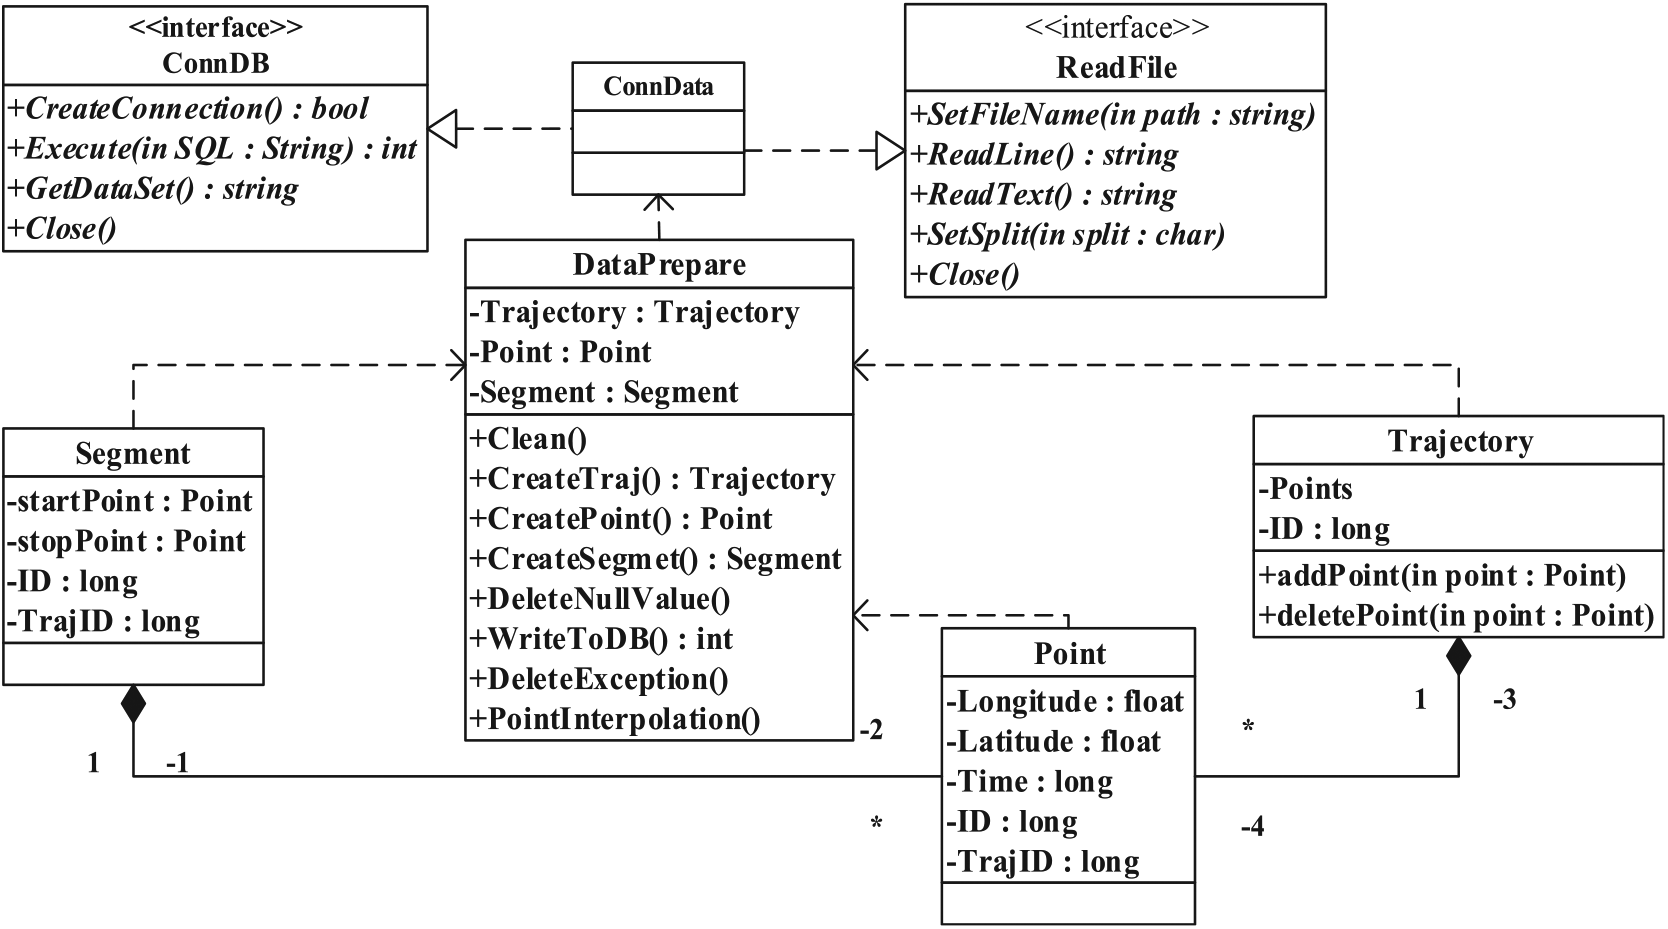
The class diagrams of preprocessing module.
Trajectory clustering
Clustering is an efficient way to group data into different classes based on the previously unknown internal schemes inherent of the data. Therefore, moving object trajectory clustering undoubtedly becomes the focus of the study on moving object pattern mining. In this section, we propose a density-based trajectory structural clustering algorithm based on Yuan et al. 1 and Li et al. 9 The detail steps are given as follows.
Trajectory partition
In this section, trajectories are partitioned into segments according to their sudden changed points so that trajectory segments can be viewed as moving objects with smooth movement pattern. In order to describe trajectory clustering algorithm, some definitions on trajectory partition are given as follows.
Definition 1
Open angle: given three points {p–, p, p+} in a sub-trajectory Lk, they can constitute an angle ∠p–pp+ = α less than π, showed in Figure 5(a). If α ≤ αmax (αmax is the given threshold), then α can be called as open angle and p is marked as a key point.
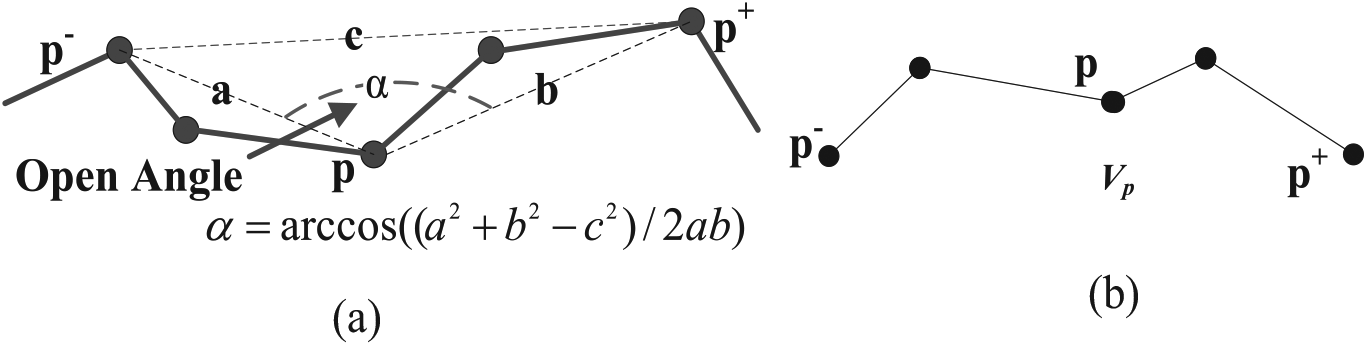
The open angle and key point in a trajectory: (a) open angle and (b) key point in a trajectory.
Definition 2
Key point: given a point p in a sub-trajectory Lk. If the velocity difference from p to each point p′ that the distance is within (dmin, dmax) is greater than or equal to Vt (Vt is the threshold), then no matter how great the open angle at p is, the point p can be marked as a key point, and it is also called sudden changed point. The line between two adjacent key points is the partitioned trajectory segment (shown as Figure 5(b)).
To overcome the shortage that traditional algorithms take full trajectories as comparison unit, a trajectory partition algorithm with velocity constraints (TPVC) is introduced by extending two-pass corner-detection algorithm.
4
As shown in Figure 6, the first step is to scan each point of the trajectory. If the point satisfies one of the following two conditions: (1)

Key points detection: (a) calculate candidate key points and (b) clear superfluous candidate key points.
Trajectory structure abstraction
The trajectory structure is denoted by its four features, which are Direction, Speed, Angle, and Location. A weight vector W = {WD, WS, WA, WL} is given to adjust the sensitivity of each feature. The definitions of structure feature abstraction are given in Table 1.
Definition of structure feature abstraction.

Due to space limitation, the detailed computation formulas can be referred in Yuan et al. 1 In Figure 7(a), there are two trajectory segments, and their structure features abstraction and distance are given in Figure 7(b)–(e). From these figures, we can see the deviation of each structure features of the two segments. With the four structure features, the structural similarity of the two segments can be computed. SDIST (equation (5)) is the structural distance and N(···) is a distance normalization function. SSIM is represented in equation (6)


Original trajectories and their structural distances: (a) original trajectories, (b) direction distance, (c) speed distance, (d) angle distance, and (e) location distance.
The input of trajectory clustering algorithm is trajectory segments set, and its output is the core segments of cluster. In the output results, segments marked with the same core id belong to the same cluster. Then, if we input a data set with n trajectory segments, TS ={TS1, TS2, …, TSn} (n > 0), and the results may contain m (0 < m ≤ n) clusters. There are two extreme cases: all input segments belong to the same cluster (m = 1) and the other is each segment belongs to a cluster (m = n).
Related definitions on trajectory clustering
In order to describe trajectory clustering clearly, some definitions are given as follows.
Definition 3
ε-Neighbor: for a given neighbor threshold ε and a segment Li, all segments within a radius of ε from Lj (i ≠ j) and Lj satisfies SDIST(Li, Lj) ≤ ε, then Lj belongs to the ε-neighbor of Li, which can be denoted by Lj ∈ Nε(Li).
The ε-neighbor reflects the matching degree between segments. According to ε-neighbor, trajectory segments, which are more similar than others, may be grouped into one cluster.
Definition 4
Core segment: for a given segment Li and a natural number σ, if σ ≤ |Nε(Li)|, core-distance is the neighbor number of Li, and its σth neighbor can be denoted by σ-Dis(Li). The core-distance of Li is given in formula (7)

If the neighbor number of Li is less than σ (|Nε(Li)| < σ), then σ-Dis(Li) = Ø, in which σ is a user specified parameter.
Definition 5
Reachability distance: for two given segments Li and Lj (i ≠ j), and a natural number σ (σ ≤ |Nε(Li)|), the reachability distance between Li and Lj is defined in formula (8)
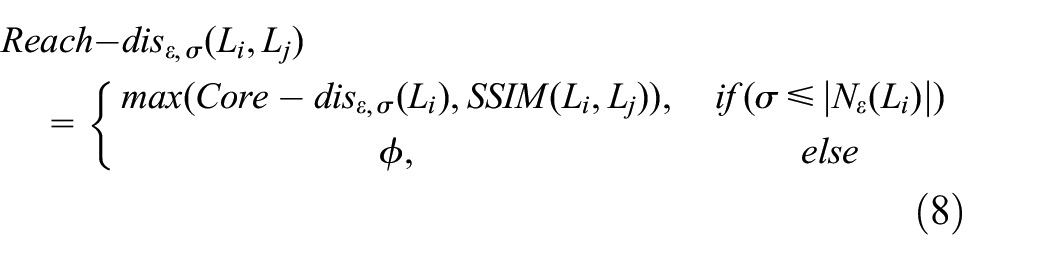
Similar to Definition 5, if the neighbor number of Li is less than σ (|Nε(Li)|
Density-based trajectory clustering
Trajectory structural clustering algorithm used in this article is based on DBSCAN (density-based spatial clustering of applications with noise). 37 Traditional DBSCAN algorithm needs two parameters, one is neighbor threshold ε and the other is minimum line count MinPts. For simplification, trajectory structural clustering algorithm neglects MinPts and does not consider dense reachable segment set. Only segments with distance ε near core segment Li are considered. In order to obtain low-dense area and its attribute, we count the total segments in a cluster as its attribute value, then it can be used to differentiate low- and high-dense areas. When analyzing high-dense area, clusters with few segments may be viewed as noise. Trajectory clustering algorithm is given in Algorithm 2.

From lines 3–5, all segments in the data set are treated iteratively, and the total execution time depends on the size of trajectory data. Lines 6–31 show details of trajectory clustering algorithm. First of all, neighbors of L are queried and marked as dense reachable segments. Lines 6–22 show pseudocode of procedure
Suppose the input data size is n, then the time complexity of procedure
Trajectory clustering representive
In a cluster, there are many trajectory segments included, which may bring some difficulties in trajectory analyzing. As discussed above, trajectories (segments) in a cluster can be viewed as a movement pattern. In order to simplify analysis, similar movement patterns should be well represented. Therefore, in this article, we introduce a representative trajectory generation algorithm 26 to describe the overall movement of the trajectory segments that belong to the cluster. The example of cluster representative is given in Figure 8. In the figure, there is a trajectory cluster and the red one is the representative cluster.

Example of cluster representative.
The main steps to represent a cluster are as follows. First of all, the average direction vector
The design of trajectory clustering module
The class diagram of trajectory clustering module is given in Figure 9. In this module, there are mainly seven classes. Interface cluster provides the operation criterion of trajectory clustering. The entities of Trajectory and Segment are used to represent trajectory data and segments. The class Partition is used to partition trajectory into segments. The classes TMC and Micro-cluster are functional and used to group segments into different clusters.

The class diagram of trajectory clustering module.
Periodic pattern discovery
Periodicity is a common feature of moving objects’ activity. Due to the uncertainty and triviality of sampling points, it is hard to analyze mining moving object patterns on raw trajectory data. As discussed above in section “Trajectory clustering,” clustering results can be viewed as similar group movement patterns. Using clustering-representative trajectory, the uncertainty and triviality of raw trajectory in activity pattern mining can be solved. In this section, a trajectory group periodic pattern algorithm and a pattern discovery module are designed to find moving object periodic pattern. First, a density grid is introduced to rasterize moving area into cells, and it also can be used to represent movement pattern from different granularities. Then, representative line segments are mapped into geographic cells. Third, moving object periodic patterns can be discovered by analyzing density grid cells.
Representation of movement pattern
First, moving objects’ activity area is rasterized into grid cells, and each cell represents a minimum spatial granularity. Then, trajectories are mapped into grid cells. Figure 10 shows spatial density grid for moving object.

The class diagram of trajectory clustering module: (a) density grid and (b) multi-granularity representation.
In density grid of Figure 10(a), each cell that trajectory cross is marked in dark color. For a cell, the more trajectories cross, the darker color is. In Figure 10(a), we can see three kinds of cells: A, B, and C. For A, there is only one trajectory cross the cell, so its color is light gray. While two trajectories cross cell B, thus the color of B is gray. Then, three trajectories cross cell C, therefore the color of C is darker than the other two. Therefore, in this way, movement pattern can be well represented. In order to find periodic pattern with different granularities, a multi-granularity model 8 is introduced to describe movement patterns. Themulti-granularity model is given in Figure 10(b), and each cell means a movement with the specified granularity. Pi, jk means total trajectories appear in cell (i, j) with time granularity of k. Using multi-granularity model, movement periodic pattern can be analyzed flexibly.
Periodic pattern discovery
In order to store moving objects’ periodic activities. A data structure HRList 8 is introduced, which is shown in Figure 11. HRSet is the set of hot regions that an object often visits and stays according to the related granularity. The construction of HRList is described as follows. First, an activity sequence S is generated by checking an object’s individual visits to each HR in HRSet. At the same time, each time instance in the HR is collected and transformed into the corresponding granularity and stored in the time list (g1, g2, …, gn). Second, a hash-map HRList is built to store hot regions and their access times in S, with which the related HRs can be quickly located and each time list can be easily traversed. The time instance in each time list is the access time of an object’s individual visit to the corresponding HR, and τList is used to store the periodic patterns with a length of τ after period detection.

Data structure of periodic detection.
In real life, periodicity may be distorted due to many kinds of reasons. The degree of distortion is determined by the deviation of the period length and interval, which are denoted by δ1 and δ2, respectively. If both δ1 and δ2 are equivalent to 0, then P is a perfect pattern. Suppose the noise and distortion in the periods (each τ in τList) obey a Gaussian distribution; X ∼ N(μ, δ2), where μ is the mean value and δ2 is the variance of τ. Therefore, with a specified τ, the mean value and variance computational formula of the period length and period interval are given as formulas (9)–(12). In order to simplify the computation and representation, we use standard variance δ to measure the deviation of the period length and interval


where μ1 and δ1 are the mean value and standard variance of the period length and μ2 and δ2 are the mean value and standard variance of the period interval between two adjacent period segments, respectively. We can easily identify pattern types using the mean value and variance computational formulas. If δ1 is equivalent to 0, all the patterns in Pτ have the same length μ1. If δ2 is equivalent to 0, all the patterns in Pτ have the same interval μ2. For example, if only one pattern has a length of τ in τList, the pattern count |Pτ| is 1, whereas μ is obviously τ and δ1 is 0. If either δ1 or δ2 is equivalent to 0, or their values are small enough, we can merge them directly. Otherwise, the objects’ activities or their trajectory data are seriously distorted by noise.
Based on the analysis above, a simplified periodic pattern discovery algorithm-based literature 8 is described in Algorithm 3. The main steps of the periodic pattern discovery algorithm are as follows. (1) HRList generation: during this step, all hot regions are extracted from HRList (line 1). (2) Time instance querying: all time instances are selected and extracted according to the related hot regions (line 3). (3) Finding potential periods: the potential activity periods can be obtained by computing the time intervals of identical activities (lines 5–13). (4) Merging and filtering potential periods: trivial periods are merged into complete periods by computing the degree of noise distortion in periodic patterns (line 14).

With HRList, potential periods finding using periodic pattern discovery algorithm requires only one scan over the activity sequence. As the noise increases, perfect periodic patterns are distorted and interrupted. During periodicity checks, the degree of noise distortion is computed and patterns that are distorted by noise are either merged or discarded. Therefore, the time complexity of the periodic pattern discovery algorithm in common situations is O(nlogn).
Design of periodic pattern discover module
The class diagrams of periodic pattern discovery module are given in Figure 12. The entity of GridFactory is used to rasterize moving space into grid cells and density cells statistics. The input is clustering results, that means movement pattern. The entity of GridMerge is used to merge grid cells and describe movement activities from multi-granularity. The entity PeriodicMatching is used to find and valid periodic patterns.
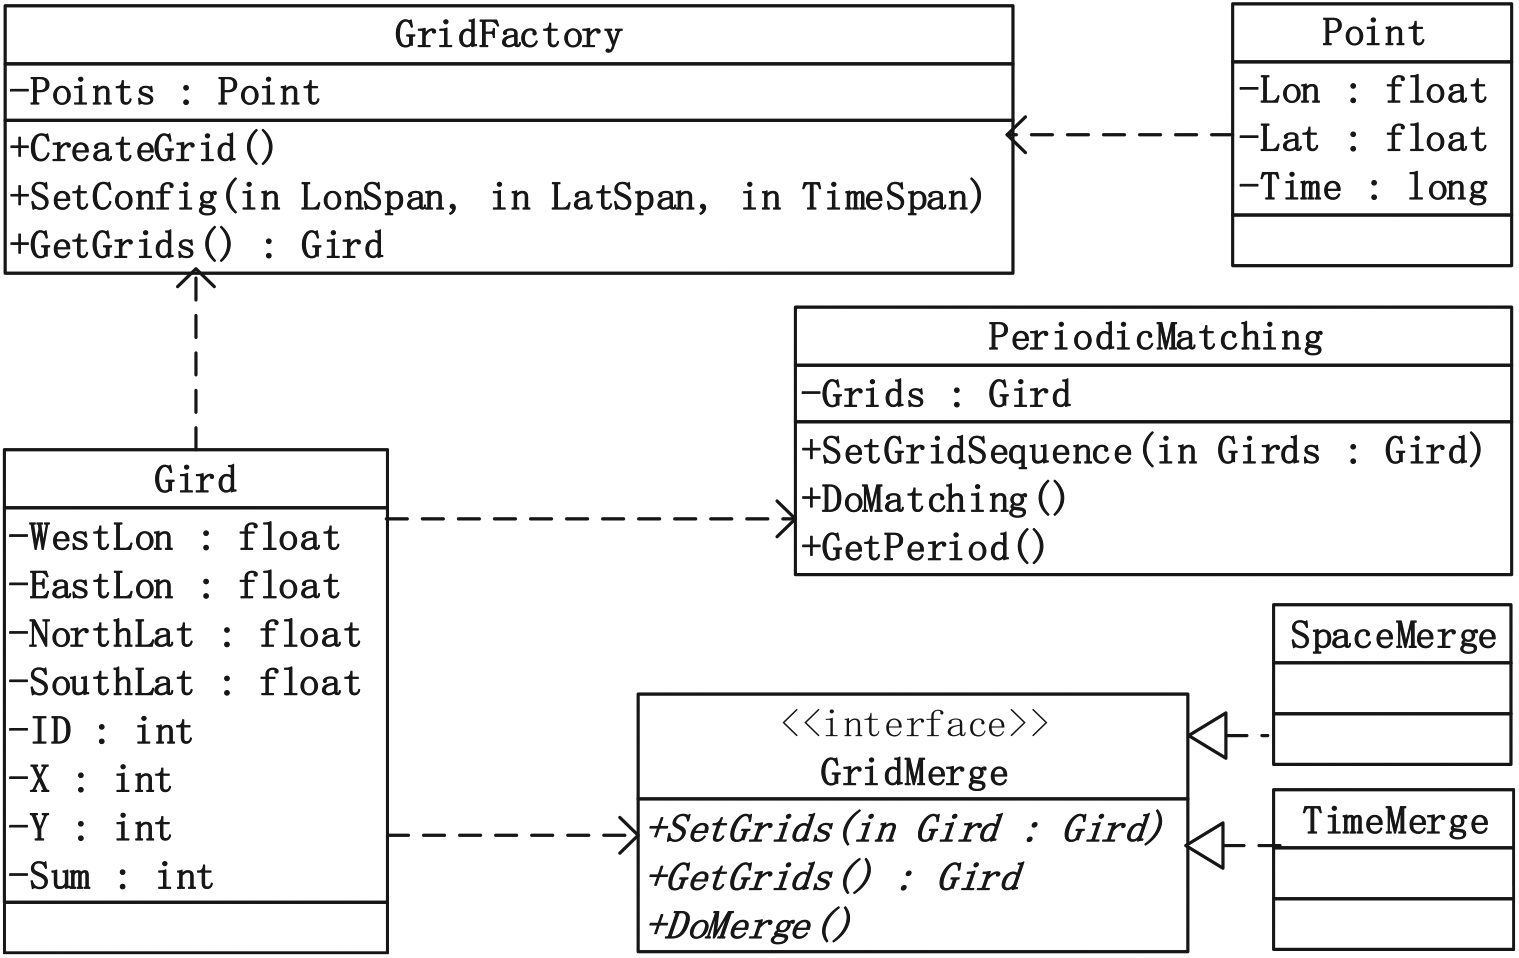
The class diagrams of periodic pattern discovery module.
Experiments and visualization
In this section, empirical studies are conducted systematically to validate APDS. Some visualization strategies are also given to demonstrate the results of APDS. The system is developed using MyEclipse Professional 2017 with the dependent environment of JDK1.7 and Tomcat 7.0. The system is running on Windows 7 with a Lenovo ThinkPad (Core i7 2.4 GB CPU with 8 GB RAM), and the trajectory data are stored in MySQL.
Data set
Taxi trajectory data set collected by Microsoft Research Asia is used to valid APDS, and it is generated by 33,000 taxis over a period of 3 months. The total distance of the data set is over 400 million kilometers, and the total number of GPS point reaches 790 million. The average sampling interval is 3.1 min and the average (Euclidian) distance between two consecutive points is about 600 m. 38 In this section, we use a subset of taxi trajectories that contains a 1-week trajectories of 10,357 taxis. The total number of points in this data set is about 15 million, and the total distance of the trajectories reaches 9 million kilometers.
System hierarchical structure
The overall architecture of APDS, shown in Figure 13, is designed based on MVC architecture with object-orientation. Combined with Baidu Maps API and ExtJS Class Library, the view layer (the visualization part) of APDS is implemented using Java Web page as the software interface.

Architecture of the proposed system.
Validation of trajectory clustering
In order to valid the clustering module, we use a subset of taxi trajectory. In this experiment, we divide the data set into two groups: Group A and Group B. Each group has about 10 min of trajectory data. With the specified parameter ε, the experiment results and analysis are given as follows.
Trajectory clustering parameters setting and effectiveness
After preprocessing, trajectory clustering module performs trajectory segmentation, micro-clustering analysis, and macro-cluster analysis on trajectory data. Figure 14 shows the experimental results of two groups with parameters setting given in Table 2. The clustering results of Group A with ε = 500, ε = 800, and ε = 1000 are given in Figure 14(a)–(c), respectively, whereas Figure 14(d)–(f) shows clustering results of Group B with ε = 500, ε = 800, and ε = 1000.

Experiment results of two groups: (a) ε = 500 (Group A), (b) ε = 800 (Group A), (c) ε = 1000 (Group A), (d) ε = 500 (Group B), (e) ε = 800 (Group B), and (f) ε = 1000 (Group B).
Experiment parameters setting.

As discussed above, ε is the neighbor threshold that shows how close two objects can be grouped into one cluster. When ε is set to a smaller value, trajectory segments closer to each other can be viewed as neighborhood, and it may lead quite numerous of clusters and small volume of each cluster. While ε is set to a larger one, which means trajectory segments in a wider region are viewed as neighborhood, and it may decrease the number of clusters and large volume of each cluster. In this experiments, the ε is set in meters. If ε is set to 500, that means trajectory segments in 500 m area are neighborhood. It can be seen from the representative lines of clusters in Figure 14, if, we can get more dense clusters with ε set to 500 and more sparse clusters with ε = 1000. Compared with the other two cases, when ε = 800, the distribution of clusters is more uniform. This is because trajectory clusters with this setting is more compact inside, and more independent outside, meanwhile the quality of trajectory clustering is higher. Figure 14(a) and (d) is both conducted with ε = 500. Because the total number of trajectories in Figure 14(d) is quite less than that of Figure 14(a), the clusters are of the former are also less than that of the latter.
Overall similarity
The performance of clustering algorithm can be evaluated based on whether the clusters are compact and independent. Therefore, the concept of Overall Similarity (OSim) 1 is introduced in this section. A high-quality cluster may have short internal average distance, large external average distance, and high overall similarity. The overall similarity is characterized by the intensity of trajectory segments in a cluster. Given a cluster Ci, Lx is the representative segment of Ci (Lx∈Ci), the similarity between Lx and Li is expressed by SSim(Lx, Li). Then, the overall similarity of Ci is given as formula (13)

If Ci has Ni segments. The overall similarity can be expressed as the average of the similarity between Lx and each segment Li. The overall similarity OSim of cluster set can be calculated by weighted average of overall similarity of each cluster, which given in formula (14)

where k is the number of clusters in the cluster set, N represents the total segments number, and
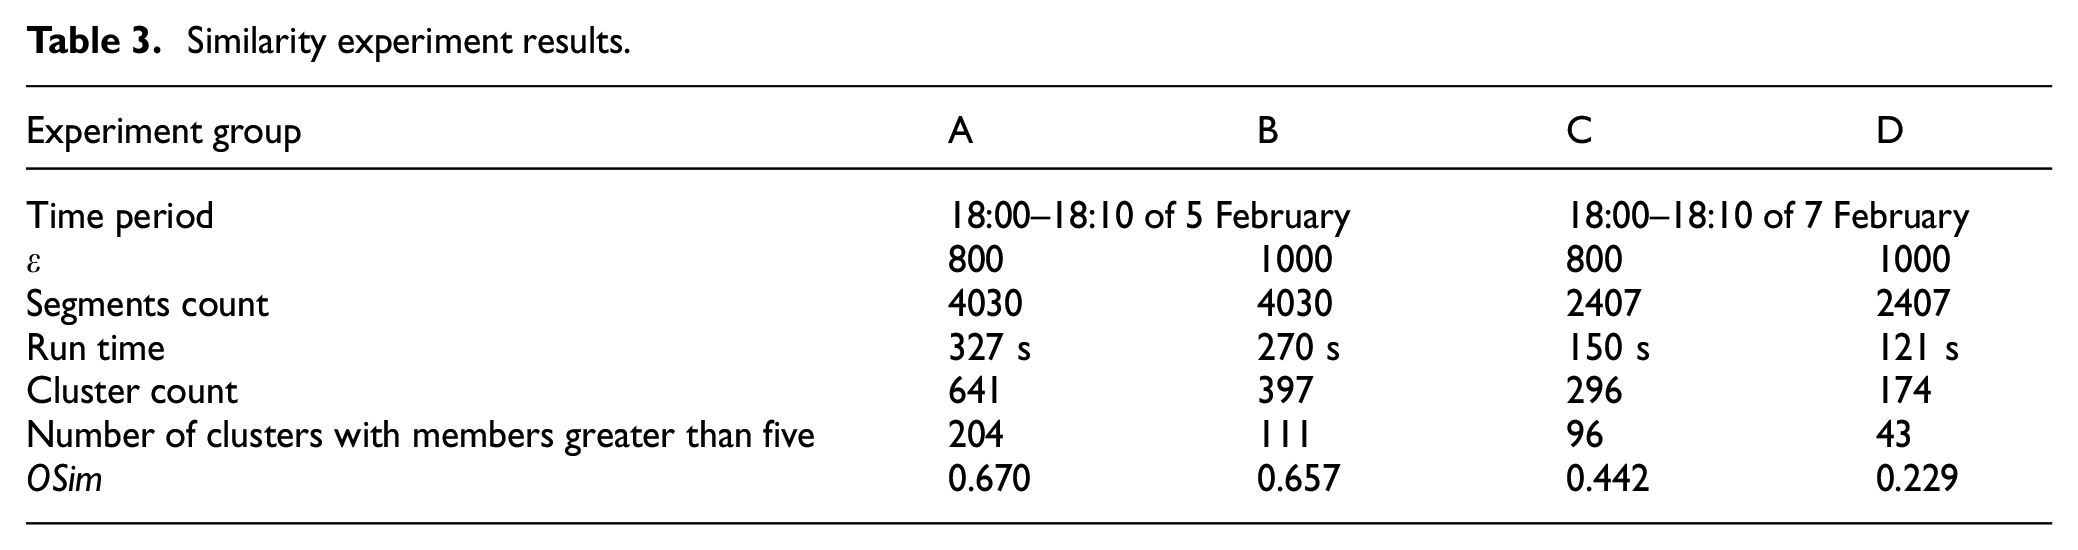
In this section, experiments are conducted with the parameters given in Table 3. During the given time periods, the number of clusters, the overall similarity (OSim) and the number of clusters with more than five trajectory segments are collected. As shown in Table 3, for the same geographical space, clusters with higher data density may generate higher overall similarity than those with lower density. For example, in each group of Table 3, the similarity of the clustering results of ε = 800 is greater than that of ε = 1000.
Similarity experiment results.
Validation of periodic pattern discovery
The size of the spatial granularity affects hotspot detection in the entire geospatial space directly. If a coarser spatial granularity is used for spatial meshing and then fewer hotspots can be found. Meanwhile, the more detailed distribution of moving objects will be lost, and the less accurate result may be. The temporal granularity also affects elements count in a hotspot directly. The fine time granularity can help to find short periods but reduce the probability of finding long periods.
Periodicity effectiveness
In this section, trajectory subset is partitioned into different time granularities, such as Hour, Day, and Week. The parameter settings and results of the experiments are given in Table 4.
Experiment parameters setting and results output.

These data are used in experiments A and B, from 2 February 2008 to 8 February 2008.
These data are used in experiments C and D, on 3 February 2008.
With given parameters in Table 4, we can obtain the results in Figure 15. The similarity threshold (δ) in Table 4 is used to describe how similar two hotspots are. This experiment includes four groups and is associated with four time granularities. δ is set to 0.8.

The hotspots distribution from 2 February 2008 to 8 February 2008: (a) 2 February 2008, (b) 3 February 2008, (c) 4 February 2008, (d) 5 February 2008, (e) 6 February 2008, (f) 7 February 2008, and (g) 8 February 2008.
The data of 3 February 2008 with time granularity of
Time efficiency
Experiments are run several times to verify the time efficiency of the algorithm. The parameter settings and the corresponding time efficiency are given in Table 5.
Experiment parameters setting for time efficiency validation.
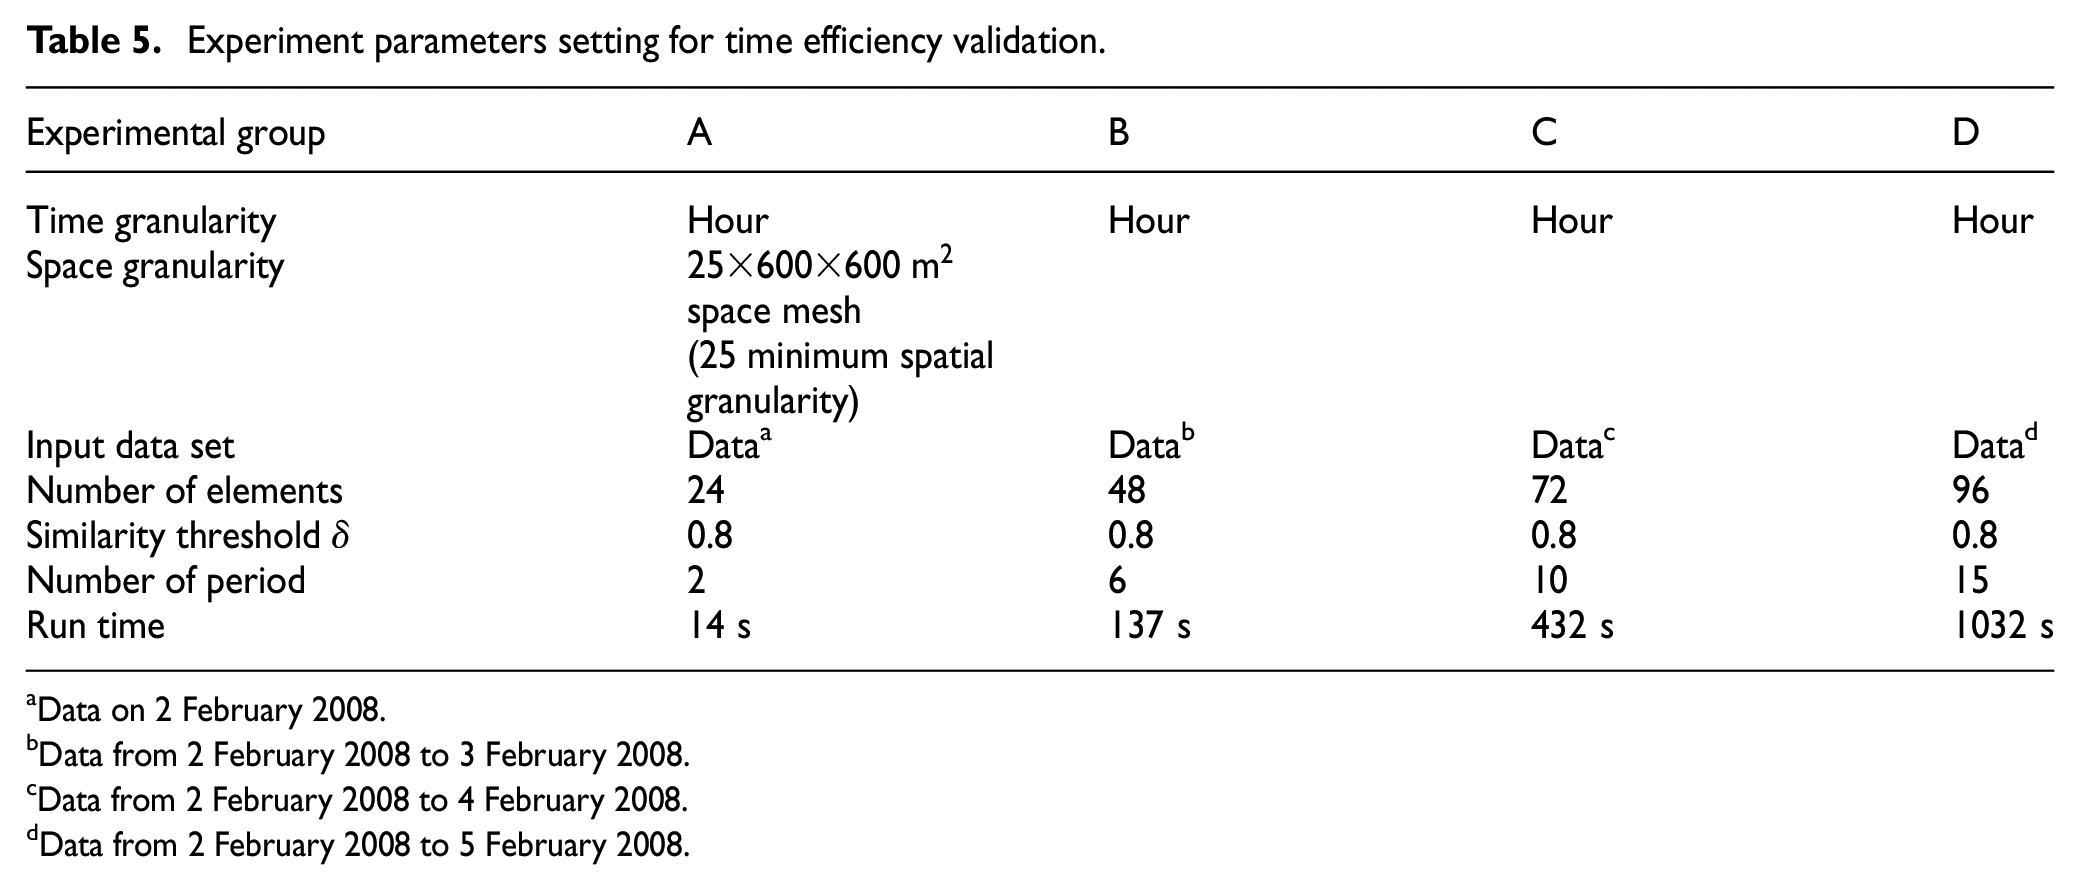
aData on 2 February 2008.
Data from 2 February 2008 to 3 February 2008.
Data from 2 February 2008 to 4 February 2008.
Data from 2 February 2008 to 5 February 2008.
As discussed above, the time complexity of clustering algorithm is O(n2), and the time complexity of the periodic pattern discovery algorithm is O(nlogn). Therefore, as the amount of data increases or the time granularity decreases, clustering phase is quite costly computationally and the execution time of the algorithm increases rapidly. For the large data set, the execution time may be unacceptable.
System visualization
System visualization is quite important for results demonstration and parameters interaction. There are two ways to implement visualization model. One is user interface development, such as Java, and the other is electronic map, such as Baidu Maps and Google Maps.
Trajectory preprocessing
Figure 16 shows sampling points in road network environment using Baidu API. Figure 16(a) shows the raw trajectory mapped to the roads. In Figure 16(b), the red dots indicate the original sampling point of the trajectory and the blue dots are trajectory mapped to roads. Figure 16(c) shows the corresponding trajectory after compression.

The display interface of APDS: (a) sampling points on Baidu Maps after preprocessing, (b) local trajectory before compression and (c) local trajectory after compression.
Trajectory clustering
The line segments of original trajectory and clusters are displayed in Figures 17 and 18. The two figures show the clustering results from both fine and coarse granularity. In both figures, the trajectories are partitioned within 10-min interval. Each line segment is direct connection from start point to end point. The clustering results with the form of representative segments from 12:00 to 12:10 on 5 February 2008 are displayed in Figure 18.

Trajectory segments from 12:00 to 12:10 on 5 February 2008: (a) total segments, (b) 50% of total segments, (c) 25% total segments, and (d) 10% of total segments.

The segments of clusters: (a) representative segments of clusters from 2:30 to 2:40 and (b) representative segments of clusters from 18:30 to 18:40.
Figure 18(a) shows the clustering-representative segments from 02:30 to 02:40 on 3 February 2008, and Figure 18(b) shows the clustering-representative segments from 18:30 to 18:40 on the same day. It can be seen that the number of segments in Figure 18(a) is less than that in Figure 18(b). That means quite many people leave their workplace at 18:30 to 18:40, while most people are working at 02:30 to 02:40 and few of them travel outside.
Trajectory periodic pattern discovery
In this part, periodic patterns are calculated based on the fine time granularity of 10 min. The statistical data of each grid displayed in the form of heat map represent the number of trajectories appearing in the geographical area. The red color indicates the most trajectories, while the light blue color indicates the least trajectories. Then, the fine time granularity trajectories are combined to calculate the periodic variation of the trajectory with each granularity, such as hour, day, and week. Figure 19 shows the trajectory variation from 21:30 to 21:40 between 4 February 2008 and 6 February 2008 with 10-min granularity.
Ten-minute trajectory volume: (a) 21:30–21:40 (4 February 2008) and (b) 21:30–21:40 (6 February 2008).
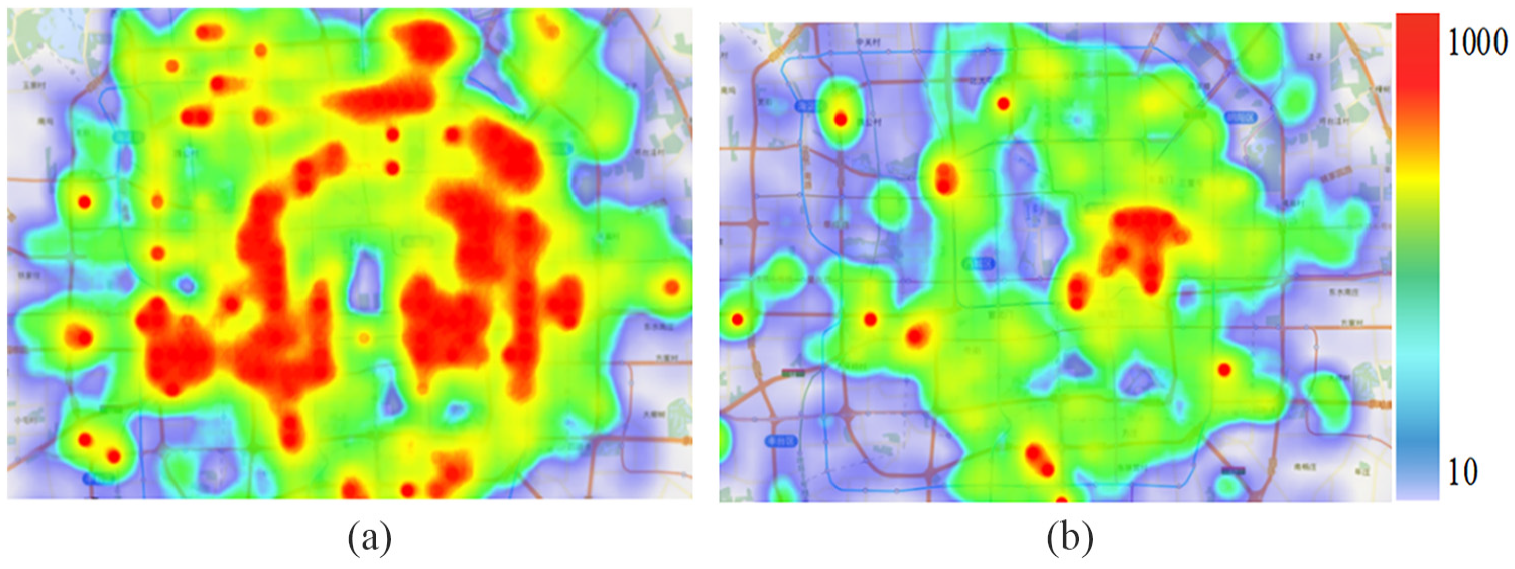
Figure 19(a) shows the trajectory of 10 min from 21:30 to 21:40 on 4 February 2008. Figure 19(b) shows the trajectory of the same time interval on 6 February 2008 (New Year’s Eve). Figure 20(a) shows the road trajectory of 1 h from 18:00 to 19:00 on 4 February 2008, and Figure 20(b) shows the road trajectory of the same time segment on 6 February 2008 (New Year’s Eve). Figure 20(c) shows the road trajectory of the whole day of 4 February 2008, and Figure 20(d) shows the road trajectory of the same time segment on 6 February 2008 (New Year’s Eve).

Trajectory hotspots: (a) 18:00–19:00(4 February 2008), (b) 18:00–19:00(6 February 2008), (c) whole day of 4 February 2008, and (d) whole day of 6 February 2008.
According to Figure 20, taxis hotspots are not the same. That depends on two aspects. One is the size of time granularity, 10 min or a whole day, and the other is the travel conditions, travel on holidays and workdays is obviously different.
Conclusion
An efficient moving object activity pattern discovery system is designed and implemented in this article. First, a comprehensive framework is given to design the components of trajectory patterns mining system. Second, main modules of the trajectory pattern discovery system are implemented in detail from both arithmetic and systematic views. Third, the system is validated and verified on real data set. Empirical studies demonstrate the effectiveness and efficiency of our system. Moreover, visualization strategies are introduced to show the results. As discussed in section “Related works,” moving object may include many kinds of patterns, such as frequent pattern, gather pattern, sequential pattern, swarm pattern, convoy pattern, and other patterns. These patterns are also very important for moving objects’ habits analysis. In the future work, more attention should be paid on designing efficient systems to analyze these patterns. Moreover, movement pattern discovery involves high computational cost, and how to enhance the efficiency of related algorithms is another important task.
Footnotes
Handling Editor: Rodolfo Meneguette
Declaration of conflicting interests
The author(s) declared no potential conflicts of interest with respect to the research, authorship, and/or publication of this article.
Funding
The author(s) disclosed receipt of the following financial support for the research, authorship, and/or publication of this article: This research was funded by the National Natural Science Foundation of China (grant number 71774159) and Fundamental Research Funds for the Central Universities of China (grant number 2015QNA38).