
Abstract
Electronic tongue-type sensor arrays are devices used to determine the quality of substances and seek to imitate the main components of the human sense of taste. For this purpose, an electronic tongue-based system makes use of sensors, data acquisition systems, and a pattern recognition system. Particularly, in the latter, machine learning techniques are useful in data analysis and have been used to solve classification and regression problems. However, one of the problems in the use of this kind of device is associated with the development of reliable pattern recognition algorithms and robust data analysis. In this sense, this work introduces a taste recognition methodology, which is composed of several steps including unfolding data, data normalization, principal component analysis for compressing the data, and classification through different machine learning models. The proposed methodology is tested using data from an electronic tongue with 13 different liquid substances; this electronic tongue uses multifrequency large amplitude pulse signal voltammetry. Results show that the methodology is able to perform the classification accurately and the best results are obtained when it includes the use of K-nearest neighbor machine in terms of accuracy compared with other kinds of machine learning approaches. Besides, the comparison to evaluate the methodology is made with different classification performance measures that show the behavior of the process in a single number.
Keywords
Introduction
A taste recognition system based on electronic tongues is used to identify, classify, and analyze qualitative and quantitatively mixtures of multiple components in liquids by applying the perspective of pattern recognition (PARC), that is, comparing the profiles of the mixture with a defined pattern. The analysis of the samples in liquid phase is carried out directly, while the samples in solid phase must be dissolved before being analyzed. 1 These sensors are characterized by low selectivity because they generate information in a wide range of different substances in a liquid mixture. The signal from the chemical sensors is transformed into a data matrix. The identification and classification are carried out in the stage of multivariate data analysis, which can be performed through statistical techniques using machine learning algorithms. 2
Through taste, it is possible to ensure the constant flavor of a product in a production process, that is, to know if the product is the same, if it is in good condition, or if any modification has occurred. For example, depending on the taste of the product, it can be determined if it is a good crop or not, discriminate between several types, detect if the product has defects, among other aspects. 3 Currently, this process is developed by a panel of highly trained people who make use of their sense of taste to certify the quality of the process.
In the food industry, the use of measuring instruments is a very important task in the development of new products, since it allows to implement or automate processes such as quality control, life control, degradation monitoring during transportation, highly perishable food monitoring, among others. The control of food products is normally carried out using physicochemical measurements, such as pH value, color, concentration of chemical substances, or biomolecules. 4 This is due to the lack of reliable instruments to evaluate the smell and taste of the products and the practical problems associated with the use of highly trained people, forming sensory panels for the continuous control of the aroma or flavor. Gas chromatography is another method used in the development of new products, but it is time-consuming and expensive, which in many cases discourages companies from using it. 5
Data analysis in an electronic tongue can be performed from the point of view of chemometrics, which is a discipline of chemistry that uses mathematics, statistics, and formal logic to provide relevant information by analyzing chemical data. 6 Regarding the analysis by PARC, the approach is oriented to the use of data and the definition of a pattern to compare and thus obtain relevant information about the monitored process. Currently, this approach along with the use of chemometric techniques are used for analyzing data from electronic tongues. These techniques are schematized in Figure 1. According to Oliveri et al., 7 the three possible results obtained by analyzing a data set are as follows: (1) recognition of the presence of structures (groupings, correlation) between the objects and/or variables studied (exploratory, unsupervised analysis); (2) development of mathematical models for the prediction of qualitative responses (classification and analysis of class models, supervised); (3) development of mathematical models for the prediction of quantitative responses (regression analysis, supervised).

Main steps of the pattern recognition process.
The study by Śliwińska et al. 2 shows an exhaustive compilation of more than 75 publications related to electronic tongues, where the application, the type of analyte, the research object, the type of sensor, and the method for data analysis are distinguished. This work allows us to conclude that the principal component analysis (PCA) is one of the most used techniques by the scientific community to analyze the data coming from nonspecific sensor arrays (“electronic tongue”) for chemical analysis of liquids.
In 2010, Oliveri et al. 7 performed a study using the SciFinder Scholar database, which indicated that the majority of signal processing works of electronic tongue-type sensors mostly uses the PCA in the feature extraction stage; artificial neural networks (ANNs) for classification stage; and partial least squares (PLS) regression for the regression stage. This can also be evidenced in the study by Del Valle 8 in 2017. Therefore, there is an opportunity to explore different ways to use these well-known strategies or new possibilities using different techniques for multivariate data analysis in this type of sensors.
Different researches related to classification problems in sensor arrays have been produced in recent years; among them are in 2014, the study by Zhang and Tian 9 combines the nonlinear method of the feature extracting kernel PCA with a new discriminant analysis (NDA) framework, which, through the construction of a Laplacian dispersion matrix between classes and a Laplacian dispersion matrix within the classes, solve an optimization problem. It makes samples between classes more separable and samples within classes are more compactable, thus improving the process of reducing the dimensionality of the data to in turn enhance the results of the classification algorithm. As a main result, the new kernel PCA plus NDA (KNDA) method achieved the same accuracy of the kernel support vector machine (KSVM) method with 95.06%; however, when comparing the running time of KNDA algorithms, it was 18 times faster than KSVM.
In 2018, the study by Zhang et al. 10 shows an electronic tongue data processing methodology that comprises the following stages: it starts with filter and feature selection via sliding window–based smooth filter, later a stage of feature extraction with the local discriminant preservation projection (LDPP) algorithm to finally compare different classifier algorithms like support vector machines (SVMs), extreme learning machines (ELMs), and kernelized extreme learning machine (KELM). The process was validated using the fivefold cross-validation technique, achieving the best average accuracy of 98.22% for the KELM algorithm. Besides, computational time studies were carried out comparing KELM, ELM, and SVM classification algorithms concluding that the KELM algorithm was the fastest of all.
The book by Zhang et al. 11 becomes the first one that deals with the problems of electronic noses from the point of view of algorithms and divides them into four main challenges: (1) the algorithmic challenge in PARC and machine learning including the odor recognition algorithms and concentration estimation algorithms, (2) the sensor drift problem, (3) the disturbance issue, and (4) the discreteness issue. The solutions to these problems make possible even more the real application of the sensor arrays at the industrial level, making them more robust and improving their accuracy.
As a contribution, this work presents a taste recognition methodology that uses data from a sensor array to classify different substances. The methodology is validated with a public data set from a multifrequency large amplitude pulse voltammetry (MLAPV) electronic tongue. The remainder of this article is organized as follows. Section “Theoretical background” briefly describes the most relevant concepts of the methods used in the proposed methodology. Section “Artificial taste recognition methodology” is devoted to present the different stages that compose the developed methodology. Section “Data set for validation” introduces the MLAPV electronic tongue data set used to validate the methodology. Then, section “Experimental results and discussion” identifies the effectiveness of the proposed methodology. Finally, the “Conclusion” section outlines the main conclusions of this article.
Theoretical background
This section includes information about the methods that will be used in the taste recognition methodology. It is recommended to review the cited works in this section in order to expand the information about each method.
Electronic tongue-type sensor arrays
According to the International Union of Pure and Applied Chemistry (IUPAC) definition, 12 an Electronic Tongue is “a multisensor system, which consists of a number of low-selective sensors and uses advanced mathematical procedures for signal processing based on PARC and/or multivariate data analysis (ANNs, PCA, etc.).” The main parts of an electronic tongue system are illustrated in Figure 2; in general, first an array of sensors is located at an electrochemical cell to produce the electronic tongue sensor which is the element introduced in the liquid substance, and then the electrical signals produced by these kinds of sensors are acquired by a data acquisition module that control the electrochemical technique to send the results signals toward a computer or a processor-based system that performs the signal processing and PARC stage in order to produce the analysis of the data.

Electronic tongue system.
There are mainly two types of electronic tongue systems which are distinguished between them by the nature of the electrochemical sensors. First, systems are potentiometric when an ion-selective electrode (ISE) array is used. Second, systems are voltammetric when a number of metal electrodes of different nature or a number of modified electrodes are used. When both types of sensors compose an electronic tongue, it is called a hybrid electronic tongue. 8 For further information about potentiometric electronic tongues, the authors recommend the detailed review of Bratov et al., 13 as well as the work by Wei et al., 14 for voltammetric electronic tongues. The type of electrochemical sensor for this work was selected according to the substance that is to be detected. In this case, different substances are classified using a matrix of non-selective sensors, composed of noble metal electrodes, to use voltammetric techniques
MLAPV
One of the first voltammetric techniques used to analyze signals coming from electronic tongue-type sensor arrays is the large amplitude pulse voltammetry (LAPV). Pulse voltammetry is of special interest due to its advantage of greater sensitivity and resolution. 15 Subsequently, the MLAPV technique was used, which is a pulse voltammetry composed of a series of individual waveforms of LAPV with different step lengths. 16 Each cycle of the potential pulse step starts from the transient state of reaction process of the last cycle step, so that extra information is obtained by the MLAPV. 14 The MLAPV family includes multifrequency hackle pulse voltammetry (MHPV), multifrequency rectangle pulse voltammetry (MRPV), and multifrequency staircase pulse voltammetry (MSPV). As an example, the MSPV is proved to be the best waveform for classifying different yogurts. 17
In 2018, the study by Zhang et al. 10 showed an electronic tongue based on an MLAPV technique. This electronic tongue followed the electrodes setup of Tian et al. 16 In the e-tongue, five electrodes, made of gold, platinum, palladium, tungsten, and silver, were chosen as working electrodes, whose responses are illustrated in Figure 3. The materials (Au, Pt, Pd, W, Ag) have been used in previous electronic tongues.16,17 The pillar platinum is used as the auxiliary electrode and the Ag/AgCl is used as the reference electrode. Their experiments indicate that the electrodes sensor array shows different patterns to different kinds of substances in the electrochemical cell, which preliminarily shows the feasibility of the e-tongue. Further details of the data set used to evaluate the current taste recognition methodology will be presented in the data set for validation section.

Data collection process: top: electrochemical cell containing the electrodes in the sensor array-type electronic tongue; bottom: three-dimensional matrix
Preprocessing
An important step for multivariate data analysis is data preprocessing. It is used to reduce random sources of variation in the data set. Some of the principal preprocessing techniques are centering of the average and autoscale. However, the use of these techniques can generate results with different possible forms of interpretation. In this sense, regarding the use of chemometric tools, the sequential publications of some authors have evidenced the lack of study in the previous treatment of the data, that is, only one method is used and then results are discussed. To identify the best preprocessing method, it is advisable to try at least three different approaches (i.e. centering the average, autoscaling, smoothing, among others), compare results and choose the option that best suits the objectives of the work. 18
Data preprocessing involves techniques that transform a data set to provide better input to the PARC engines. 19 In 2010, Palit et al. 20 studied the influence of several mathematical techniques for preprocessing multivariate data obtained from an array of electronic tongue-type sensors. To select the appropriate preprocessing technique, it is important to determine the effectiveness of these techniques in terms of the measure of the separability of the groups and the accuracy of the classification of the pattern in each case. The new data set is, therefore, a better substitute for the former in terms of data analysis. Palit et al. applied a cluster separability criterion for two analyses: one to determine the optimal level of wavelet decomposition and the other to find the best preprocessing method. The performance and separability of the different preprocessing techniques were compared using the class separability measure without compressing the data. The level of decomposition had been chosen based on two parameters: (1) percentage of accurate classification rate and (2) cluster separability criterion. They observed that selecting the appropriate preprocessing technique resulted in the improvement of the separability criterion. The preprocessing techniques that show the highest separability measure were combined to obtain a technique that produces an even better separability measurement. 21 In our work, group scaling normalization is used. This method will be further explained in this section.
Data compression
The treatment of signals of sensors arrays that uses voltammetric electronic tongues requires preprocessing techniques for data reduction due to the size of the information. Some of these methods are PCA, the discrete Fourier transform (DFT), or the wavelet transform (WT). They allow to obtain advantages over time of training, avoid redundancy, and obtain a model with better generalization capacity. Preprocessing provides an accurate interpretation of data from a data set. 22
Voltammetric signals contain hundreds of measurements and usually have overlapping regions with non-stationary characteristics. 23 Therefore, the objective of feature extraction is to fully exploit the information obtained from each sensor. To achieve this objective, some representative characteristics must be extracted from the data obtained by each sensor of the matrix. 24 The artificial taste recognition methodology uses information from the MLAPV electrochemical technique, which relates the variables of current versus time; this technique was first shown by Tian et al., 16 for be used in electronic tongue-type sensor arrays. Particularly, in Tian et al.’s 16 work, PCA, a kind of multivariate data analysis, was used for processing the data from the electronic tongue. six Chinese distilled spirits and seven Longjing teas were analyzed by the electronic tongue based on MLAPV and were successfully discriminated by the working electrodes at different frequency segments using the PCA algorithm.
Another electronic tongue study using pulse voltammetry was developed in 2013 by Wei et al. 17 The voltammetric electronic tongue based on MSPV with PCA presented the best separation ability in classifying the six categories of set yogurt. The separation ability of voltammetric electronic tongue based on the classification data set was presented by PCA. These two works showed that PCA has a successful behavior when it was applied in electronic tongues with pulse voltammetry.
In 2018, Zhang et al. 10 conducted a research, where they showed that due to the noise of the system and a variety of environmental conditions, the data acquired by an electronic tongue show inseparable patterns. To solve this phenomenon, from the point of view of the algorithm, they proposed an LDPP model. The LDPP algorithm of dimensionality reduction and feature extraction is a poorly studied subspace learning algorithm, which refers to local discrimination and the preservation of neighborhood structure. Other applications of subspace learning algorithms can be highlighted for transferring odor recognition model, such as cross-domain discriminative subspace learning (CDSL). 25
PCA
The PCA analyzes a data set that represents observations described by several dependent variables, which are, in general, interrelated. Its objective is to extract important information from the data table and express this information as a set of new orthogonal variables called principal components (PCs). 26 The objectives of PCA are (1) to extract the most important information from the data table, (b) to compress the size of the data set keeping only important information, (c) to simplify the description of the data set, and (d) to analyze the structure of the observations and the variables.
It is quite common to use PCA as a preprocessing step in order to get a nice compact representation of a data set. Instead of the original many (J) variables, the data set can be expressed in terms of the few PCs. 27 Scores can be used to build a classification model, although there is a risk that the components that could help to improve the classification are excluded. It will often make more sense to use the number of components that provide the best classification results given by an appropriate metric if PCA is used in conjunction with a classification model such as K-nearest neighbor (KNN). 27
Multiway principal component analysis (MPCA) is a conventional PCA extension for managing data in multidimensional arrays. A typical two-dimensional (2D) data matrix can be considered as a matrix with experiments and variables. For the application described in this article, it is necessary to extend this scheme to multiway matrices, since the electronic tongue needs different experimental tests, and several sensors measuring at different instants of time. MPCA is equivalent to performing a normal PCA for an unfolded version of the original multiway array. 28
Organization of the recorded data
In an MLAPV electronic tongue, the measures are currents, and the measurements of only one sensor in a given number of moments of discretization are repeated several times (experimental tests), considering that each measurement is an individual experiment in the data set. The collected data are ordered as follows 28
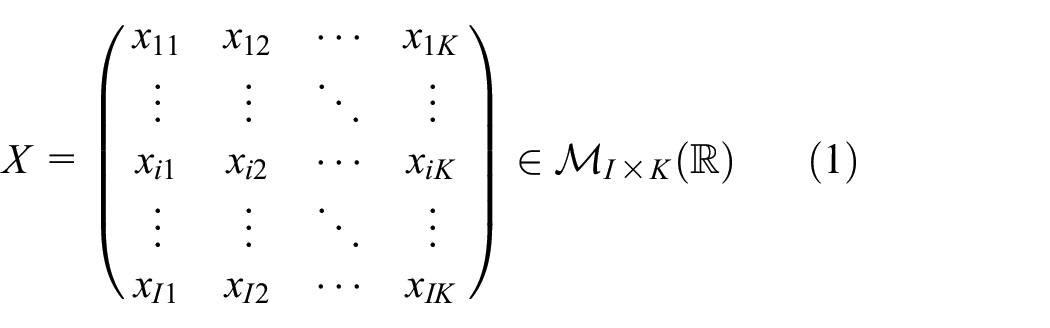
This matrix
Considering that in the case of electronic tongue, an array of sensors is used,
Matrix unfolding
Westerhuis et al.
29
describe six different ways of unfolding this three-way matrix

Matrix
Group scaling
The data of sensor array come from several sensors and these measures could have different magnitudes. It is necessary to highlight that the PCA is not invariant to scale; thus, the data must be rescaled applying a preprocessing stage.
For this preprocessing stage, group scaling normalization was selected. Comparable to autoscaling, group scaling, also called variable scaling, is performed according to standard deviations. Group scaling is frequently used when the data have several blocks of equal variables. Each block comprises variables in some given units of measure, but different blocks use different units. This type of situation occurs in the MPCA. Particularly, in this case, each block represents the information obtained by a single sensor. 33 In this type of unfolding matrices, group scaling presents better performance than other kinds of normalizations. The reason is that group scaling considers changes between sensors and does not process them independently.30,34
In group scaling, the variables are divided into a predefined number of blocks of equal size and each block is scaled by the large mean of their standard deviations. For each block, the standard deviations of each variable in a block are calculated and the average of these standard deviations is used to scale all the columns of the block. The same procedure is repeated for each block of variables.
33
In this sense, for t = 1,…,


where

The scaled matrix

where

and the diagonal terms of matrix

matrix

Classification approaches
The dimensionality of the pattern for an electrochemical sensor array is considerably small, usually ranging from 3 to 16, which reduces the calculation load in the classification algorithm. 36 In addition, for the implementation of a portable sensor system, the algorithm must be transferable to an electronic system. Therefore, many of the accepted practices for the recognition of patterns in general may not be relevant for the recognition of patterns of chemical sensor matrices. From the types of environments and situations in which the chemical sensor arrays are expected to work, Shaffer et al. 36 highlight six qualities that the ideal PARC algorithm must have in an array of chemical sensors: (1) high precision, (2) quick, (3) simple to train, (4) low memory requirements, (5) robust to the outliers, and (6) produce a measure of uncertainty.
In 2018, Wesoły and Ciosek-Skibińska 37 affirm that as far as they know, such a profound study has not been presented previously on the chemometric treatment of sensor responses for taste discrimination using an electronic tongue. For the most commonly applied data extraction, the best classification results were obtained using SVM-DA and PCA + back propagation neural network (BPNN), while principal component regression (PCR) and KNN provided the worst results. Their paper concludes that it is not feasible to develop a universal methodology for the analysis of data from an electronic tongue, but some general recommendations can be provided based on the results obtained.
In this work, six machine learning algorithms will be used to perform the classification process: KNN, linear discriminant analysis (LDA), classification trees, Naive Bayes (NB), random forest (RF), and SVMs. The KNN algorithm 38 or KNN is a non-parametric supervised classification system based on neighborhood criteria. In particular, KNN is based on the idea that the new samples will be classified into the class of the closest number of closest neighbors of the closest training set. 39
LDA 40 fits a parametric model to the training data and interpolates to classify test data. It assumes that different classes generate data based on different Gaussian distributions. To train a classifier, the fitting function estimates the parameters of a Gaussian distribution for each class. To predict the classes of new data, the trained classifier finds the class with the smallest misclassification cost. 41 LDA is based on the estimation of multivariate probability density functions, which are entirely described by a minimum number of parameters (means, variances, and covariances), as in the case of the well-known univariate normal distribution. 7
Classification and regression tree (CART) 42 is a non-parametric supervised classification method that predicts responses to data. To predict a response, it follows the decisions in the tree from the root node (beginning) to a leaf node that contains the response. Classification trees give nominal responses, such as “true” or “false.” 41 Trees are grown to a maximal size without the use of a stopping rule and then pruned back (basically split by split) to the root via cost-complexity pruning. The next split to be pruned is the one that contributes the least to the overall performance of the tree in training data. The CART mechanism is intended to produce not one, but a sequence of nested pruned trees, all of which are candidate optimal trees. The right sized tree is identified by evaluating the predictive performance of every tree in the pruning sequence. 39
NB is a parametric classification approach designed for using when predictors are independent of one another within each class. It appears to work well in practice even when that independence assumption is not valid. It classifies data in two steps. First, the training step using the training data, that is, the method estimates the parameters of a probability distribution, assuming predictors are conditionally independent given the class. Second, the prediction step, that is, for any unseen test data, the method computes the posterior probability of that sample belonging to each class. The method then classifies the test data according to the largest posterior probability. 41
RF is a PARC method and it has been proposed by Breiman. 43 RF is a method based on a kind of learning strategy “ensemble learning” with generating many classifiers and aggregating their results. RF operates by constructing a multitude of decision trees at training time and outputting the class that is the mode of the classes of the individual trees. 44
SVMs 45 are supervised learning models with associated learning algorithms that analyze data used for classification and regression analysis. SVM offers one of the most robust and accurate methods among all well-known algorithms. 39 In addition to performing linear classification, SVMs can achieve a nonlinear classification using the kernel trick, implicitly mapping their inputs into high dimensional feature spaces. Multiclass SVM purposes to assign labels to instances using SVMs, where the labels are drawn from a finite set of several elements. The main approach for doing so is to reduce the single multiclass problem into multiple binary classification problems. 46 Common approaches for such reduction include building binary classifiers that discriminate between one of the labels and the rest (one-versus-all) or between every pair of classes (one-versus-one).
The parameters used in each of the classifiers were those found by default in MATLAB. For KNN, the number of neighbors was set to one, converting it into fine KNN, also using a Euclidean distance. For LDA, a type of linear discriminant is used and normal distributions are used for NB.
Artificial taste recognition methodology
The artificial taste recognition methodology developed in this work consists of the reunion of different stages of signal processing and PARC; all the steps are based on the use of different well-known methods in the literature. As described before, the first step unfolds the data and defines a new 2D matrix. Consequently, in the second step, data will be normalized using the group scaling method. The third step is the dimensionality reduction process executed by PCA, in which the size of the data is decreased to a new matrix
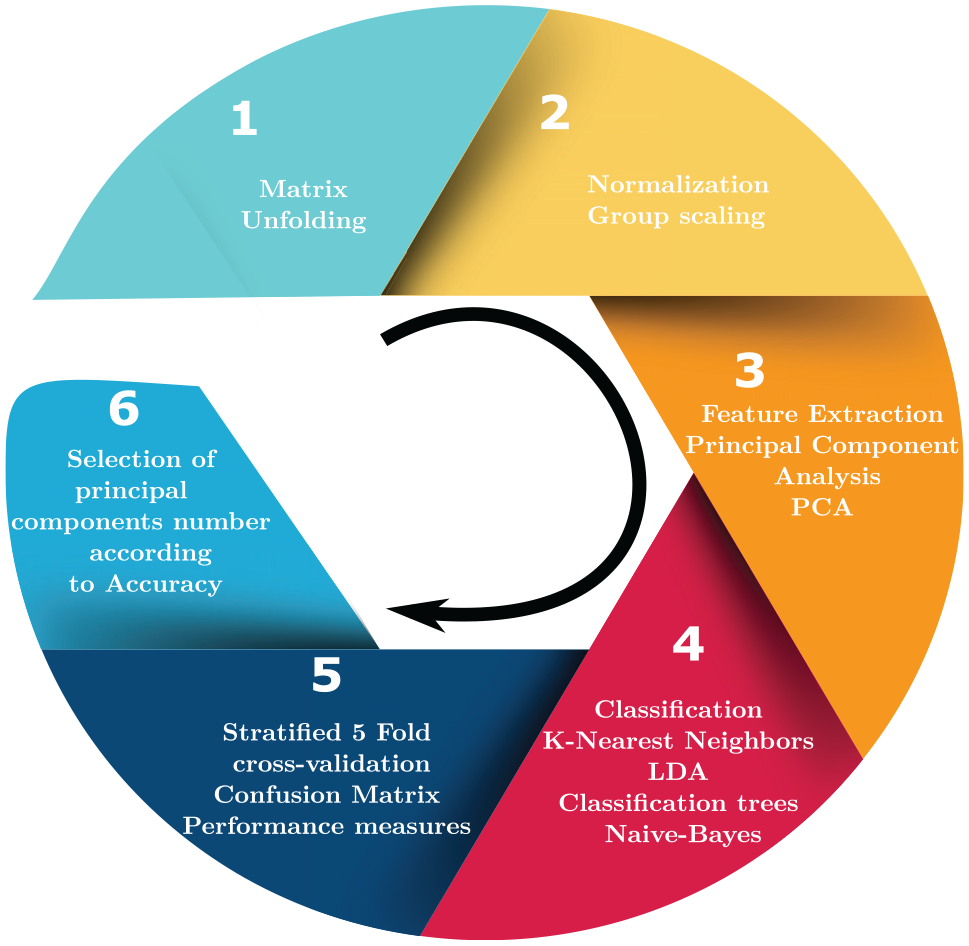
Main steps of the taste recognition methodology.
Stratified fivefold cross-validation
Stratification seeks an intelligent grouping of the elements that constitute the population of a certain subset. When a data set is divided into homogeneous groups using stratification, an exchange of elements between these groups will occur in order to make a heterogeneous distribution. For a small group of samples and with a high number of classes, the use of stratification is indispensable, as with the current data set.
Breiman et al. 42 propose the K-fold cross-validation method as fold or iterations, where the original sample set is divided into K subsets. Since data are often scarce, this is usually not possible. For this reason, this variant of the cross-validation uses part of the available data to adjust the model, and a different part to verify it. This technique is considered a reliable media that offers good complexity in real time. The model, by repeating the training process, produces a resulting percentage of success that is used as a measure of the goodness of the evaluated algorithm. The stratified fivefold cross-validation 47 is used to evaluate the classification results performed for the machine learning algorithms in the current methodology of taste recognition.
Performance measures
The overall classification performance of the taste recognition methodology is stated from different metrics represented by a single number. In the literature, among the different metrics to measure the goodness of classification, accuracy is one of the best knowns. However, after performing the K-fold cross-validation process, the taste recognition methodology results in a confusion matrix that encodes the number of both correct and incorrect predictions for each class.
From the analysis of the confusion matrix, three different measures are defined: sensitivity, specificity, and precision. These measures describe the classification results achieved in each class and it is incorrect to take them into account individually to evaluate in a general way the classification performance of a model. Each of these three measures provides an index that relates the true positive (TP), true negative (TN), false negative (FN), and false positive (FP) cases. The classification quality must be evaluated holistically grouping all these measures. 48
The global classification indexes can be useful when the evaluation of the model must be represented in a single numerical value, as in the case of this work, to determine the optimal number of main components that yield the maximum accuracy in the classification. Global classification measures may behave differently when dealing with unbalanced data sets, whose classes contain a significantly different number of samples. 49 Recalling the properties of the data set that evaluates this methodology of taste recognition, there are 13 different classes whose number of samples varies from beer with 19 samples to salt with 6 samples. In this taste recognition methodology, some measures described in the study by Ballabio et al., 48 will be used to evaluate the classification performance. The measures and a brief description of each one of them are included in Table 1. For further information about each measure, see the work by Ballabio et al. 48
Classification performance measures.

ROC: receiver operating characteristic.
Data set for validation
In the study by Zhang et al., 10 an electronic tongue based on an array of five different sensors applies the technique of MLAPV. The pulse signal (excitation) comprises three individual frequencies: 1, 3, and 5 Hz, and five amplitudes of voltage: 4.10, 3.85, 3.60, 3.35, and 3.10 V for each frequency. After applying the described potential, each working electrode measures a responding current. The multiple frequency pulse signal and its response are shown in Figure 5.

Multifrequency large amplitude pulse voltammetry: (a) applied potential and (b) responding current of one working electrode.
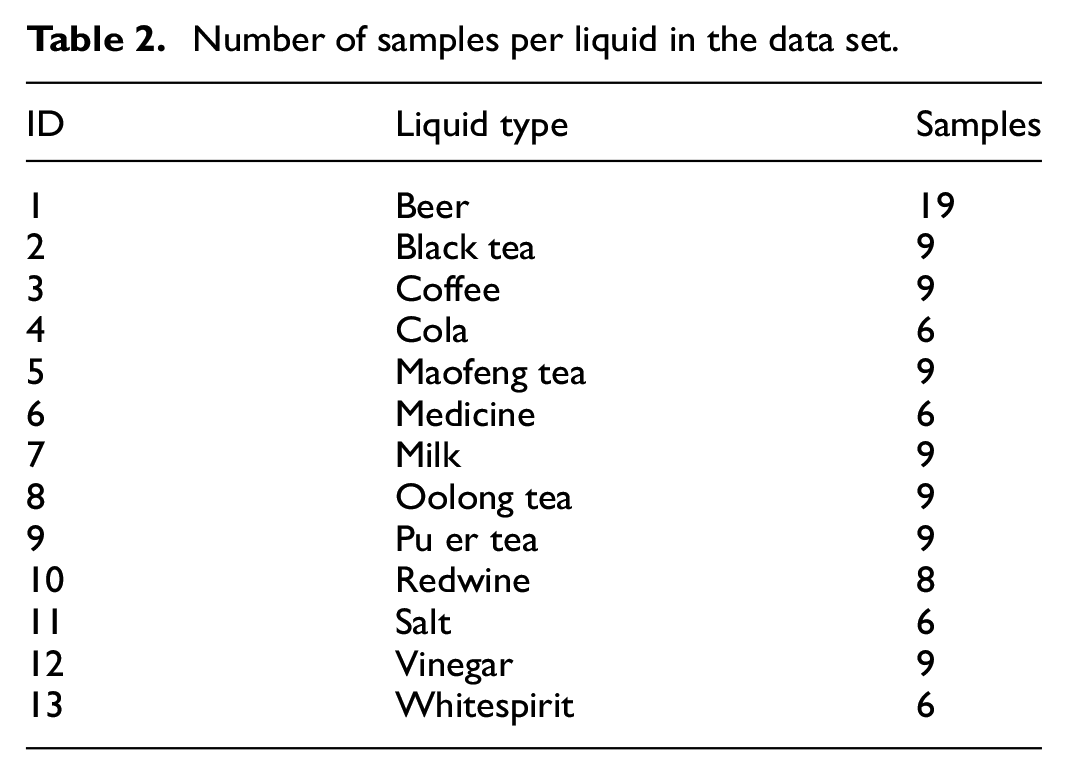
The proposed methodology is validated using a public data set published in the study by Zhang et al. 10 The data set contains 114 measurements from five chemical sensors of E-Tongue based on MLAPV in a discrimination task of 13 liquid samples at various levels of concentrations. The data set contains samples of liquid substances, such as beer, red wine, white alcohol, black tea, Maofeng tea, pu-erh tea, Oolong tea, coffee, milk, cola, vinegar, medicine, and salt. The number of samples per liquid is provided in Table 2.
Number of samples per liquid in the data set.
The system used for measuring the data set contains five electrode sensors, and the response of each sensor has 2050 sampling points. Each sample includes data points; thus, it has 114 instances and 10,250 attributes. The electrode from the first to the fifth row in each sample denotes the gold, platinum, palladium, tungsten, and silver electrodes, respectively. Figure 6 shows the response of the five electrodes in 10,250 sampling times as an example of how the signals of each sensor are arranged one after another, as described in the unfolding section.

MLAPV signals of each electrode arranged one after another.
Experimental results and discussion
Figure 7 includes a resume of the steps followed by the proposed methodology. It starts with the data unfolding for each substance from different sensors. Afterward, unfolded data are normalized by group scaling and data reduction is performed using PCA to obtain the components and define the PCA modeling or pattern. As a result, it is possible to plot the first two components, as shown in Figure 8.

Experimental setup of the taste recognition methodology.

PCA with the first two PCs, the caption is ordered according to Table 2.
Figure 8 shows the PCA score plot of the first two PCs, where some classes overlap close to the coordinate (1,0), evidencing the need for using a machine learning approach for the classification. The next step of the taste recognition methodology is to organize a group of PCs to create a featured vector, which is used as input in the machine learning algorithms for classification. The resulting featured matrix is formed by the projections or scores of the original data into the PCA model created, as described in the PCA section and illustrated in Figure 7.
The study by Zhang et al. 10 uses LDPP, which is a subspace learning method, as feature extraction. In contrast, this work uses PCA. Another difference is that the current taste recognition methodology does not use the sliding window–based smooth filter for denoising, thus the feature selection stage is avoided.
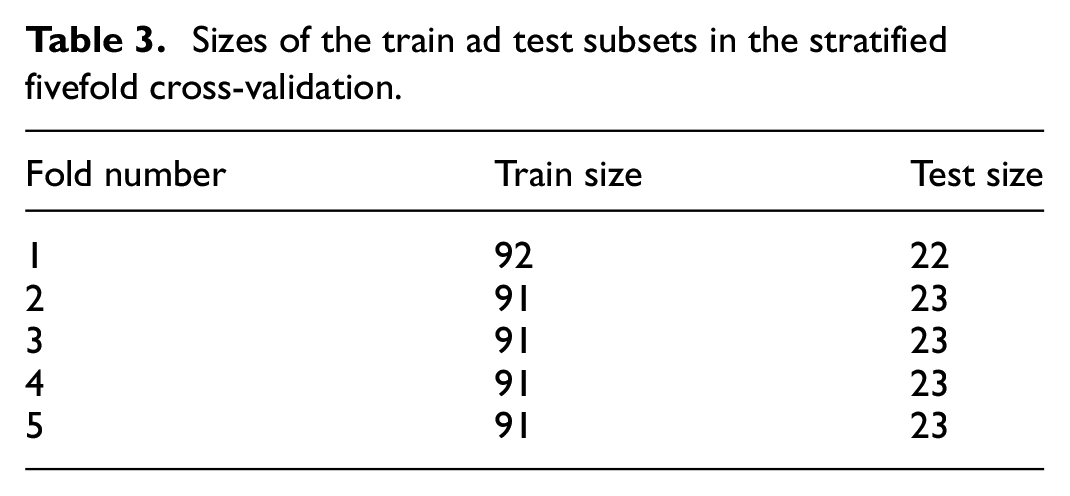
The stratified K-fold cross-validation allows to evaluate the classification process. In the current methodology of taste recognition, stratified fivefold cross-validation is used. It evaluates five times the data set of 114 measurements. This is done by randomly partitioning the data set and using a subset to train the algorithm and the remaining data for testing. As cross-validation does not use all the data to build a model, it is a commonly used method to prevent overfitting during training. The training set is then used to train a supervised learning algorithm, and the testing set is used to evaluate its performance. 41 This process is repeated several times and the average cross-validation error is used as a performance indicator. Specifically, the data set of 114 number of observations is divided into 80% for train subset and the remaining 20% for the test subset. In particular, the sizes of the fivefold groups are shown in Table 3.
Sizes of the train ad test subsets in the stratified fivefold cross-validation.
The fine tuning of the KNN algorithm is done by finding the best K-hyperparameter of the classification model. For this purpose, the parameter K was varied in a range of 1–15. Figure 9 indicates that the best value for K (number of neighbors) was 1, since it yields the highest value of accuracy when using the first eight PCs.

Fine tuning of K-hyperparameter of the KNN classification algorithm.
From previous works that use PCA,30,35 the influence of the number of scores is well known on the analysis of data. The reason is that the variability of the data cannot be concentrated in the first components. Figure 10 shows the percentage of cumulative variance for the first eight components. To validate the influence of the number of components, this number will be varied for the classification. In general, the number of scores that has to be used depends on the cumulative contribution of variance that it is accounted for. More precisely, if the ith score is related to the eigenvector

where

Percentage of cumulative variance of the first eight principal components.
Figure 11 shows the confusion matrix obtained after the classification process made by KNN, where only the first two scores are used in the training process. Data shown in Table 4 corresponds to the performance measures of the confusion matrix illustrated in Figure 11. The best results obtained were those of the KNN classifier compared with NB, C trees, LDA, SVM, and RF.

Confusion matrix results of KNN classification considering two components.
Performance measures of the classification models considering two components.

KNN: K-nearest neighbor; NB: Naive Bayes; LDA: linear discriminant analysis; SVM: support vector machine; RF: random forest; NER: non-error rate; EMCC: extended Matthew correlation coefficient.
Figure 12 shows the confusion matrix obtained after the classification process made by KNN, where the first three scores are used in the training process. Data shown in Table 5 corresponds to the performance measures of the confusion matrix illustrated in Figure 12. The best results obtained were those of the KNN classifier compared with NB, C trees, LDA, SVM, and RF.

Confusion matrix results of KNN classification considering three components.
Performance measures of the classification models considering three components.

KNN: K-nearest neighbor; NB: Naive Bayes; LDA: linear discriminant analysis; SVM: support vector machine; RF: random forest; NER: non-error rate; EMCC: extended Matthew correlation coefficient.
Figure 13 shows the confusion matrix obtained after the classification process made by KNN, where the first eight scores are used in the training process. Data shown in Table 6 correspond to the performance measures of the confusion matrix illustrated in Figure 13. The best results obtained were those of the KNN classifier compared with NB, C trees, LDA, SVM, and RF.

Confusion matrix results of KNN classification considering eight components.
Performance measures of the classification models considering eight components.

KNN: K-nearest neighbor; NB: Naive Bayes; LDA: linear discriminant analysis; SVM: support vector machine; RF: random forest; NER: non-error rate; EMCC: extended Matthew correlation coefficient.
Accuracy generally provides higher values than the non-error rate (NER), because the most represented class is usually the most easily identifiable by classification algorithms and it typically results to be the best-modeled class, thus having the highest sensitivity. 48 In this case, after the application of the taste recognition methodology, the beer class with 19 samples is the most represented and that is why it is 100% predicted.
Results shown in Tables 4–6 express the improvement in accuracy obtained by the taste recognition methodology as PCs are added to the classification model. Particularly, for the KNN classification, accuracy obtained values of 0.6404 when taking into account the first two PCs, 0.7193 when considering the first three PCs and 0.9474 with the first eight PCs. Figure 14 shows the increase in accuracy from the inclusion of the first two main components to the first eight, and from the first nine onward, as well as an oscillatory behavior of the accuracy obtained by the KNN classification model. The cross-validation loss (cvmdlloss) is the average loss of each cross-validation model when predicting data that are not used for training. When taking into account the first eight PCs, the KNN yielded an accuracy value of 0.9474, which refers to a cvmdlloss of 0.0526. The cross-validated classification accuracy resembles resubstitution accuracy. Therefore, it can be expected that the obtained KNN model misclassifies approximately 5% of new data, assuming that those data have about the same distribution as the training data.
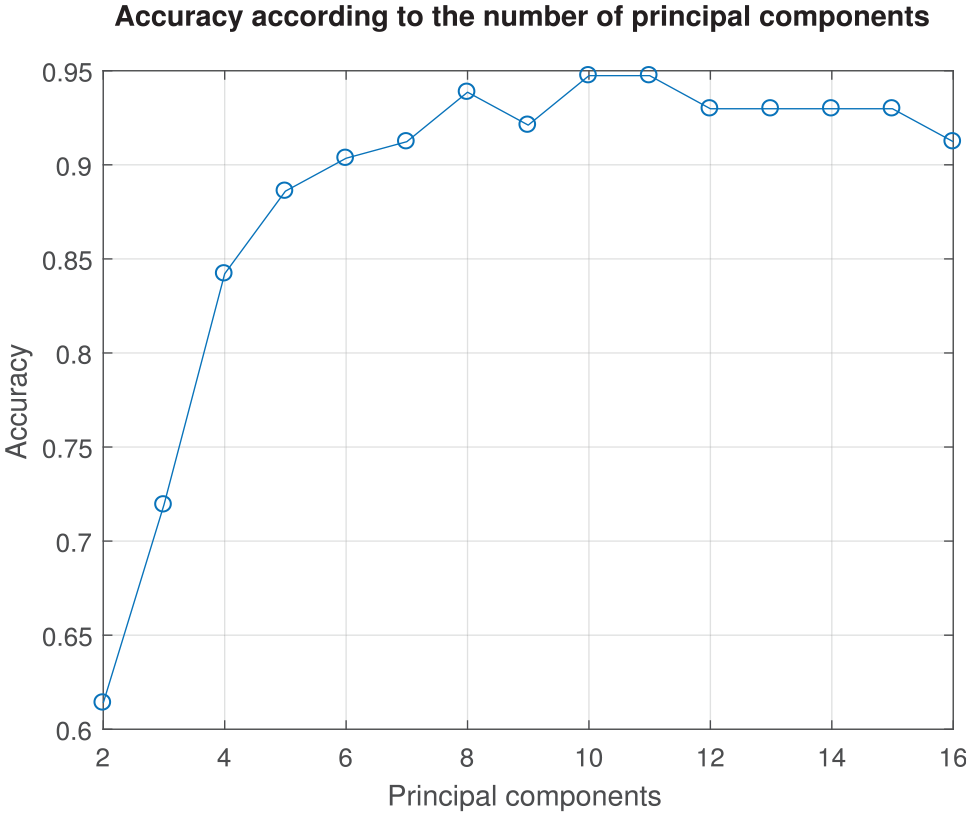
Accuracy according to the number of principal components used in the KNN classification model.
Conclusion
This work described a taste recognition methodology that consists of several stages of signal processing and PARC methods. The methodology was tested with an MLAPV data set of 13 different substances. The data set presents measurements at different concentration levels for each substance in order to improve their discrimination. Results showed that the proposed methodology allows to classify all the substances with high accuracy.
The data obtained by the MLAPV technique in the electronic tongue-type sensor array were organized as an unfolding matrix. This configuration along with the use of group scaling for preprocessing allowed to have a comparable data scaled and normalized and decreased the existence of outliers in the classification process.
PCA was used as a compression tool to reduce the dimensionality of the data. As expected, it allowed to identify relevant information on each measure using the PCs. In particular, a comparative study was made on the use of the number of components at the entrance to the classification process carried out by the machine learning algorithms. When considering the first eight PCs, the classification accuracy made by KNN reached 0.9474. It was found that results are associated with the number of components.
Different machine learning algorithms were compared: KNN, LDA classification trees, NB, RF, and SVM. The method of fine KNN was the one with the best behavior. The performance measures used to determine the classification behavior from results in the confusion matrices and provide important information in a single number that reflects the behavior. In total, 15 different performance measures were described, which allows to compare the classification performance from different points of view by having a set of performance indicators.
Future work can study the influence of changes in the preprocessing normalization stage, the use of different subspace learning algorithms for the feature extraction process, and the use of different classifiers, such as non-supervised, semi-supervised, and supervised algorithms with a comparison between their computational time and accuracy. Since PCA is a stationary technique that preserves the stationary information from the original data, more tests are required to evaluate the methodology in non-stationary conditions to evaluate the effectiveness of the use of PCA for data reduction.
Footnotes
Acknowledgements
The authors thank Dr Lei Zhang at the Chongqing University for releasing the data of the experiments carried out with his MLAPV electronic tongue to the public, which are published by Tian et al. and available in ![]() . The authors express their gratitude to the Administrative Department of Science, Technology and Innovation (Colciencias), “Convocatoria para la Formación de Capital Humano de Alto Nivel para el Departamento de Boyacá 2017,” for sponsoring the research presented herein (grant 779). J.X.L.-M. is grateful to Colciencias and Gobernación de Boyacá for the PhD fellowship.
. The authors express their gratitude to the Administrative Department of Science, Technology and Innovation (Colciencias), “Convocatoria para la Formación de Capital Humano de Alto Nivel para el Departamento de Boyacá 2017,” for sponsoring the research presented herein (grant 779). J.X.L.-M. is grateful to Colciencias and Gobernación de Boyacá for the PhD fellowship.
Handling Editor: Florentino Fdez-Riverola
Declaration of conflicting interests
The author(s) declared no potential conflicts of interest with respect to the research, authorship, and/or publication of this article.
Funding
The author(s) disclosed receipt of the following financial support for the research, authorship, and/or publication of this article: The Administrative Department of Science, Technology and Innovation (Colciencias), “Convocatoria para la Formación de Capital Humano de Alto Nivel para el Departamento de Boyacá 2017,” sponsored the research presented herein (grant 779).