
Abstract
Edge computing has recently emerged as an important paradigm to bring filtering, processing, and caching resources to the edge of networks. However, with the increasing popularity of augmented reality and virtual reality application, user requirements on data access speed have increased. Since the edge node has limited cache space, efficient data caching model is needed to improve the performance of edge computing. We propose a multi-objective optimization data caching model in the edge computing environment using data access counts, data access frequency, and data size as optimization goals. Our model differs from previous data caching schemes that focused only on data access counts or data size. In addition, a cyclic genetic ant algorithm is proposed to solve the multi-objective optimization data caching model. We compare the following three performance indicators: cache hit ratio, average response speed, and bandwidth cost. Simulation results show that the model can improve the cache hit ratio and reduce the response latency and the bandwidth cost.
Introduction
With the rapid development of smart devices, we are embracing an era of the Internet of things. 1 User terminals have changed from having a single role of data consumers to a dual role of data producers and consumers. 2 Cisco conservatively estimates that there will be 50 billion user terminals by 2020. 3 The data generated by these user terminals will increase exponentially. If data acquisition and processing of user terminals take place in the cloud, then the cloud server will be overloaded, thereby adversely affecting timely response to user service requests. The centralized hyperscale cloud computing framework faces data transmission problems due to the slow growth of bandwidth. 4 Therefore, some modes based on edge computing were proposed, such as fog computing5–7 and edge computing.2,8,9
A typical edge computing framework is shown in Figure 1. 8 In this framework, edge nodes have computing, caching, communication, and control functions. 2 They can filter, process, and cache large amounts of data generated by user terminals without consuming a considerable amount of traffic in transmitting the original data to the cloud, thus reducing network transmission pressure and response latency. 9

The framework of edge computing.
With the development of intelligent transportation, 10 intelligent electric grid,11,12 and smart city, 13 user requirements for the delay of requested data have increased. Therefore, data must be cached at the edge node in advance to allow users to obtain data in one or several hops. However, due to the limited buffer space of edge nodes, if a user wants to obtain data in one-hop distance to reduce the response delay and bandwidth cost, then the cache hit ratio of the limited buffer space must be improved. We will design a data caching model in the edge computing environment to realize data access with low latency and a small bandwidth. The contributions of this article are summarized as follows:
A data caching model in the edge computing environment is proposed, named edge-aided cooperative data caching and offloading (ECDCO). This model can efficiently offload data with minimal access and low utility and cache data with a large amount of access and high utility to ensure cache space utilization.
An improved genetic ant colony algorithm (GACA) named cyclic genetic ant colony algorithm (CGACA) is proposed. Based on the traditional GACA, this algorithm applies cycle roulette selection to solve the problem of ant data selection, thereby retaining more data with large amount of access, small data size, and high frequency on the edge nodes.
The remainder of this article is organized as follows: In section “Related work,” we will briefly introduce work related to caching in different computing paradigms. In section “Data caching model in edge computing environment,” we will propose a data caching model in the edge computing environment. In section “CGACA,” we will propose a cyclic GACA to solve the data caching model. In section “Numerical simulation,” we will compare the traditional cache replacement strategy with our model in terms of response latency, cache hit ratio, and bandwidth cost. Finally, we present a summary in section “Conclusion.”
Related work
To the best of our knowledge, existing works on data caching mainly focus on three computing paradigms: cloud computing, 14 fog computing, 15 and mobile edge computing. 16 According to the characteristics of different computing paradigms, designing different caching schemes to reduce time delay is the common goal of scholars who study data caching.
In cloud computing, to address end-to-end delay of mobile cloud computing service requests, Joy and Jacob 17 discussed the possibility of using cooperative caching methods to improve data access efficiency in mobile cloud computing. To improve the content cache hit ratio, Jiang et al. 18 developed a content distribution optimization model and a cache writing framework. To further optimize the content caching algorithm, Zhang and Hao 19 proposed a new algorithm for cloudlet content caching based on web mining to improve the hit rate of cloud caching and reduce response latency.
In fog computing, a widely deployed fog cluster needs to share or cache resources. Su et al. 20 proposed a Steiner tree–based caching scheme to minimize the total path weight. For content distribution network scenarios, M Zhanikeev 21 proposed a strategy for achieving optimal fog cloud caching through local hardware awareness. Given that the fog node is vulnerable to attacks from malicious users, Z Su et al. 22 proposed a secure caching scheme for Microsoft network (MSN) disaster backup for fog computing.
For the data cache and offload of edge computing, scholars mainly study the collaborative computing method of edge nodes and the data cache and offload optimization of edge nodes. For the collaborative computing method of edge nodes, in order to jointly tackle these issues in wireless cellular networks with mobile edge computing, Wang et al. 23 formulated the computation offloading decision, resource allocation, and content caching strategy as an optimization problem, considering the total revenue of the network and developed an alternating direction method of multipliers-based algorithm to solve the problem. A Ndikumana et al. 24 proposed collaborative cache allocation and computation offloading, where the multi-access edge computing (MEC) servers collaborate for executing computation tasks and data caching, and they formulated an optimization problem that aims at maximizing the resource utilization. For the optimization problem, A Ndikumana et al. 25 proposed a proximal upper bound problem of the original formulated problem. To solve the proximal upper bound problem, the block successive upper bound minimization method was applied.
In terms of data cache and offload optimization of edge nodes, Luo et al. 26 considered content popularity distributions and formulated a joint optimization framework to minimize the energy consumption of the system. As a complicated joint optimization problem, they applied a genetic algorithm (GA) to solve it by analyzing the execution delay and transmission delay of each task. Wang et al. 27 formulated a resource-constrained delay minimization problem and put forward a heuristic algorithm based on GA and simulated annealing (SA). For the problem of minimizing delay, Hao et al. 28 described it as mixed integer programming and solved this problem with an efficient algorithm based on alternating iterative algorithm.
In the above research, the authors made some or all considerations on data access counts, data access frequency, and data size when building the model. However, the lack of cache conditions will cause frequent updates of the cached data and waste the resource of the edge node. Meanwhile, the algorithms used have certain defects such as easy access to local optimal solutions, high computational complexity, and failure to retain most of the cached data. This article will consider data access counts, data access frequency, and data size to establish a multi-objective optimization model and set data cache conditions to avoid unnecessary waste of resources. Furthermore, the cyclic GACA is proposed to solve the model.
Data caching model in edge computing environment
In this article, according to the characteristics of data caching in the edge computing environment and the shortcomings of related research, we propose a data caching model with data access counts, data access frequency, and data size as the cache optimization objectives in an environment where data are dynamically submitted. This model can improve the data cache hit ratio of edge nodes, effectively reduce user access delay, and greatly improve the user experience. For the sake of convenience, the symbols that we use in this article are summarized in Table 1.
Meaning of the symbols we used.

Data record sheet
Data record sheet, which is used to record the attribute information of data, contained two operations: data attribute information creation and data attribute information update. When the data are accessed for the first time, relevant attribute information needs to be recorded in the record sheet, including data name, size, access count, first request time, latest request time, and caching status. When the data are accessed again, the attribute information must be updated in the record sheet. In this article, each edge node has a data record sheet to record the data information accessed by users. And we design the following six data attributes which constitute the information needed for data caching and replacement:
D_Name: Data name, which is used to identify data.
D_Size: Data size, which is an optimization objective in the data cache optimization model.
D_Count: Data access counts, which is used to judge whether the data satisfy the condition of caching into the edge node and take as an optimization objective in the data cache optimization model.
F_Time: First request time of data, which is used to calculate the data access frequency.
E_Time: Latest request time of data, which is used to calculate the data access frequency.
D_Cache: Data caching or not, where 1 means that the data are cached on the edge node and 0 means that the data are not cached on the edge node.
Data cache conditions
One of the two conditions below must at least be satisfied for data caching on the edge node to prevent the waste of space and computing resources. Data cache conditions developed in this article include the following:
Data can be cached on the edge node only when the cumulative data access counts reach the threshold of data access count Countmin.
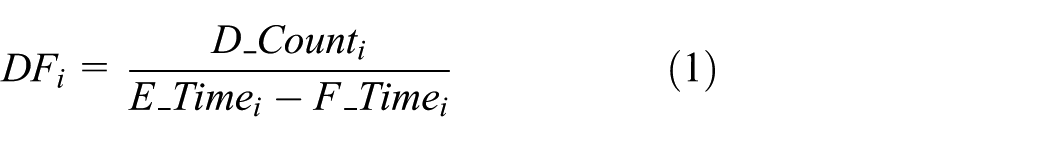
Data can be cached on the edge node only when the data access frequency Freq is greater than or equal to the access frequency threshold Freqmin. The ith data access frequency is calculated as follows
Data caching process
To allow users to acquire the data they need, the data acquired by users are stored on the edge nodes or the clouds near them. The basic flow of the designed data caching scheme is shown in Figure 2. The specific steps are as follows:
The service requests for accessing the data submitted by users are acquired.
The acquired service requests are analyzed. The data attribute information is updated if the data are included in the record sheet; otherwise, the initial attribute information of the data is recorded in the sheet.
Whether the data have been cached on the edge node is determined. If so, send the requested data to the user; otherwise, get the data in the cloud.
Whether the data acquired from the cloud satisfy data cache conditions is determined. If so, the data are stored on the edge node; otherwise, return to the start.
Whether the remaining cache space of the edge node can cache the data is determined. If so, the data are cached; otherwise, the parameters are initialized and the cyclic GACA is executed to obtain the optimal data cache replacement result.
The data record sheet is updated according to the optimal data caching scheme and the data are cached in the cache space.
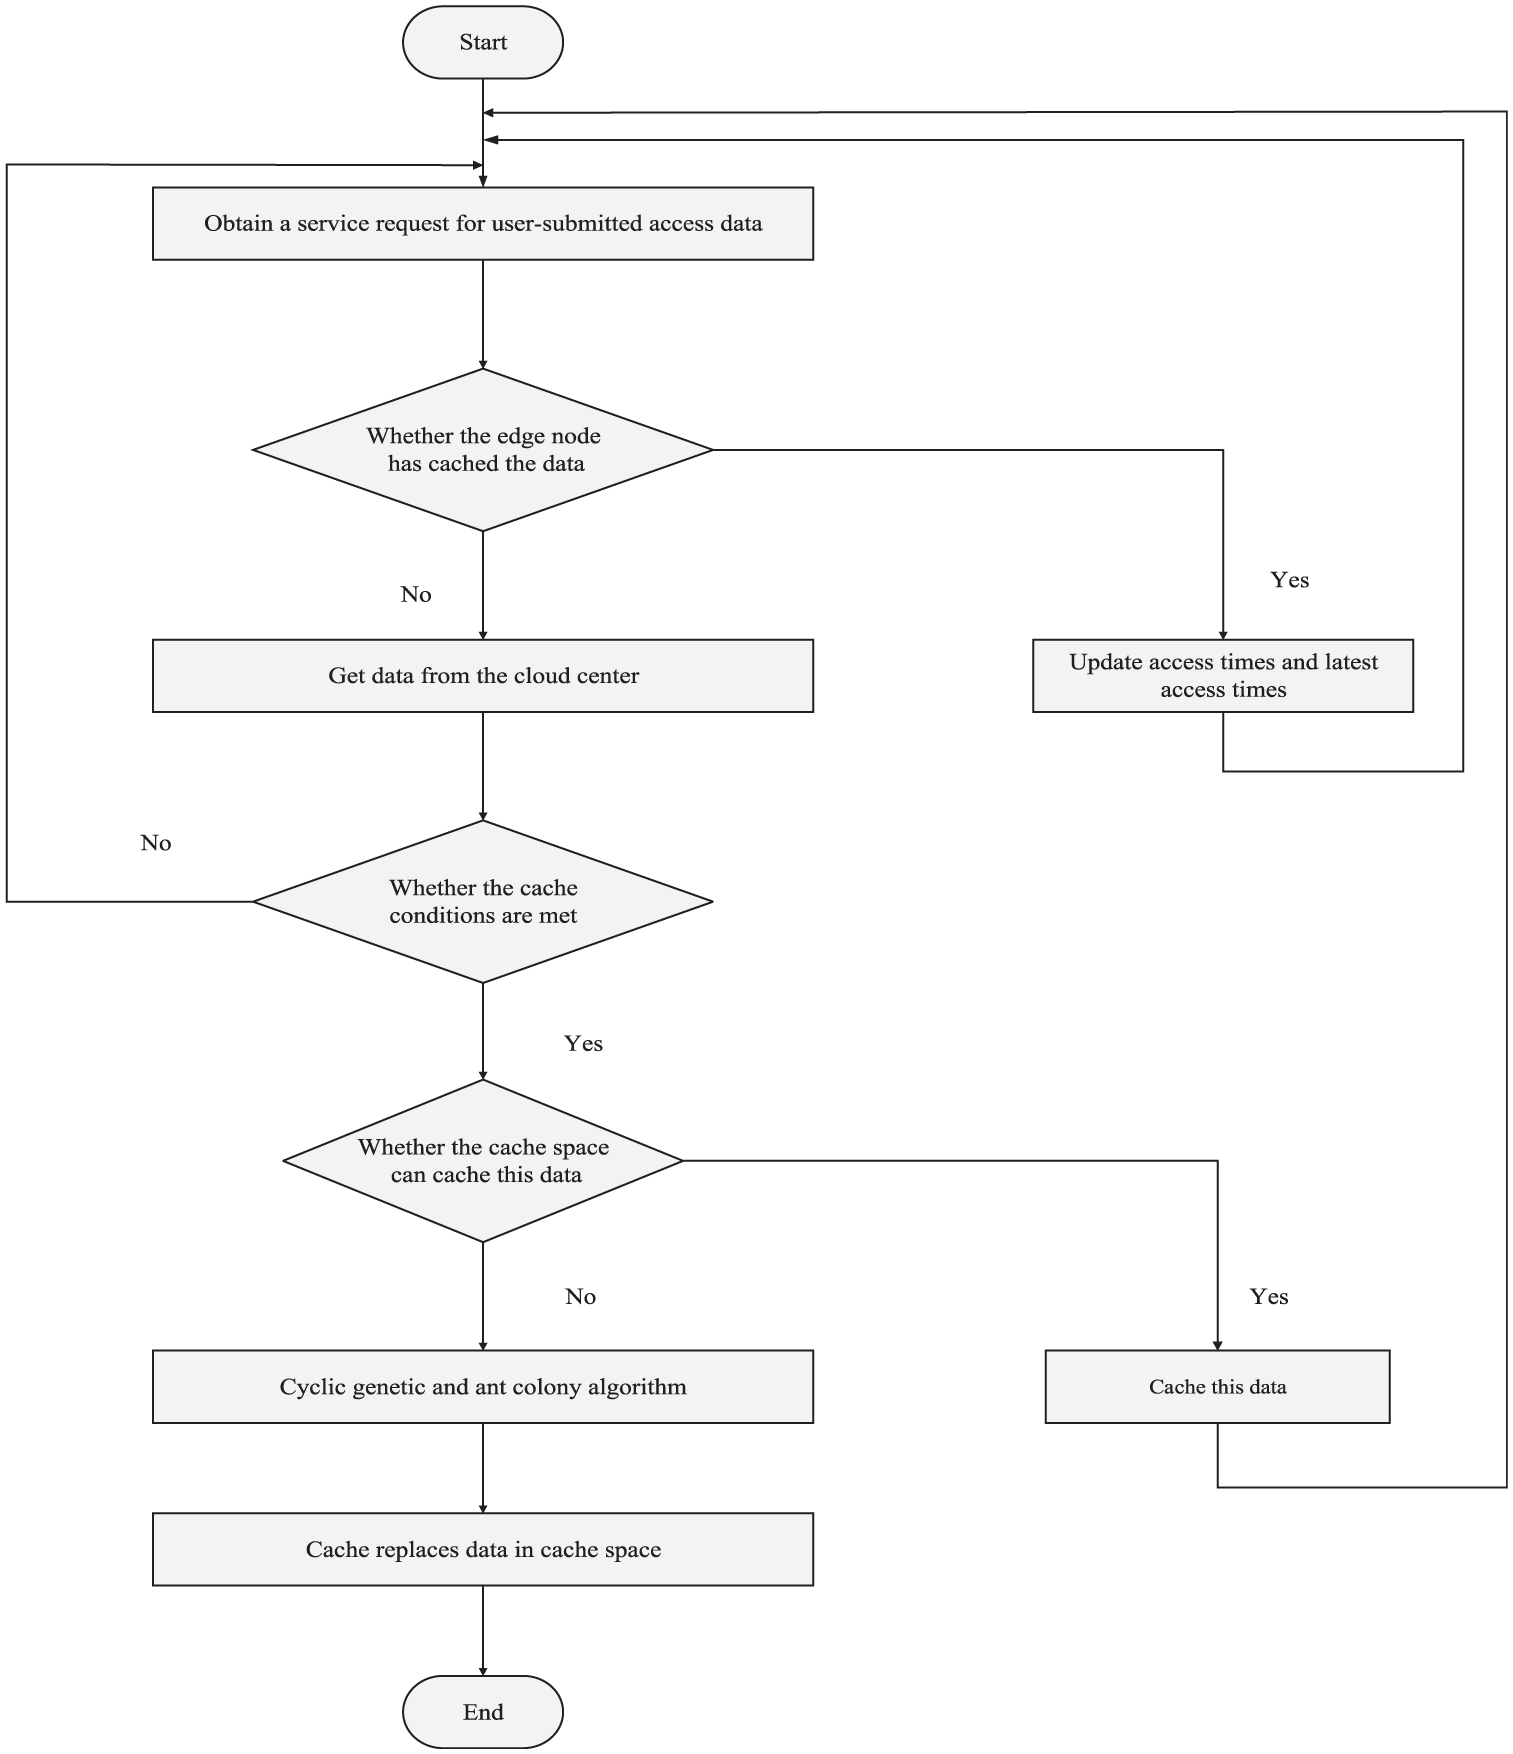
Basic flow of data caching scheme.
Mathematical model
When the data satisfy the caching condition but the cache space of the edge node is insufficient, the cache replacement algorithm must be executed to offload a part of the data. In this article, the following mathematical model is designed to determine whether the data should be offloaded or not.


The access frequency of the data cached on the edge node is calculated according to formula (1) to obtain the set of data access frequencies


The set of data sizes cached on the edge node is


Thus, the objective function of the data caching model is obtained

where the sum of the size of the selected data that are originally cached at the edge node and the new data that need to be cached at the edge node is smaller than the size of the cache space of the edge node. w1, w2, and w3 are the weights of the data access count, the data access frequency, and the data size, respectively. Their sum is 1. In this article, after several simulations, it is determined that w1, w2, and w3 are 0.3, 0.3, and 0.4, respectively. The optimization algorithm aims to find a suitable matrix X to minimize the value of fobjective. We want to cache as much data as possible, and these data have large data access counts, high data access frequency, and small data size. Thus, fDC and fDF are inversely proportional to fobjective, and fDS is proportional to fobjective.
CGACA
In this section, CGACA is designed to effectively solve the problem of multi-objective optimization. Before designing this algorithm, several challenges were faced. (1) The ant colony algorithm mainly solves the path planning problem. How to apply the ant colony algorithm to the data cache and produce better results? (2) While selecting data with high user demand, we must also consider how to increase the cache space utilization of edge nodes. (3) Both ant colony algorithms and GAs have their own shortcomings. The initial pheromone accumulation of ant colony algorithm is slow, and it is prone to stagnation in the search process. The early convergence of GA is fast and it is easy to enter redundant iteration. How to combine GAs with ant colony algorithms to solve these problems?
For the above challenges, we made the following improvements. (1) For roulette wheel selection, the loop roulette wheel selection method is proposed to save those in relatively dominant positions, replace those in relatively inferior positions, and randomly save or replace those in almost equal positions among the adjacent data to achieve the expected results. (2) The updating mechanism of pheromone and the mechanism of optimal mapping of GA to pheromone of ant colony algorithm are improved to speed up the optimization. (3) The ant colony algorithm with iteration number of one is used to obtain a solution that is mapped to the GA as the initial parent population, thus avoiding the blindness of the pre-optimization process of the GA.
Construction of GA
In this algorithm, the ant colony algorithm must be executed first to generate the binary encoding population as the parent population of the GA. The purpose of this step is to enable the GA to obtain the optimum solution with a few iterations.
In data caching under edge computing, a large fitness function value of the solution corresponds to a great probability of survival and thus a great probability of being inherited by the next generation. Therefore, the reciprocal of the objective function is chosen as the fitness function

The roulette wheel selection method is applied to select the parent population. The principle is to judge the probability of the fitness value of the individual being taken as the parent for reproducing offspring. A great fitness corresponds to a great probability of being selected and thus a great probability of contributing one or more offspring to the next generation. The expression is as follows

where m is the total number of ants and j means the jth ant.
In the design of the crossover operator, parents H and R which are selected from the parent population are randomly chosen. A starting position Ri and an ending position Rj are randomly assigned to sequence R of the parent. Then, the corresponding element fragments in sequence H are replaced with the fragments in parent R. The crossover operator is designed as shown in Figure 3.
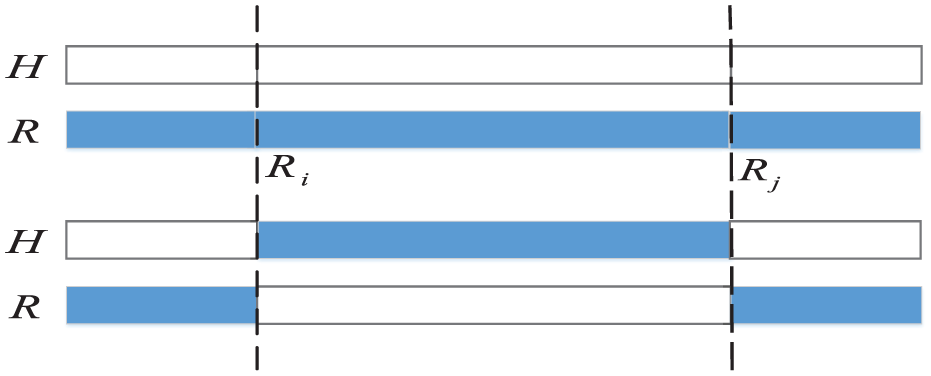
Example of crossover operator.
To prevent local optimum, a mutation operator is necessary, as shown in Figure 4. In the current parent population, some parents with high fitness are randomly selected. The values of two random positions in their sequences are exchanged to produce a new selection scheme.

Example of mutation operator.
The sequences with high fitness in the offspring produced by the crossover and mutation operation are replaced by those with low fitness in the original parent to improve the fitness of the parent population and obtain the optimum solution faster.
Construction of ant colony algorithm
The initial pheromone is used to guide the search of the initial ant colony. The weights of the data access count, the data access frequency, and data size are taken as the initial pheromones of the ith data. The calculation method is as follows

The data are selected using the loop roulette wheel selection method, in which the sum of the probabilities of the data being and not being selected is 1. The selected probability of the ith data is calculated as shown in equation (12), to save those in relatively dominant positions, replace those in relatively inferior positions, and randomly save or replace those in almost equal positions among the adjacent data to achieve the expected results
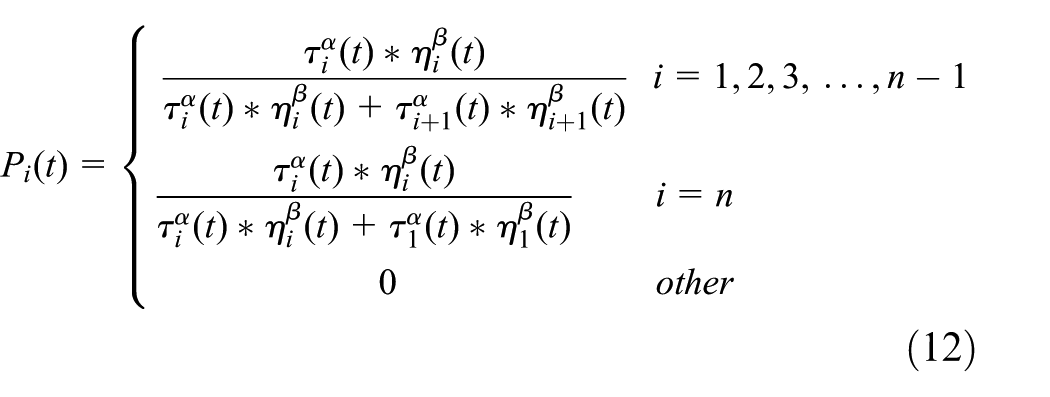
Among the factors, information heuristic factor α and expectation heuristic factor β are the two key parameters in the algorithm whose values directly affect the probability of each data being selected and then the ultimate effect of the algorithm. Their values are determined according to the previous parameter adjustment experience and some existing research results. τi(t) represents the pheromone concentration on the present data. ηi(t) is a heuristic function that represents the expectation that the ith data object is selected by the ants. The calculation method is as follows

When the results selected by the ants fail to meet the constraints, a penalty factor is added to prevent the occurrence of similar selection results. The penalty factor is calculated as follows

The population number of ants is defined as m, the pheromone volatilization in the path finding process of ants as ρ, and the path selection of all ants as the matrix Pa. xi,j in the matrix represents the situation where the ith data are selected by the jth ant. The pheromone update after each iteration is calculated as follows


Dynamic switching construction of two algorithms
The genetic and ant colony algorithms are switched by a dynamic switching strategy to realize optimal timing, thus improving the working efficiency of the algorithm. 29 The details are as follows:
According to experience and the experiment, the maximum and minimum iteration numbers are set. The iteration number of the GA must be between the maximum and minimum iteration numbers.
In the iteration process of the GA, the function value of each iteration result must be calculated. If

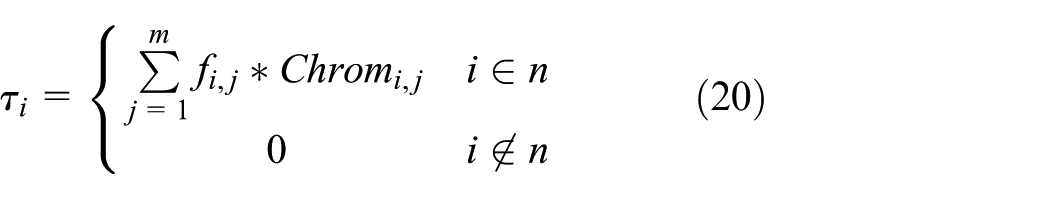
where Chromi,j is the choice of the ith data by the jth excellent parent in genetic algorithm.
Algorithm design step
Through the introduction of the idea of the improved algorithm and the specific design, a flow chart of the proposed CGACA is shown in Figure 5:
The ant colony algorithm is run once to form the parent population B of the GA.
Fitness evaluation, selection, crossover, and mutation are implemented on individuals in parent population B to obtain new progeny population A.
Whether the current state meets the conditions for algorithm switching is determined. If so, the ant colony algorithm is used.
The initial pheromone of the mapping is calculated according to formulas (19) and (20).
The data are selected by the ants according to the pheromone concentration and the heuristic information. The value of the caching objective function fobjective is calculated.
The pheromone of each data is updated according to the pheromone updating rules after all ants have completed a round of selection.
The number of iterations changes correspondingly. The minimum value (fobjective) and the data caching situation are output and the algorithm is terminated when the number of iterations reaches the upper limit.

The basic flow chart of cyclic genetic ant colony algorithm.
Because the storage capacity and computing power at the edge nodes are limited, the algorithm deployed at the edge nodes needs to have better algorithm complexity. As shown in the algorithm flow chart in Figure 5, assuming that the cached data of the edge node is n, m ants participate in the loop, and the maximum number of traversal times of the CGACA is Nc, then the complexity of the algorithm is O(Nc*n*m). The complexity of the traditional GACA is O(Nc*n2*m). Therefore, the cyclic genetic ant colony algorithm has a superior complexity.
Numerical simulation
In this section, we first demonstrate the feasibility of ECDCO and use the improved GACA to calculate the final cache and offload results. Then, we compare the proposed strategy with strategies proposed in recent years. The performance indicators used for comparison are cache hit ratio, average response speed, and bandwidth cost. The details are as follows.
With regard to the ratio of the number of times the user obtains data from the edge node to the total number of times the user accesses the data, the number of times the data i is accessed in the cache space of the edge node is represented by DTi, and the total number of accesses of the data i is represented by Ti. Then, the cache space hit rate is

With regard to the ratio of the size of the access data obtained by the user to the time taken by the user to obtain the data, the size of data i is expressed by DSi and the total access count of data i is expressed by Ti. Each response time of data i is expressed by Timeij. Thus, the average response speed of is expressed as follows

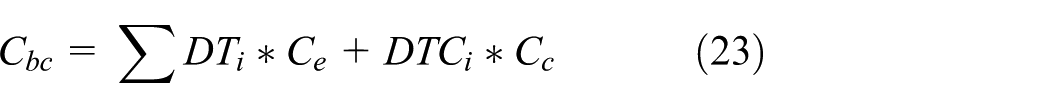
With regard to the bandwidth cost by the system to respond to the user’s data request, the hits of data i at the edge node or the cloud can be expressed as DTi or DTCi. The bandwidth cost by the user to obtain the data at the edge node or the cloud can be expressed by Ce or Cc. Thus, the bandwidth cost is expressed as follows
Simulation scenario
We simulated 80 terminal users issuing data access requests to edge nodes. Data requests are sent every 3 min, and each terminal user must send three to five requests. Table 2 describes the bandwidth and bandwidth cost among user devices, edge nodes, and the cloud center. Table 3 describes some parameters of the proposed CGACA.
Simulation parameters in the edge computing environment.

Related parameters of the cyclic genetic ant colony algorithm.
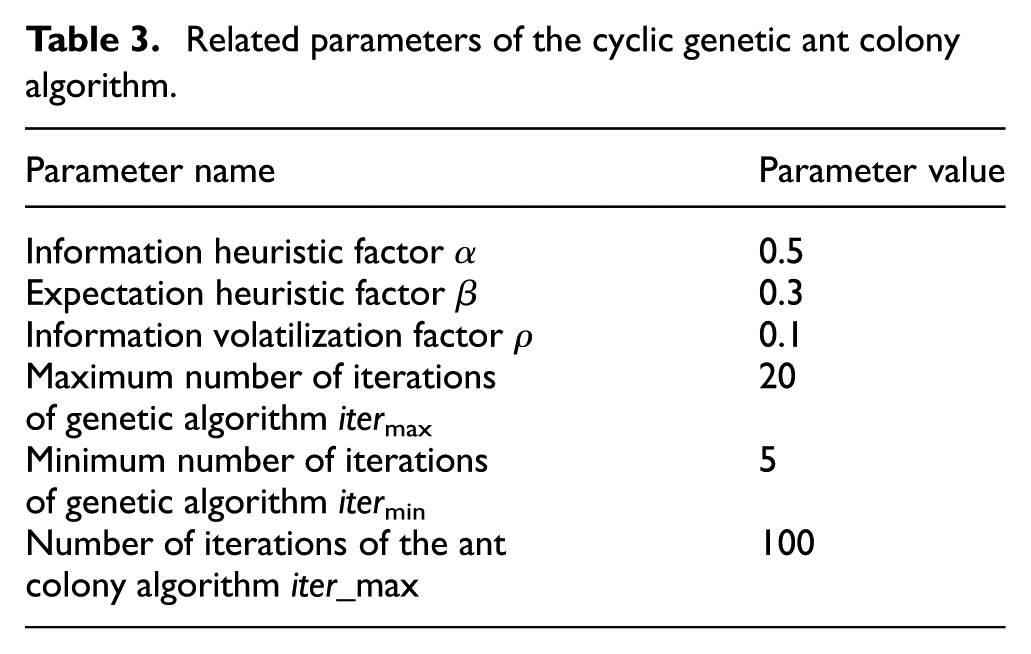
In order to study the effect of pheromone importance factor α on the objective function value, we set β = 3, ρ = 0.1, and compared the objective function values corresponding to 10 groups of different α. Each group runs 20 times, taking the average result value. The result is shown in Figure 6, which shows that when α = 1, the average objective function value is the smallest. Similarly, as shown in Figures 7 and 8, we can obtain the value of β to be 2 and the value of ρ to be 0.1.
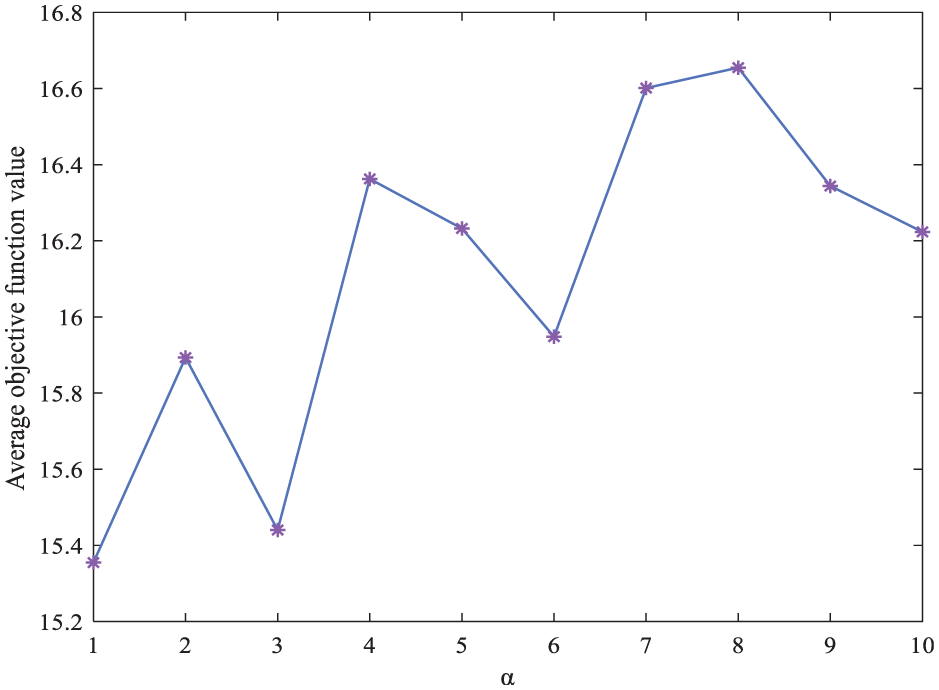
The influence of parameter α on the value of the objective function.

The influence of parameter β on the value of the objective function.

The influence of parameter ρ on the value of the objective function.
Numerical result
CGACA results
In the experiment, the cache size of the edge nodes is assumed to be 2800 Mbit. When the data that must be cached could no longer be cached in the cache space, CGACA is executed to offload and replace the data. Figures 9–11 show the results of one cache replacement we intercepted.

Genetic algorithm evolution.

Comparison of the average objective function value and the optimal function value of each generation in the iterative process of ant colony algorithm.

Final selection result of cyclic genetic ant colony algorithm.
According to Figure 9, the optimal objective function value gradually decreases with the increase in the genetic generations. If the optimal objective function values produced from the 12th iteration to the 16th iteration are the same, then the situation enters the stage of the ant colony algorithm. Figure 10 demonstrates the relationship between the average objective function value of each generation and the optimal function value in the iteration process of the ant colony algorithm. The figure shows that the optimal objective function values decrease with the increase in the number of iterations and remains unchanged after 17 iterations. It means that the proposed CGACA can converge to a stable state, and the mapping of the solution of the GA to the ant colony algorithm reduces the solution-searching process of the ant colony algorithm in the early stage and accelerates the search for the optimal solution. According to Figure 11, the data that occupy a large cache space but have small access count and data access frequency are offloaded and most of the data are retained which not only improve the utilization of the cache space but also increase the cache hit ratio.
Performance comparison of four cache replacement methods
To evaluate the caching strategy, we compare the ECDCO strategy proposed in this article with the following caching strategies:
Data popular caching and offloading (DPCO): The edge node first caches the data with a large number of requests until the edge node’s cache capacity is reached.
Cooperative data caching and offloading (CDCO): The edge node cooperates with the end user to cache and offload data, and the data access frequency and data size are the basis for judging whether the data are cached. 30
Data caching and offloading (DCO): Caching and offloading data based on the latency of the end user getting the data they need. 28
From Figures 12 to 14, it can be seen that the caching strategy proposed in this article is optimal, while the DPCO is relatively poor. This is because DPCO only considers data access counts and fails to consider data access frequency and data size. The CDCO only considers data access frequency and data size, rather than considering data access counts and data cache conditions comprehensively. DCO considers data access counts, data access frequency, and data size to a certain extent. However, data cache conditions are missing, which causes the edge node to cache some non-excellent data. At the same time, the number of algorithm operations increases, which puts higher requirements on the computing resources of edge nodes. As can be seen from Figure 12, as the edge node cache space and the cached data increase, the cache space hit rate increases. As shown in Figure 13, the average response speed increases with the increase in the cache space. Because the algorithm proposed in this article sets the execution condition and has a high cache space hit rate, it can reduce the execution number of the algorithm and quickly return the data to the user to improve the response speed. Figure 14 shows the relationship between bandwidth overhead and the cache space size of edge nodes. The bandwidth overhead gradually decreases as the cache space increases. The bandwidth of the strategy proposed in this article consumes a lot when the data do not satisfy data cache conditions. However, it reduces the execution number of the algorithm and saves the computing resources of the edge nodes.
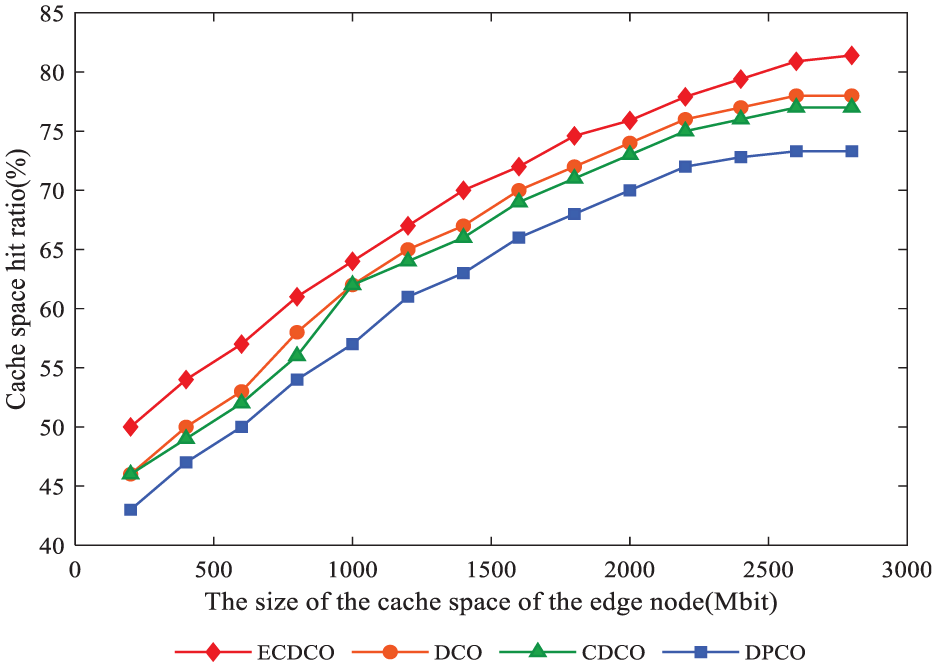
Cache hit ratio comparison.
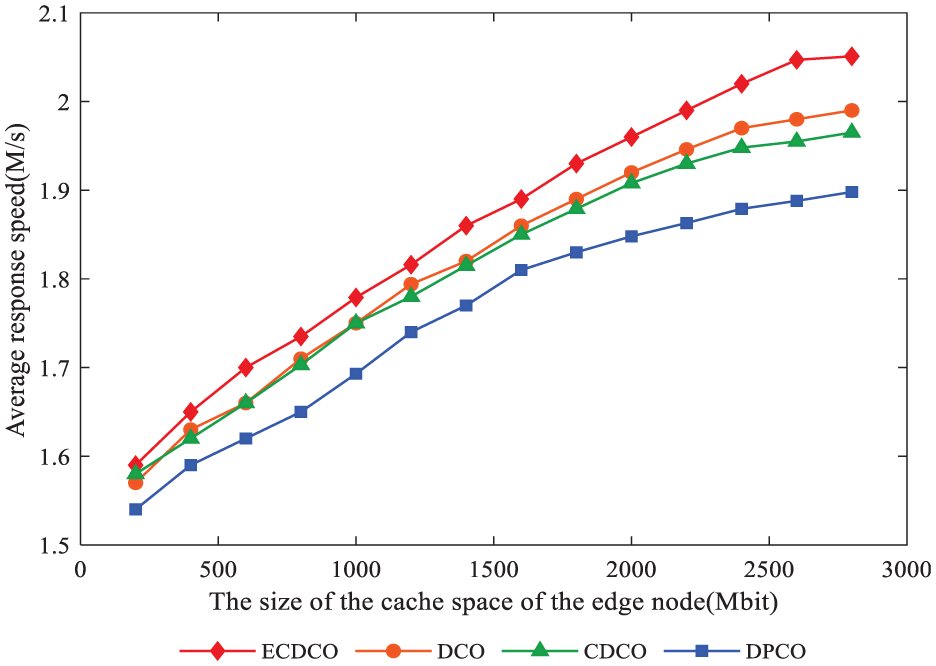
Average response speed comparison.

Bandwidth cost comparison.
Conclusion
Edge nodes have computing, caching, communication, and control functions, but their cache space is limited. Thus, some useful data must be cached at the edge nodes. In this article, we establish a data caching scheme in the edge computing environment. The data caching scheme is based on the CGACA and it aims to increase the cache space hit ratio and reduce the response delay and the bandwidth cost. Data size is considered aside from number of times that users access data. In the future, we will further improve our proposed data caching solution to minimize response latency and bandwidth cost.
Footnotes
Handling Editor: Yanjiao Chen
Declaration of conflicting interests
The author(s) declared no potential conflicts of interest with respect to the research, authorship, and/or publication of this article.
Funding
The author(s) disclosed receipt of the following financial support for the research, authorship, and/or publication of this article: This work is supported by the National Key R&D Program of China (2017YFC0820700) and the Fundamental Research Funds for the Central Universities of China (FRF-TP-18-006B1).