
Abstract
This study proposes an outlier detection system based on the visual-physiology multimodal data system for a Korean reality TV show, “Perfect on Paper.” The goal of this system is to provide the program production team and the master of ceremonies with real-time facial expressions and bio-signal analysis results of program participants. Using this information, the program production team and master of ceremonies can easily identify the participants with unusual behavior. We propose an insole-type hardware that measures the wearer’s skin conductivity, temperature, and motion. We also suggest a dynamic time warp-based clustering algorithm for the outlier and micro-expression detection technique. The system was developed starting from the program planning phase through a 6-month period in collaboration with the production team. The developed system analyzed the biometric information and facial expressions of 88 participants in 11 episodes and provided rapid feedback to the production team at the shooting spot in real time. Finally, we present a case where a visual-physiology multimodal system can be useful for a real TV broadcasting production.
Introduction
Reality shows are among the most popular TV program genres. They document supposedly unscripted real-life situations and often feature an otherwise unknown cast of individuals who are typically not professional actors. Among the reality shows, reality dating shows, which help participants find a romantic partner, have been popular in Korea. In these dating shows, many male and female participants attend various events in a limited time to find a partner. Because viewers often want romantic or unexpected storytelling that they cannot experience in real life, the TV production team makes an effort to capture or highlight the abnormal behavior of these participants.
In order to create a single TV show, a large number of production members (cameramen, writers, and producers (PDs), etc.) are needed. In general, the number of production members and the shooting and editing time proportionally increase with the number of participants. An hour of a reality TV show typically takes more than 10 h to shoot and about 20–70 cameras are used in the studio or outside. 1 In a traditional reality show shooting, the production team captures the extraordinary situations visually by monitoring the video from each camera. Once the production team captures an important moment of a participant during filming, they instantly send a message to the cameramen and the master of ceremonies (MC) through the wireless microphone to zoom in on the facial expression of the participant or to control the story flow to create more interest.
It is relatively easy to detect such moments in TV talk shows with one to three participants. However, it is difficult to seize this moment in real time from videos taken by dozens of cameras at the shooting spot. If the production team misses that important point in time, it will affect the perception of the program by the viewers negatively. The team may try to detect similar moments in the editing process after shooting to create an interesting story flow; however, editing period is very limited in weekly show production. Therefore, the production team puts significant effort into detecting these important moments during shooting.
In this study, we propose a visual-physiology multimodal system to detect the outlier behaviors of participants in real time during the shooting of a TV show. There are many studies in the fields of psychology and artificial intelligence that analyzed the TV programs, but few studies focused on the visual-physiology analysis of participants during shooting. In this study, we propose an insole-type physiology detecting hardware, a micro-facial expression detection method, and clustering methods in reality TV show production. We describe the practical problems encountered when applying affective computing technology in TV broadcasting and introduce solutions to meet the requirements of broadcasting industry.
Related work
Facial expression analysis for emotion recognition has the advantages of intuitive detection and analysis methods. However, some people can easily hide their real emotional states; 2 thus, facial expression analysis may not be suitable for analyzing introspective people whose expressions do not change much or people who can artificially control their facial expressions. 3 To overcome these drawbacks, various additional modalities were applied in facial expression analysis. The physiology-based emotion recognition technology can be used on its own for emotional analysis, but it also has some features that can enhance the accuracy of the overall emotional analysis when used in combination with the emotion recognition analysis technology based on facial expressions. 4
The visual-physiology multimodal system improves the classification accuracy by complementing the disadvantages of facial expression analysis using bio-signal analysis. Liu et al. 5 proposed an electroencephalogram (EEG)-based web-enabled music player that can display the music according to the user’s current emotional states. They proposed a real-time fractal dimension-based algorithm for the quantization of basic emotions using the arousal-valence emotion model with EEG signals. 5 Nicolaou et al. 6 compared the performance of machine learning techniques applied to the target problem, the bidirectional long- and short-term memory neural networks, fuzzy facial expressions, shoulder gestures, and audio cues for dimensional and continuous prediction of emotions in the valence and arousal space.
Kolodyazhniy et al. 7 studied the effects of feature selection, classifier type, and the cross-validation method. Their results demonstrated that the three states (fearful, sad, and neutral), even the emotion of an unknown subject in an unknown situation, can be classified with high accuracy by most classifiers with the sparsest model having only five features. 7 Soleymani et al. 8 presented a user-independent emotion recognition method to recover affective tags for videos using EEG, pupillary response, and gaze distance. They used 20 video clips with extrinsic emotional content from movies and online resources and recorded the EEG responses and eye gaze data from 24 participants while they were watching the emotional video clips; Fernandez modality of fusion strategies and a support vector machine (SVM) were used for analysis. 8 Fernández-Caballero et al. 9 introduced a proof-of-concept for emotion detection and regulation in smart health environments to detect the patient’s emotional state by analyzing the physiological signals, facial expressions, and behavior. The system provides the best-tailored actions in the environment to regulate these emotions toward a positive mood when possible. 9 Yin et al. 10 proposed a multiple-fusion-layer-based ensemble classifier for stacked autoencoder (MESAE) to recognize emotions, in which a deep structure is identified using a physiological data-driven approach. Each SAE consists of three hidden layers to filter the unwanted noise in physiological features and derive stable feature representations. 10
There are also a number of multimodal studies in the field of TV broadcasting. 11 Advertising and publicity identify the emotional state of the viewers of broadcast TV videos. Two previous studies identified effective advertising by detecting the viewers’ reaction to TV advertisement. 12 However, there are very few cases in which the multimodal system is used as a broadcasting production technique. Toral-Madariaga et al. 13 used facial expression analysis and bio-signals for broadcaster training. They proposed a training model that integrates all the processes involved in this orchestral communication besides voice management, individual mind, and the body, which are the real amplifiers of personal expression. Their results showed that the training program decreased anxiety during broadcasting, achieved optimal psychological state, and improved communication quality. Vallet et al. 14 used a multimodal system for speaker segmentation editing in broadcast production. They proposed solutions to the problem of speaker diarization of TV talk shows where adaptive multimodal approaches, which rely on other data streams, remain largely under-exploited.
Previous multimodal systems have been used as a supplementary technique to extract useful information from recorded TV movies. To the best of our knowledge, there are no other multimodal system applications used during actual TV shooting. In this study, we introduce a visual-physiology multimodal system that can be used as an automatic monitoring tool for broadcast production. The contributions of this study can be summarized as follows.
Hardware development and environment configuration to detect the participant’s multimodal data in real time in a non-intrusive way.
Outlier detection based on dynamic time warp (DTW) algorithm and dendrogram clustering.
Detection of micro-behavior cues from cameras, which can be useful for entertainment shows.
Technical requirements
Program requirement
This research was performed to support the production of a reality TV show “Perfect on Paper” in South Korea. Figure 1 shows the screenshots of the TV show and the images of the recording studio. This program is a blind dating program between eight men and one woman. The goal of the program is to select one man who best suits the woman using a dating technology developed in the fields of psychology and computer science. The program consists of three rounds. In the first round, 20 questions are given to 8 men and the men who choose the option selected by the woman get the score. In the second and third rounds, the men play various games with the female participants. Our system was mainly used in the first round to detect multimodal signal changes in eight men while they were answering the questions. The requirements of the program production team were as follows.
The production team wants to know the specific participant who shows abnormal emotional response compared to the others in real time. The detection of abnormal behavior on time can generate extra excitement for the audience.
Hardware for the detection should be communicating wirelessly not to interfere with the movement of the participants. It should also be easily worn and should not be exposed to the camera to avoid controversy over indirect advertising. In addition, it is necessary to keep the attachment state stable and operate normally even during long and continuous shooting (up to 24 h).
Multimodal data showing biometric signals and facial expression changes should be provided to the production team so that they can be used in the editing process after shooting.
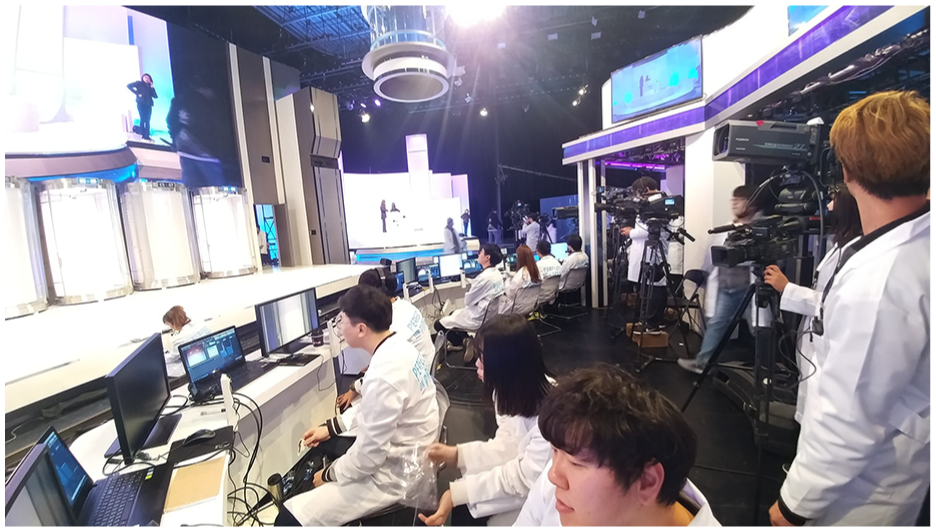
Program shooting stage (left: position of participants; right: the studio, the research team (first floor), and MCs (second floor)).
Technical approach
In order to meet the requirements of the production team, we examined a variety of methodologies. There were several technical problems in the application of the affective computing technology to the production and broadcast industry.
Non-intrusive visual-physiology multimodal system
Participants in the program are very likely to generate fake emotion and their facial expressions and voices are likely to be intentionally manipulated. The accuracy of the learned facial expression classifiers based on the frontal image data is lower than expected due to the unexpected head movements in the actual shooting stage. Therefore, the actual facial expression classification accuracy is lower than in the laboratory environment. Consequently, we concentrated on outlier behavior detection rather than facial expression classification. We adopted additional physiological data to improve the accuracy of outlier detection. Owing to the recent technological advances, small bio-signal sensors can be attached to the participants and can be measured from a distance. However, if the participant recognizes that the bio-signal is being measured, it may affect the accuracy of the measurement. To solve this problem, we developed an insole module capable of WiFi reception for the non-intrusive detection of participants’ bio-signals.
Outlier detection algorithm
In the dating program, only one or two dialogues between men and the MCs can be displayed on the screen at a time. Thus, the relative comparisons between the male participants are important to determine the prominent participant. We developed a clustering algorithm to identify one or two participants who show the most unusual behavior at the present time by comparing the participants. We calculated the distance between the multimodal data collected using the DTW algorithm. Based on the dynamic time warping distance (DTWD) matrix, we constructed a dendrogram to distinguish the participants who are out of the cluster in real time. Then, the client-based visualization tool was developed to make it easier for the production team to check the difference between the bio-signals and facial expressions of the participants in real time.
System
As a visual-physiology multimodal system, we developed (a) an insole module for bio-signal detection, (b) a facial expression analyzer, and (c) a DTW-based outlier detector. Figure 2 shows the process flow.
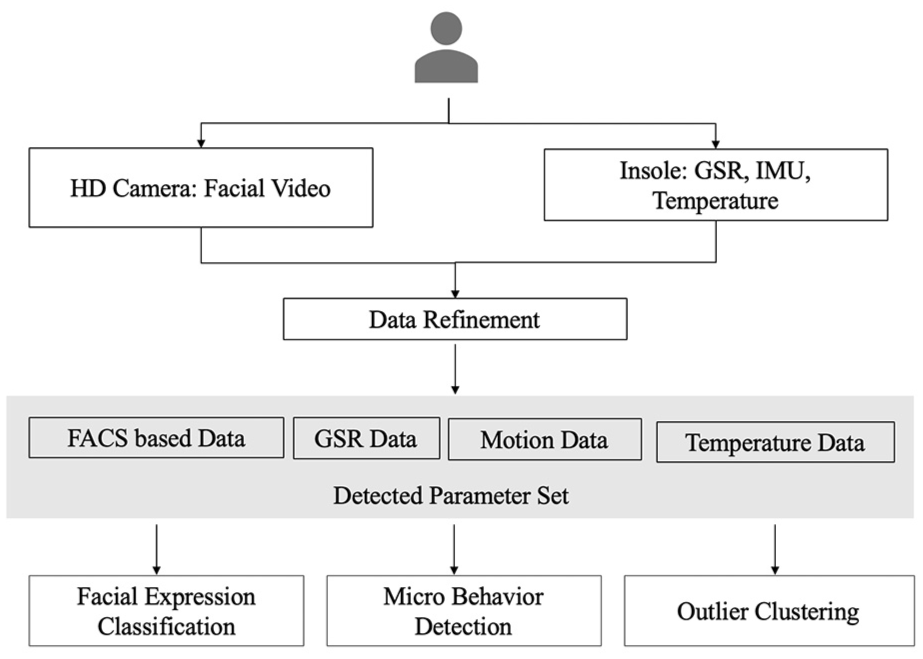
The process of the proposed system.
Insole module for bio-signal detection
Most bio-signal detectors such as EEGs, electrocardiograms, and electromyograms force the specific equipment wear on a specific body position; thereby, the appearance of wearing the device is easily found. In this study, we detected the galvanic skin response (GSR), temperature, and motion variation in a non-intrusive way. The GSR detects the electrical resistance of the skin surface due to sweating caused by the autonomic nervous system. In general, the GSR sensor measures the change in resistance between two points at that time. Two electrodes are attached to the index finger, the middle of the plantar part, and the wrist part, which are the sweaty areas. We excluded fingers and wrists from this position because they are easily exposed to the camera. Instead, we detected the GSR at the position of the insole.
The advantage of such an insole-type bio-signal detection device is that it is not exposed to the camera and it is difficult for the participant to perceive the bio-signal sensor after wearing it for the first time. It has non-intrusive properties compared to the previous bio-signal sensing hardware. 15 For accurate GSR signal detection, the wearer should not move. In this program, our hardware was suitable to operate because the participants were mostly sitting in a closed space, limiting the movement of the legs. We attached the GSR, temperature, and motion sensor to the insole. The insole was connected to the battery and the transmitter was attached to the ankle as a band. Figure 3 shows the hardware modules. The features of each module constituting this hardware are described in the following subsections.

The picture of the insole hardware (above: a signal transmission and battery module and below: a biometric signal detection insole).
Biometric information collection device
Biometric information collection device was developed using Arduino. We used WeMos’s ESP8266 model, which is small enough to be attached to the participant with a WiFi communication function. The built-in Arduino is connected to the mobile battery. WiFi connection is attempted with a WiFi network having a predetermined name, and the biometric information collected through a predetermined internal IP address is transmitted as a message.
Skin conductivity sensor
Grove GSR Skin Sensor Module v1.2 manufactured by the Seeed Studio was used as a skin conductivity sensor at the early stage. As the filming progressed, the electrical signals were accepted using two-line electronic painting on the insole to maintain more stable adhesion to the participant’s foot. In order to obtain a stable graph, the Kalman filter was applied to the raw data.
Infrared temperature sensor
In order to measure the body temperature, we used an infrared temperature sensor. The infrared temperature sensor was modeled using MLX90614 manufactured by SparkFun Inc. Unlike conventional temperature sensors that measure ambient temperature, this sensor is capable of measuring the temperature at one point. The temperature can be measured from −70°C to 380°C, and the measurement resolution is 0.02°C.
Nine-axis inertial measurement unit
We used the 9-degrees of freedom (DoF) Sensor Stick model, which was manufactured by SparkFun Inc. and supports a three-axis accelerometer, a three-axis gyro, and a three-axis magnetometer, to measure the participant movement. The geographical information was used to determine whether the unclassifiable state is caused by the movement of the participant by detecting the leg movement.
Data transmission
The measured values from each sensor are transmitted in one string. The skin conductivity value, the filtered skin conductivity value, the three-axis gyro value, the three-axis acceleration value, the three-axis geomagnetism value, the calculated pitch value, and the roll value were used to identify each sensor value.
Facial expression detection
We used a convolution neural network (CNN)-based facial expression classifier to generate basic expression parameters for outlier detection. We also used an active appearance model (AAM) feature-based SVM classifier for micro-expression detection.
Facial expression classification
Our CNN-based facial expression classifier is an extension of the facial expression classifier used in the study by Ho. 16 The data set used for training the model is from the Kaggle Facial Expression Recognition Challenge 2013 (FER2013). It comprises 35,887 48 × 48-pixel grayscale images of faces each labeled with one of the seven emotion classes (anger, disgust, fear, happiness, sadness, surprise, and neutral). The model consists of three sequential convolution layers (32, 64, and 128 feature maps). Softmax activation function is used at the output layer. The model performs well in classifying the positive emotions, resulting in relatively high-precision scores for the happy class (76.7%) and low-precision scores for the sad class (39.7%). This is because the number of negative emotional data on the FER2013 is less than that of positive emotional data. Our goal is to classify the differences between the participants’ facial expressions rather than classifying the facial expressions. Therefore, we merged the existing four negative emotional expressions (sad, fear, disgust, and anger) into a single negative expression. We used only three parameters—happy, surprised, and negative—for outlier detection. With this adjustment, precision scores for happy, negative, surprised, and neutral became 82.90%, 67.20%, 76.90%, and 61.90%. The accuracy of the negative expression was smaller than the other parameters, but a more reliable classification for negative emotions can be expected. Table 1 shows the confusion matrix of the CNN classifier. We calculated the DTW distance between the four parameters for each participant to detect the outliers.
Confusion matrix of the proposed CNN classifier.

CNN: convolution neural network.
Micro-expression detection
Many micro-facial expression studies have been conducted since the Eckman’s study. 17 Among these, human–computer interaction (HCI) and lie detection 18 are representative micro-behavior detection technologies. Automatic detection of specific micro-behaviors during the broadcast may provide additional information to the production team. In broadcasting, various descriptions of detailed facial expressions are often used as small talk topics. In an entertainment show, when a participant makes an interesting facial expression, that expression is often highlighted and at that moment, the MC starts a surprise small talk with the participant. For this purpose, we investigated the micro-behaviors of participants that can be useful in entertainment broadcasting. We selected the reliable features that can be systematically detected.
To identify the micro-expressions of the participants, we detected facial feature points and established methods for tracking them. The methods of detection of such facial feature points 19 and the applications in various fields have been reported previously.20–22 There are a number of commercial solutions related to these research results. 23 Facial feature points are modeled using an AAM, which is one of the best-known facial feature extraction techniques. 24 Research on AAM-based facial feature point detection25,26 has been conducted using various techniques. We detected the participants’ facial feature points using a generic version of the AAM, rather than using a person-independent AAM. 27 The applicable modules were implemented using OpenCV. Table 2 shows our micro-expression list and related AAMs. For the classification of yawning, biting lips, and nostriling, we used a simple SVM classifier. Thirty test participants were recruited to obtain a labeled training data set, which comprises a total of 900 48 × 48-pixel images. For the detection of eye blinking, closing eyes, and dilated pupils, we used empirical parameters. We adjusted the parameters to be classified as abnormal behaviors when eye blinking occurs more than 20 times per minute or when the eyes are closed for more than 3 s. In summary, a total of 30 feature points, 24 feature edges, and 20 meta parameters were used as input values of the proposed system.
Micro-facial expressions and related AAM.

AAM: active appearance model.
Outlier detection
DTW algorithm
The data obtained in the proposed system are the time-series data. We first decided the specific point in the time series and the interval to be used for behavioral analysis. Participants in this entertainment show have to answer 20 questions, and the response time is limited to 30–60 s. We considered this time a key event and then analyzed the outliers using the participants’ responses during this time. If the question is easy or not important, participants answer the questions without any emotional changes. When the question is difficult or important and affects the dropouts in the first round, the participants show signs of embarrassment. For comparison, we define the similarity score of the acquired time-series data.
DTW is a dynamic programming algorithm that compares the two time series and determines the optimum warping path between two data sets. The definition of DTW is as follows.
Definition 1
A warping path is a sequence
Boundary condition:
Monotonicity condition:
Continuity condition:
Definition 2
For time series

Definition 3
The DTWD is the sum of the pointwise distances along the optimal path

One time series
To calculate the DTWD, the starting and ending points must be clearly defined. If the signal is nearly horizontal, it is difficult to determine the starting and ending points. However, this does not happen in our case because the detection time is limited to the question response time and an alignment point can be defined as a starting point of each question. We applied linear interpolation and compared the points in one signal to the point–point segments in the other to produce better results. We assigned more weight to the expressions of happy and surprised, the scale of expression, the variance in the eye size, and the skin conductance level (Table 3). This is useful especially when the measurements are less precise for stable parts of the time-series data.
Time-series multimodal input data.

CNN: convolution neural network.
Hierarchical clustering
The similarity value among the participants determines which participant will react most distantly. This can be solved using classification or clustering techniques. In our case, it is impossible to apply machine learning-based classification techniques because it is very difficult to obtain prior personalized learning data from participants due to the tight schedule. As for the clustering method, it is difficult to define how many clusters can be detected in advance.
Hierarchical clustering is an algorithm that creates a hierarchy of groups in which, as the level in the hierarchy increases, clusters are created by merging the clusters from the next lower level, such that an ordered sequence of groupings is obtained. 29 In order to decide how the merging is performed, a distance measure between the groups should be specified in addition to the one that is used to calculate the pairwise similarities. However, a specific number of clusters does not need to be specified for the hierarchy to be created and the procedure is deterministic; thus, it will always give the same result for a chosen set of distance measures. We used an agglomerative procedure, every member of the data starts in its own cluster and members are grouped together sequentially based on the distance measure until all members are contained in a single cluster.
To better understand the participants’ behavior, we applied an additional classification technique for post processing. Our system was able to accumulate the participants’ biomedical signals over time. We classified typical signal patterns using these data. We clustered all accumulated bio-signals, selected a representative clustering group, and extracted the representative multimodal patterns by calculating the mean value of the multimodal data of the selected group. This type of template-based method is robust to speed and style variations in the subjects’ motions and potentially requires less training data than feature-based methods. The generated representative pattern can be used as a separate classification criterion when sufficient data are secured in the future. In this study, this technique was used to understand the behavior of the user with limited number of TV show shots.
Experiment results
System installation
Our goal was to analyze the multimodal data in the shooting stage and send the results to the production team in real time. Therefore, we installed the equipment in advance in the studio 1 day before the shooting. The system environment installed for broadcasting is shown in Figure 4. Eight cameras were independently assigned for this system. Images taken by two cameras were sent to a single notebook, and key feature parameters were computed. The calculated key parameters were sent to one PC for outlier analysis. The insole hardware was attached to eight male participants in a preparation room. It took about 2 h for preparation and 12 h for shooting a 1 h program after the recording was started. We had to replace the battery of the insole hardware every 3 h during a break. The size of the recording studio was about 50 m × 100 m. We used three wireless routers for stable WiFi communication. During program recording, eight biometric graphs were visualized on the notebook monitor in real time. One research member sat in front of a PC to handle an unexpected situation that might occur during the program. In addition, we recorded the progress of all programs on the notebook so that the movies can be used in the post editing process.
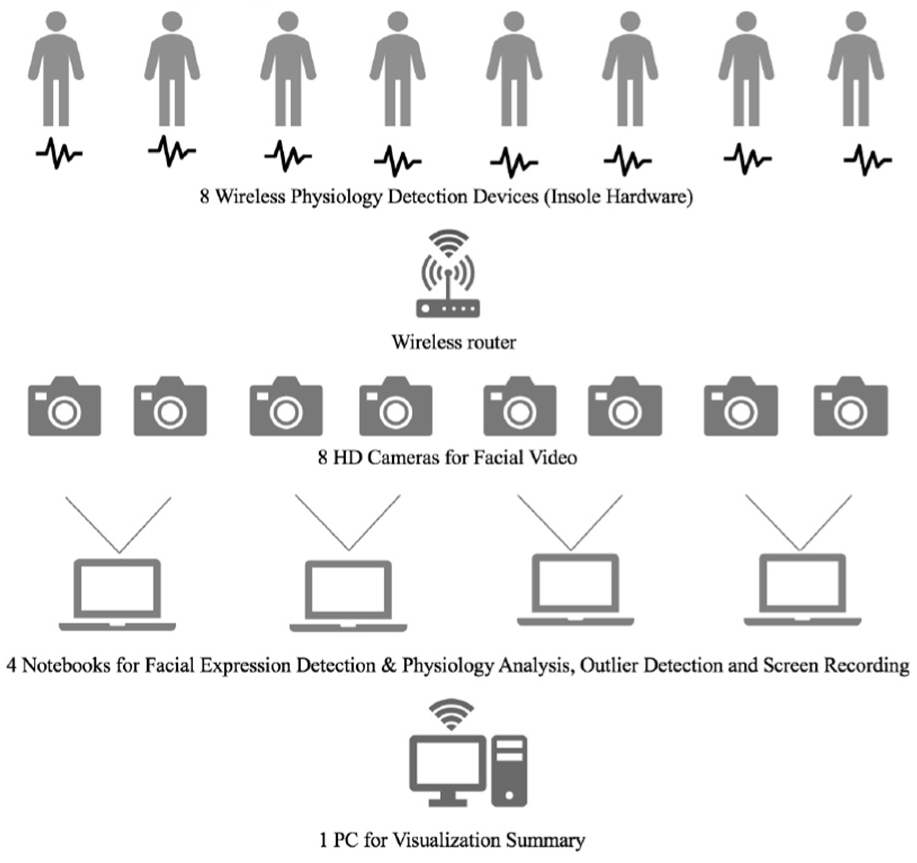
Diagram of system installation at the shooting place.
The program was recorded 11 times in every 2 weeks for 6 months. The total number of participants were 88. The ages of the participants ranged from the early 20s to the mid-30s. Except for a case when the battery and control part were detached in the insole hardware during shooting, the system worked reliably. We developed a separate interface to make it easier for viewers to understand the system results. Figure 5 shows the interface visualization for the actual TV screen.
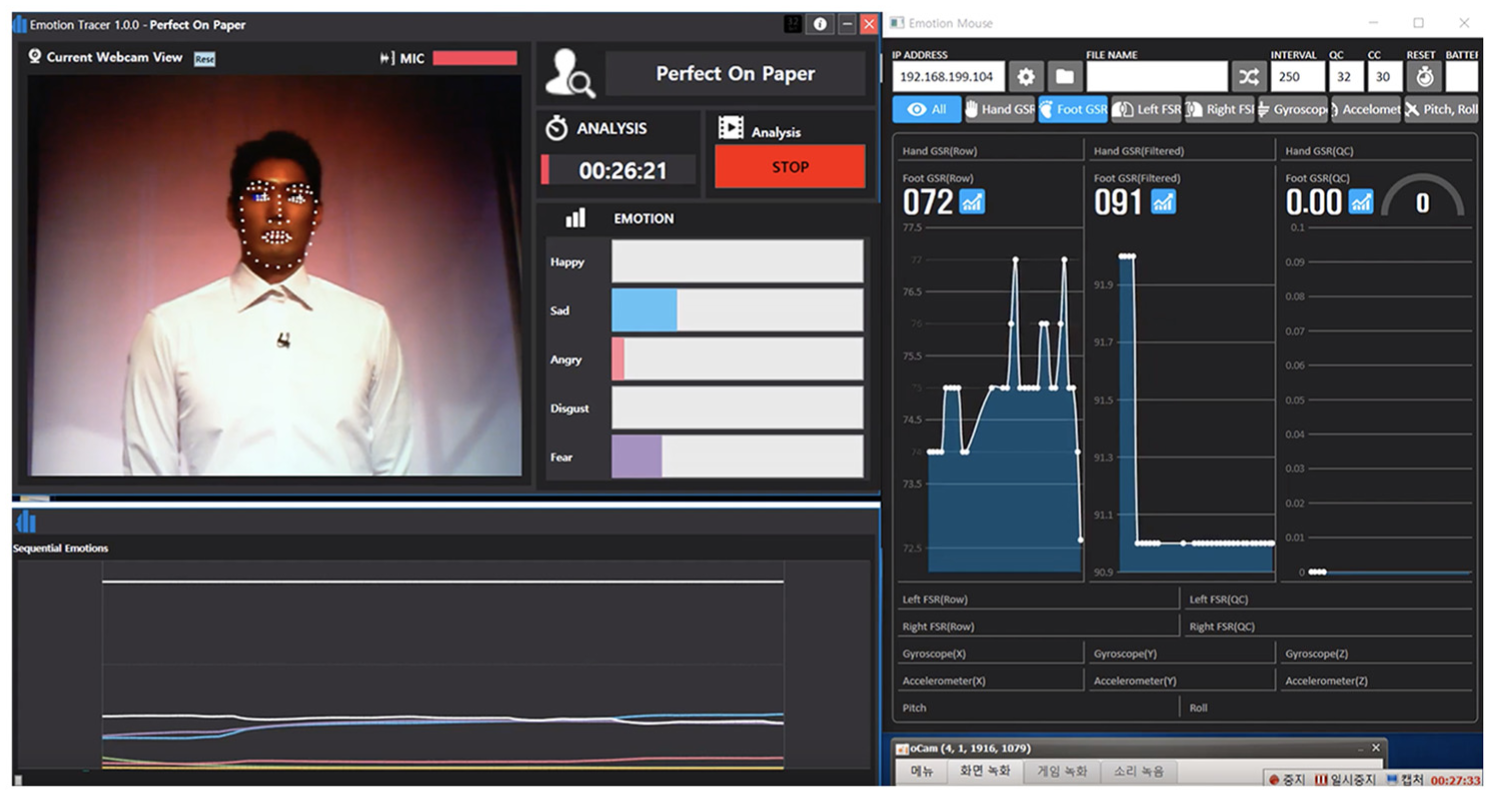
The visualization of the proposed system in an actual TV program.
Outlier detection
A total of 220 (20 questions × 11 shows) outlier detection cases were processed using the system. Table 4 shows the sample questions. Questions can be classified into three categories: (a) behavior pattern: how similar the patterns of life between male and female participants are; (b) opinion: the pros and cons of a controversial issue; and (c) attitude to opposite gender: personal attitude toward the opposite gender. Eight participants responded to each question as they were asked and our system detected the outlier, which represents the abnormal behavior.
Example questions.

MC: master of ceremonies.
After each question, only one or two participants could have additional conversations with the MCs; thus, if more than three groups were searched (1-5-2, 3-1-4, and 2-1-3-2 groups), they would not have to be used in the broadcast. Among these four patterns, we defined patterns 1-7 and 2-6 as prominent outlier detection patterns. Figures 6 and 7 show the outlier detection results—detected signal data and its dendrogram.

1-7 classification signal pattern and its dendrogram: (a)–(d) This pattern accounted for 10% of the total outliers.
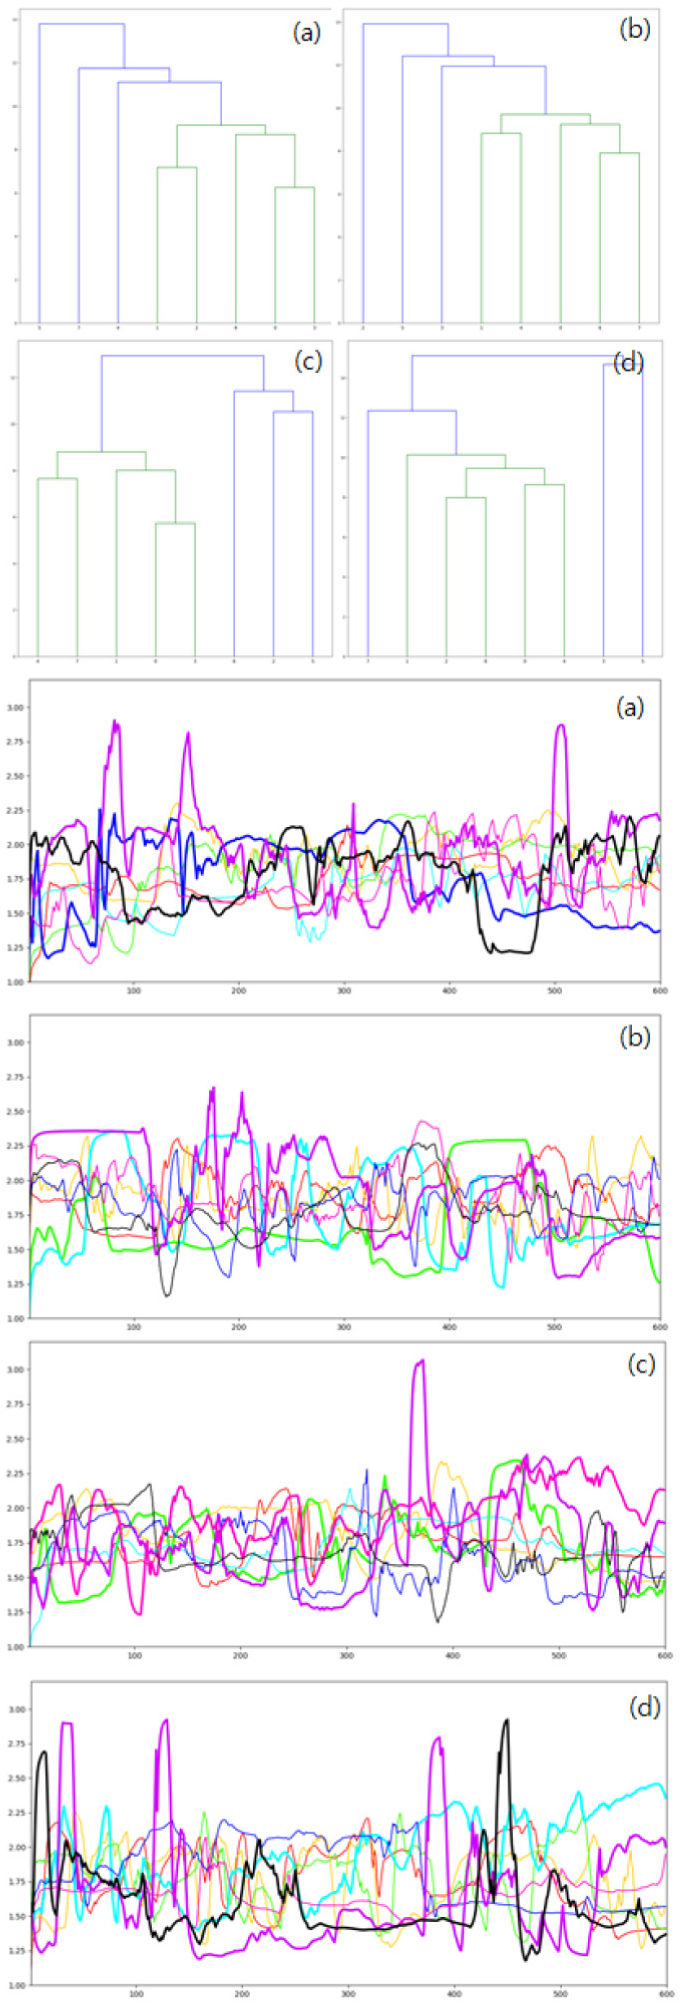
2-6 classification signal pattern and its dendrogram: (a)–(d) This pattern accounted for 14% of the total outliers.
Our system classified one outlier as the 1-7 classification pattern at 10% and two outliers as the 2-6 classification pattern at 14% in total data. The 3-5 and 4-4 classification patterns are shown at 30%, and the other patterns (1-5-2, 3-1-4, and 2-1-3-2) are at 46% in total clustering patterns. Patterns 1-7 and 2-6 were predominant in most questions. Patterns 3-5 and 4-4 occurred mainly in the “Opinion” and “Behavior pattern” question group. In general, the participant responded calmly to question without great emotional changes for these question groups. In these patterns, the changes in vital signs and facial expressions were relatively small.
The outlier signals are generated when signals are highly volatile or very stable relative to others. When such outlier signals were detected in many patterns, we referred to additional micro-behavior analysis results. In the HCI domain, the size and the flicker of the pupil are known to be closely related to the user’s interest. The size of the pupil increases with the curiosity and interest of a certain object. The person who shows the higher frequency of blinking is likely to have higher tension. 30 Based on these results, we assumed that the participant would show relatively positive outlier behavior when pupil growing is detected. Outliers associated with high-frequency blinking were assumed to exhibit relatively negative outlier behaviors.
In the 1-7 classification pattern, the MC generally asked additional questions to the participants who showed specific behaviors based on their positive or negative response. At this time, if the detected outlier scale is relatively high, the participant is informed that such action is detected. When a classification pattern of 2-5 occurred, the MC asked two participants an additional question. When two participants made contradictory claims, it was easy for the production team to set up two confrontation schemes. This confrontation scheme can increase the tension in the program, which can be of interest to the TV viewer.
We were able to identify the characteristic vital signs and facial expression changes that we observed during 11 shooting sessions. In the actual broadcasting environment, the participants often had extreme facial expressions. When a reaction occurred, the majority of facial expressions were often positive. Many surprise facial expressions occurred. Participants were in a neutral state for 81% of the entire recording time; 8% were unable to express emotions because of various idling behaviors (heading and displacement). The change in facial expressions occurred when the actual question was asked. Participants who received many questions had a variety of facial expressions, but the participants who did not receive much attention had gradually disappearing expressions. As the shooting continued for a long time, the changes in the facial expressions of the participants decreased due to fatigue. At the time of filming, the participants rarely moved in a sitting position. However, few participants periodically shook their legs or changed their sitting position, decreasing the accuracy of the GSR sensor. Because our signal detectors have three-axis motion sensors, we treated the received GSR sensor values as exceptions when constant small motion was detected on the motion axis.
Since the shooting lasted for a long time, we could accumulate the related bio-signal data gradually. We identified representative clustering patterns with accumulated bio-signals. We generated a representative pattern for each signal group with mean values of bio-signals extracted from the dendrogram cluster results. The most representative clustering cases are shown in Figure 8 in cyan, purple, green, and orange color. These graphs show the typical response patterns of participants in the program: (a) sharply decreasing, (b) gradually increasing, (c) maintaining high pitch, and (d) maintaining low pitch. All graphs showed a small rise in the initial position of the graph. This shows that a certain amount of multimodal signal changes occurred when the participants heard the questions. The graph (a) “sharply decreasing” pattern showed some psychological stability at first, even though the participants were somewhat disturbed by the question. In the graph (b), “gradually increasing” pattern, the participants did not decrease the strength of multimodal signals, but gradually increased their intensity, indicating that they maintained the tension and excitement during questioning.

Four representative clustering patterns.
To evaluate the usefulness of the detected outlier results, a brief survey was conducted after shooting. The questionnaire in the survey prompted each participant to select the questions that were most upsetting in the first round. We compared the results with the outlier results detected by our system. According to the survey, participants felt psychological agitation against a total of 635 questions. Of the outliers we detected, 72% were the questions that the participants had marked.
After the survey, we conducted a brief interview with the people who showed the most psychological changes and asked what they felt for some questions and why they experienced psychological fluctuations. The reasons for the mental fluctuations are “a fear of the possibility of being dropped if the answer to this question is wrong,”“a worry about whether I should make a choice to get a score even if I tell a lie,”“I did not know when I had to answer,” and “I feel nervous when I have a question and I cannot speak properly.” These psychological feedbacks were the largest negative outlier factors. Through these interviews, we were able to conclude that participants often show outlier behaviors with negative reasons rather than positive ones in the broadcast environment. In about 23% (7/30) of the cases, participants did not feel disturbed in the system-detected questions because of the following reasons: “I usually feel a lot of tension, so I sweat a lot,”“I laughed in the atmosphere because I just laughed formally,” and “I moved my body frequently because I was nervous throughout the broadcast.” Most of these behaviors were due to the personal habits of the participants or were intentional.
Discussion
Classification accuracy
In public broadcasting, classification accuracy is a very sensitive issue. Many existing emotional classifiers show good classification accuracy with fixed image sets but cannot guarantee high classification accuracy for dynamically changing images in real-life situations. The accuracy of the base classifier of machine learning can be low. The broadcasters are concerned about the criticisms of the viewers for the classification results. Fortunately, in this study, the program was an entertaining one and the viewers did not protest against the results of the classification because the analysis was used as additional information for the story flow control.
Feedback
We interviewed the participants and received feedback on their awareness to our devices. Participants wore insole-type hardware in the waiting room with the support of researchers. At the time of attaching these devices, they showed psychologically burdened by the fact that such information was being observed in real time. After they actually got on the air, participants said there was little awareness that they were wearing these equipment because of the tension caused by their broadcast experience at the time of shooting. Particularly, our equipment was inserted into the shoe in the form of an insole. Participants sat in the seat for most of the shooting time, so physical recognition of the device was low and there was no great inconvenience due to adhesion. However, since the MC’s speech during the broadcast was constantly telling the participants about the detection of the bio-signal, it was confirmed that the bio-signal detection awareness was increased. Production teams and MCs were very positive about the additional information provided by our system and hoped to have more information in real time if possible. Production team and MCs always hoped to have continuous interaction between the MC and the participants. They evaluated our results could play roles as interaction triggers by suggesting abnormal signal that the viewer has never experienced before. Most existing TV dating shows have been matched with only the preferences of the participants. This TV show was able to get a lot of curiosity from viewers because it applied emotional analysis technology for the first time in the reality show. Viewers have shown a lot of curiosity in analyzing dating partners with specialized hardware. Especially, the visual information that the biological signal changes in real time received positive feedback in terms of indirect observation of the internal emotional change of the participants.
Polygraph detection
Broadcast production team had high expectations for real-time polygraph detection capabilities used in criminal investigations, but this was not practical in the broadcast environment. If there is a big difference between facial expressions and the physiology, the participant is said to make an intentional facial expression, but it cannot be regarded as a state of lying.
Facial expression detection
The accuracy of the detection of basic facial expressions decreased according to the head movement of the participant. A person who lifts his face upward shows a negative expression. In this case, the participants were requested to change their positions via picket message delivery. In order to avoid such inconvenience, the facial expression classifier based on the three-dimensional image input data is more suitable than the two-dimensional image, but it was difficult to install additional hardware in a limited preparation time.
Setup of the analysis environment
The initial setup of the analysis environment was time-consuming. The day before, the staff had prepared 8 insole modules, 20 extra batteries, and 8 laptops. System stability is very important because more than 100 staff members involved in the program waited in case systematic defects occur. In the event of a problem with the equipment, the time allowed for correcting or replacing it was very short, about 5–10 min. Fortunately, there were few technical failures during the 6-month broadcast period.
Conclusion
This article presents an example of a broadcast application to a reality TV program using a visual-physiology multimodal system. We suggested an insole-type detector module, a DTW-based outlier clustering method, and an AAM-based micro-expression detector. The developed system detects the major outlier behaviors of the participants in the broadcasting shooting stage and produces useful information to the production team in real time, thereby enabling viewers to experience a new technical feedback process that was not available in previous entertainment TV shows. Affective computing technology has a high accuracy in a laboratory environment, but it has a problem that its accuracy is greatly reduced when applied to a real-world environment. The problem is that the multimodal emotion analysis system can have various measurement errors in real world. In this study, we tried to reduce the measurement error by interworking with various broadcasting equipment in actual broadcasting environment. This study showed how the affective computing technology can be applied in actual broadcasting scene and proved its practicality by describing various trials and errors. Through this case, we showed that affective computing technology can be utilized as a fun stimulus element in entertainment domains. This case can be useful for the practical use of the affective computing technology in the future. In the next study, we try to detect the user’s bio-signal remotely in a general video streaming environment and visualize it in the web environment by extending current works.
Footnotes
Acknowledgements
The authors thank Kim, Soojin, and JTBC “Perfect on Paper” production team for their support.
Handling Editor: Naveen Chilamkurti
Declaration of conflicting interests
The author(s) declared no potential conflicts of interest with respect to the research, authorship, and/or publication of this article.
Funding
The author(s) disclosed receipt of the following financial support for the research, authorship, and/or publication of this article: This work was supported by the National Research Foundation of Korea (NRF) grant funded by the Korea government (MSIT) (grant nos NRF-2019R1A2C1002525 and NRF-2018R1C1B5046461).