
Abstract
Currently, large data sets are deployed on large-scale clusters, which require a large amount of physical resources. However, current network architecture does not have flexible deployment, making it difficult to adjust physical resources after deployment. Based on software definition network, this article proposes a framework for building virtual data domain, which establishes a multi-attribute decision model by network nodes for optimizing the deployment of control layer, so as to realize large-scale deployment. By analyzing the actual usage and virtual distribution of the underlying data resources, a mapping algorithm of network resource overhead–allocation ratio is proposed for adjusting the mapping space of network flow based on the mapping result, so as to meet more virtual domain applications. At the same time, the reasonable utilization of resources is helpful to reduce the communication delay in domain. Simulation results show that compared with the shortest path mapping and greedy resource mapping algorithms, the virtual domain established by the network resource overhead–allocation algorithm can improve the resource utilization rate by 10% and reduce the intra-domain communication delay by 30%. Therefore, under the background of the expanding scale of data domain, this framework can solve the problem that the current backward network architecture cannot adapt to the development trend of the information field.
Introduction
With the continuous promotion of big data concepts, analysts using the data sets of technology business analyze them to provide decision makers with data-based decisions. The data set of the technology business has a huge amount of data, and because of the different statistical indicators, the data set has a large personalization difference. At present, some studies are based on large-scale clusters, and the required physical resources are more expensive, which obviously cannot meet the growing demand for data, such as introducing Hadoop Distributed storage computing architectures, HDFS (Hadoop Distributed File System) as a representative of the Distributed File System, Hbase big data processing technology such as a variety of storage model.1–3
Some methods4,5 show cloud computing to provide large data elastic extension, cheaper storage, and computing services, but its service as an infrastructure, platform, and software does not have a service for the data. The data set needs to be service-oriented, dynamic data domain build, different statistics metrics, and business-based data.6–8 Because of the increasing scale of the data domain, it causes the underlying traditional hardware to adapt to this development trend. 9 Under the traditional network architecture, either from the performance of a single network equipment or multiple network equipment structure into consideration, are difficult to support the current rapid development of information demand,10,11 the main reason is the current backward network architecture cannot adapt to the development trend of this kind of big data. To this end, it is necessary to put forward a data domain construction method that adapts to business development under the new network architecture.12,13
Software Definied Network (SDN) is one of the popular new network architectures. 14 It separates the data plane and the control plane, reduces the complexity of the network, and increases the flexibility of network programming. SDN network virtualization technology abstracts and distributes network resources, and increases the sharing of network resources. Since each virtual network is managed by one controller, SDN network mapping should consider not only network resource mapping but also the controller optimization deployment.6,15,16
In this article, SDN is presented under the environment of network virtualization, considering the deployment of the controller, based on the node between centrality and reliability. The article puts forward a kind of multiple attribute decision-making model of controller deployment, optimizing the transmission time delay of control information. In order to achieve the underlying network resources can withstand more virtual data domain to construct, a overhead-network resources allocation algorithm was proposed, used the algorithm to generate virtual data domain mapping, network flow mapping space, realized the domain of information communication and information isolation between domains.
Virtual data domain framework
Virtual data domain is built on the basis of SDN architecture. 17 The data layer contains a data mart and its relationship, the connection between the data layer and control layer virtualization, and the mapping unit between the switch and controller design train of thought, to make the mapping units as independent hardware running between switches and controllers, and as the agreement of the two agents.18–20
Figure 1 is a schematic diagram of the technology virtual data domain based on SDN. The underlying physical network resources located in the data layer SDN, including five nodes and data marts, are connected by the black solid line; on behalf of the link connection, data mart link between nodes constitute the underlying network topology. Agent agreement between the data layer and control layer set each virtual shard ID of fields and, when connected the shard to SDN controller, isolate the data flow between domains and different virtual domain by a separate controller management. At the same time, the agent agreement according to the virtual data fields and the mapping of the real network resources establishes a mapping flow space; as shown in the figure, dashed line represents the virtual technology in the project domain of traffic, and the biopsy of the virtual project of science and technology domain ID is set to slice 1; the dotted line in the figure represents the communication flow of the virtual technology talent domain, and the slice ID of the virtual technology talent field is set to slice 2.
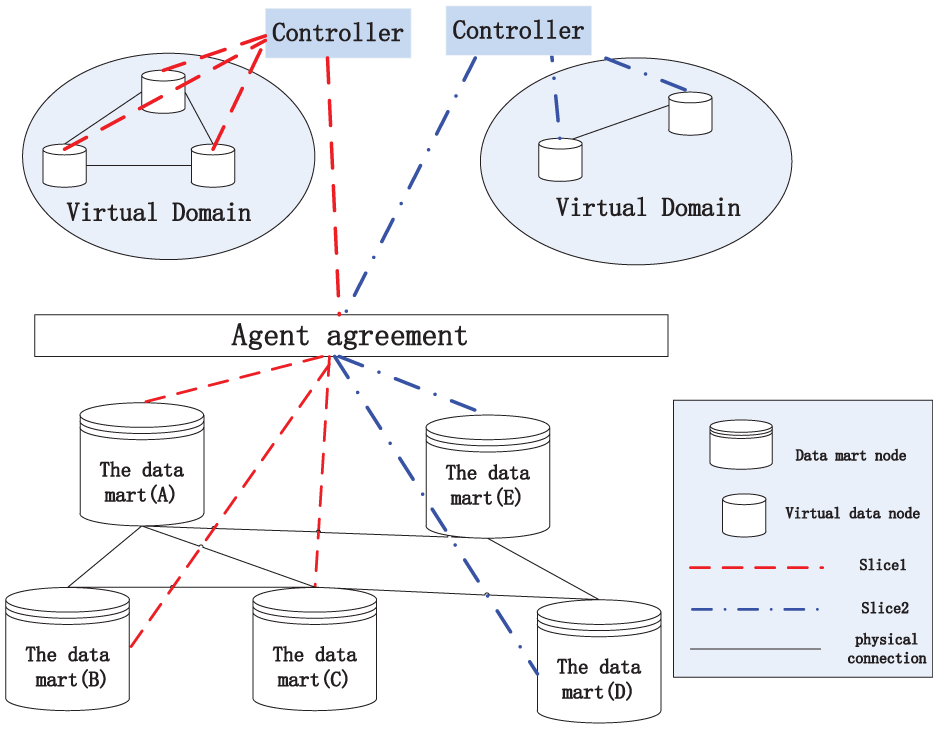
A schematic diagram of a virtual data domain building framework.
Based on the sharding ID of the virtual domain, the controller obtains the control virtual network view resources, constructs the whole network view in the virtual domain, and generates the corresponding flow table items based on the business in the virtual domain. When the flow table item reaches the protocol agent, the flow table item is rewritten according to the established network flow mapping space, and the actual physical resources are realized. Then, according to the mapping rules of the protocol, based on OpenFlow protocol, the data mart node of the corresponding SDN data layer is decentralized to realize the business communication of the data mart node.
This article takes the data of technology business service as an example. According to the field of technology service, the data of technology business are divided into six categories. As shown in Figure 2, business data are divided into project plan of science and technology, science and technology agency, scientific and technological personnel, scientific and technological achievements, innovative service classes, and class statistics yearbook; there are some segments in every kind of small classes, each business data such as a large business data mart.

Technology data mart classification.
Based on the analysis of technology business data, the technology data are divided into six categories. In the data layer of SDN, these six kinds of technology data are different data sets, and each kind of data domain is oriented to a certain kind of data business. When the data required for a business are derived from a number of different data sets, there needs to be a more regional virtual entity data set into a virtual data to support this business field21–23; this can easily integrate physical data set area data and provide the corresponding data resources to support this business. Under the framework of SDN, this article discusses how to set up virtual data domain problems in the virtual cube market based on business requests.24,25
Virtual data domain building
Multi-attribute controller deployment model
The deployment node selected by the controller is closer to the network center, and the forwarding of control information is faster. 26 Therefore, centrality is used as the measurement parameter to evaluate the centrality of nodes in the network topology. If the network has a controller deployment center node for the direct exchange of data, flow of information is most effective; however, if the node network fails, such as the control node failure, the impact on the network is huge. In order to ensure the reliability of the node, the node reliability is also used as the measurement parameter.
Node properties
A network undirected graph is represented by G(V, E), where V represents the node set in the network and E represents the edge set in the network. The number of shortest paths between node i and j is represented by Lij(m), which is the shortest distance between nodes i and j, where m is the number of node paths. Thus, in a network G(V, E), the centripetal definition of any node m is defined as follows

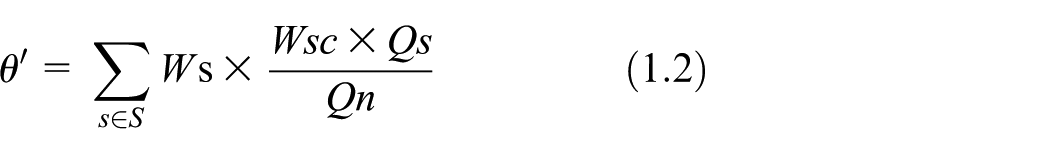
The fault of network components refers to the failure of link or node, and the set of all failures and trouble-free scenes in the network is represented as S. In a network, multiple network component failure probability is small; at the same time, most of the fault is caused by a single node or a single link, and once the failure occurs, the control path fails, as the normal controller cannot control the issuance of the information to all the network elements. Due to this, the failure control path expires and the network node controller is unable to connect to all the nodes. These nodes are defined as inaccessible nodes. In scenario s, where the control path fails due to network component failure, the defined node cannot reach the percentage value of the θ′, and the reliability of the node is represented by θ. WSC represents the probability of failure of the control path under scenario s; Qs represents the number of switch nodes that cannot be connected to the control network after the failure of the control path caused by network element failure in scenario s. Qn represents the total number of nodes in the network

Multi-attribute decision model
For a multi-attribute decision problem, define
1. Define properties

2. When the decision matrix is constructed, the decision matrix is normalized, and the decision matrix after the normalization operation is

3. The linear weighted fusion value of each scheme is obtained, and ui represents the resultant value of linear weighting, and wj represents the weight of each attribute under this scheme. For the decision matrix

4. According to the linear weighted fusion value ui, the scheme set is sorted and the best solution is selected.
Finally, the rows of the selected best option represent the nodes deployed by the controller.
Network resource overhead–allocation ratio mapping algorithm
At the bottom of the data mart with OpenFlow communication protocol, we would set up network topology for the underlying data mart information database, storage resource information of each data mart, and the link between information.27–29 The definition of network topology is represented by the privileges of graph Gs = (Ns, Ls), where Ns represents the data mart collection and Ls represents the physical link set. For the data mart ns ∈ Ns, the data mart node’s compute resources (CPU) and node’s Flowtable Storage and Processing Capabilities (FSPC) represent the two attributes of the node. In the case of physical link ls ∈ Ls, ls is represented by an unordered number, representing the link between two data marts. Bandwidth BW(ls) between links represents its bandwidth resource properties.
The network mapping of a virtual data domain is a subset process of mapping the virtual network graph
1. The node mapping
The data node set of the virtual data domain is defined as
2. The link mapping
The data node links that define the virtual data domain are set as
Figure 3 represents the virtual data domain network mapping. The second half of SDN network virtualization is the real data mart network topology Gs = (Ns, Ls). The data mart nodes are represented by letters, namely, Ns = {A, B, C, D, E}, and the links between them as Ls = {AB, AC, BC, CD, DE}. All physical CPU resources and FSPC resource values in the digital representation node are next to the data mart. The number next to the link represents the total bandwidth of the link.
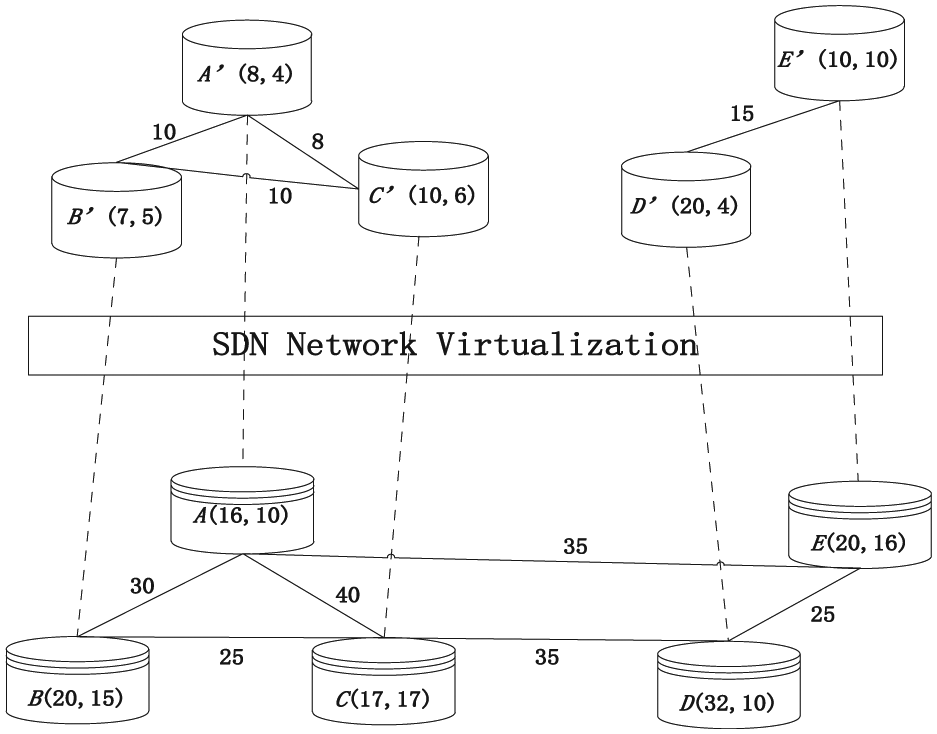
Virtual data domain network mapping.
While trying to establish the virtual data domain, it is important to try and reduce overhead. It is important that the underlying network mapping achieves more data domain application to improve the benefits of physical SDN network while also ensuring the link has the required bandwidth.30,31 When virtual domain applications generate virtual domains, the underlying physical network resource mapping will produce different mapping schemes, put forward the network resource mapping overhead–distribution than the map as a virtual mapping scheme algorithm, to select the optimal mapping solutions. Definitions are as follows:
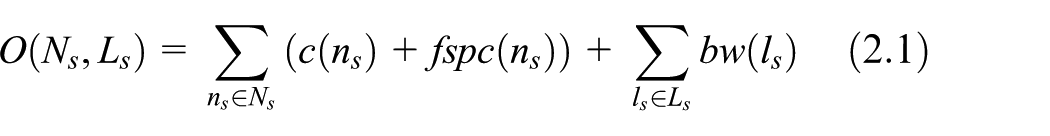
1. The value of the spent resource O(Ns, Ls): The (Ns, Ls) represents a subset of the virtual domain mapped to the underlying network. In this network subset, the total resources allocated to other virtual domains by the underlying network resources are O(Ns, Ls). This includes the underlying data mart node has been assigned to other fields of CPU and FSPC values, as well as the market between nodes allocated the sum of link bandwidth bw(ls), calculate the resource value of the underlying network have been occupied. The larger the number, the more data resources have been used
2. Maximum resource value to be allocated

The maximum bandwidth of the link between the data mart nodes is represented as

Thus, the maximum resource value that can be allocated is represented as

3. Overhead–allocation ratio: β represents the maximum resource value of the resource values that are already spent. When the Network resource overhead–allocation ratio mapping algorithm resources value is smaller, and can be assigned to the resource value, the greater the biggest is calculated to decide the smaller β, network scheme is the better the results show that the mapping, can better allocation of network resources, virtual domain application for the future with more resources, can accept more virtual domain application

Based on the above cost–distribution ratio formula analysis, the virtual network mapping algorithm is as follows. When a virtual data domain application is created, the algorithm input gets the start and end points of the data mart communication and the maximum value of the property requirements in this virtual data domain. Searching algorithm based on deep start and end points searches all paths to determine whether the remaining actual network resources can meet the requirements of virtual data domain attributes, if can meet, get the optimal network to distribute through the overhead—than mapping, the algorithm outputs a virtual network mapping scheme.
Algorithm input: data mart communication starting point A and terminal B, and virtual network properties require CPU, FSPC, and bw values.

Algorithm output: virtual mapping subset
Experimental demonstration
Controller deployment simulation
The experiment uses mininet to simulate the underlying network topology and OpenDaylight as the controller. It sets up eight node numbers; analyzes the node centricity and reliability of the network topology, based on multiple attribute decision-making model; and chooses the optimal deployment of the control node, compared with single parameter network topology centricity method. Figure 4 shows the comparison of the number of routing hops of the controller under the flow table and the control node A in the network topology. The deployment node selected by this method is D. The comparison between the number of routes in the graph shows that, when the control node A is selected, the routing number of the flow table to other nodes will be greater than or equal to the number of selected D nodes as the routing hop of the deployment node. Therefore, it reduces the routing number of the flow table in the controller and saves the cost of routing.

Comparison of the routing number of the flow table of the controller.
Through 10 communication between node B and node E, compare D as the initial communication time of deployment node and A as the deployment node, as well as the arithmetic mean of round-trip delay.Figure 5 shows the experimental comparison results of the two deployment methods. D as the deployment of nodes, the communication time and delay the arithmetic mean of back and forth for the first time is better than A as the deployment of nodes, D than A reference deployment node, effectively reduce the spread of control information.

Control path information communication for the first time comparison.
As the scale of network topology increases, the arithmetic mean of the above initial communication time and round-trip delay is compared in the same experimental environment, and the experimental results are shown in Figure 6. You can see from the picture that, when the underlying network topology of the scale is small, two methods are selectively controller nodes deployment, the controller of the flow table issued time has little effect, and the time performance of the two methods is similar. When the scale of the underlying network increases gradually, the influence of the choice of deployment nodes on the release time process of the controller increases gradually, showed the deployment of nodes to SDN network performance influence, at the same time, by multi-parameter choice model selectively deployed nodes communication time less than the time of the method based on network topology centricity, explain deployment node selection of control by using the method of this article news propagation time less, reducing the transmission delay.
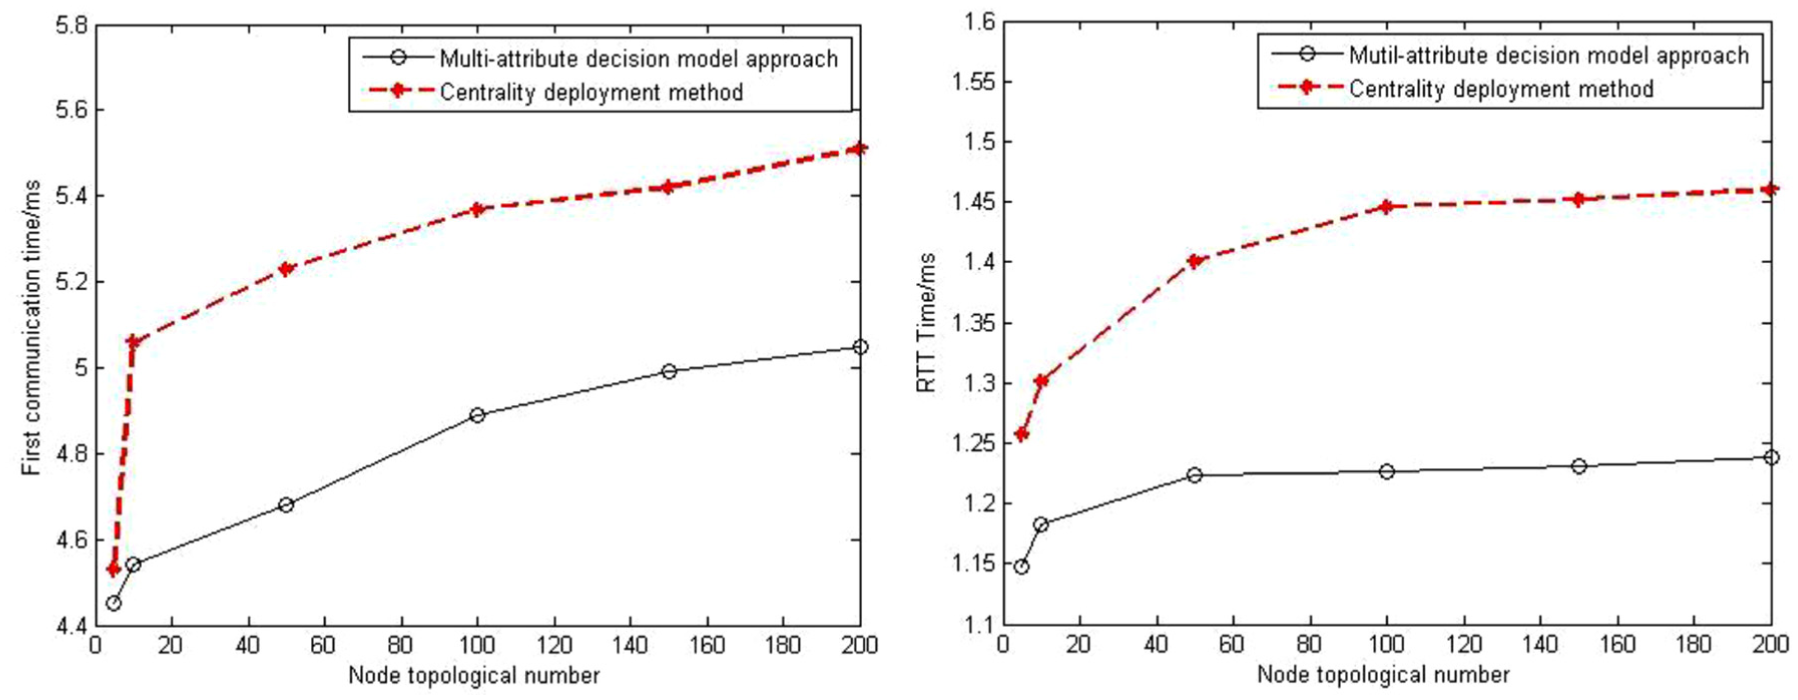
Deployment method network performance comparison.
Virtual mapping algorithm simulation
Through Matlab simulation virtual domain application ground network mapping selection process, the article proposed mapping cost–allocation ratio and shortest path network mapping method. The underlying physical SDN network sets 10, 50, 100, 150, and 200 nodes, respectively, and each pair of nodes in each group is connected with a probability of 0.5. The CPU and FSPC resources of physical nodes and the physical link bandwidth resource are subject to the uniform distribution of 50–100. Virtual nodes in each group, under the network topology generation of CPU and FSPC and link bandwidth resource requirements, subject to the uniform distribution of 0–50 request; the successful acceptance rate and the underlying resource utilization ratio of the two methods are compared.
Figure 7, for the experimental results, shows that the success rate of the two methods is low when the network topology is smaller. However, the cost–allocation is slightly higher than the request acceptance rate for the shortest path mapping scheme. With the increasing of network scale, both methods can accept more application for virtual domain. The reason is that the network topology increases, and the mapping path of the virtual domain request is increased. However, the cost–allocation ratio mapping scheme’s request acceptance rate is higher than the shortest path scheme.

Request acceptance rate comparison.
Experimental results show that, as shown in Figure 8, due to cost–allocation algorithm for virtual network mapping, the physical nodes of CPU and FSPC and physical link bandwidth resources must be considered. However, the shortest path to the virtual network mapping scheme usually considers only the local optimal solution, not from the global network resource usage. Therefore, through the overhead allocation ratio method, the underlying network can accept more virtual domain applications and realize the reasonable utilization of the underlying resources.

Comparison of resource utilization.
Virtual data domain building simulation
The experiment takes the technology business data. There are five data sets at the bottom, the CPU and FSPC resources of each data mart, and the data mart IP information as shown in Table 1. These data sets belong to different physical locations and constitute the underlying data network topology. The control layer adopts OpenDaylight controller, and each virtual data domain is controlled by a single controller. As an agent between the control layer and the data layer, the protocol manages the underlying data set, the city domain information, and the mapping between the virtual domain and the real domain.
Data mart resource information table.

CPU: compute resources; FSPC: Flowtable Storage and Processing Capabilities.
When the agreement is successful, the agreement and the underlying data mart, through the OpenFlow protocol, information communication is established to obtain the resource information of each data mart and the link information between them, so as to build the undirected graph Gs = (Ns, Ls). The underlying data mart information obtained by the protocol is shown in Table 1, including the data mart name, CPU resource, FSPC resource, and IP. For example, the name of the data mart is a set of science and technology projects, which is represented by B, and the data mart node has all CPU resources as CPU(B) = 20, FSPC resource is FSPC(B) = 15, and its IP address is set to 10.0.1.1.
At the same time, the protocol agent should also construct the network link of the data mart, which is represented by an ordered number, whose property represents the total bandwidth of the link. This is shown in Table 2. Link AB represents the link between data mart A and data mart B, and its value represents the link transmission data capability.
Data mart link information table.

For the virtual framework of Figure 1, the science and technology project set (B), the science and technology talent set (A), and the science and technology organization (C) virtualization are used as the technology project domain. The innovation service set (E) and the technology achievement set (D) virtualization are used as the domain of scientific and technological achievements. When it is necessary to construct the talent achievement domain, the data come from the scientific and technological talent set (A) and the scientific and technological achievement set (D). Network mapping scheme is proposed in this article, and compares the greedy resource mapping scheme with the shortest path mapping scheme, respectively, under the condition of the same network set up three kinds of scheme of virtual data fields, achieve 10 D and A data mart node communication, statistical separate network performance, comparing results as shown in Figure 9. Due to the limited data set and communication time in the experiment, the time comparison of different virtual mapping schemes does not differ much. Therefore, in the following experiments, the scale of the underlying data domain is increased, and the time difference between different virtual mapping schemes is highlighted.

Virtual mapping scheme comparison.
The first communication time in A-B-C-D virtual map is the time when the controller is translated by the controller via the protocol agent to add the flow table rule to the data mart node. As can be seen from the figure, the initial communication time of the A-B-C-D virtual mapping scheme is the least, indicating that the flow table processing capacity (FSPC) of the data mart node is faster than other schemes. Three experimental schemes from 10 D data mart node to node A data mart of information communication, the results showed A-B-C-D scheme of average time less than other schemes, suggests A-B-C-D scheme of CPU processing information ability is better than other schemes. However, the fastest time in 10 communications is the A-C-D scheme, which indicates that A-B-C-D is the cost of A certain path.
In the same experimental environment, 30 underlying data domains are set; each data domain is connected by 0.5 probability, and the CPU, FSPC, and BW resource values of each data domain node are subject to the uniform distribution of 50–100. Set each number per unit time is 1/m, simulated users have four units of time to build application processes and virtual data fields, 10 times each request virtual node number obey uniform distribution of 3–6, application of resources value obey uniform distribution of 0–30. The average delay and maximum delay of the network resource-cost mapping scheme, the greedy resource mapping scheme, and the shortest path mapping scheme are compared.
Figure 10 describes the average delay (left) and maximum delay (right) of the three mapping schemes, as the application of virtual data domains increases. The network resource overhead–allocation ratio mapping algorithm has the shortest average delay and is stable at 7.08 ms, which is 29% and 35% less than the greedy resource mapping algorithm (10.08 ms) and the shortest path resource mapping algorithm (11.06 ms). The main reason is that the network resource mapping algorithm from the whole plan pays close attention to the overall resources value and has been assigned to other virtual data domain resource value, while the other two algorithms are only considering the local optimum, not considering from global mapping scheme than the situation of resources. The maximum time-delay index shows that the network resource overhead–allocation ratio mapping algorithm has the smallest delay, about 8.08 ms.

Average control delay and maximum control time delay comparison.
Figure 11 compares the cost of the three mapping schemes—the allocation ratio. By formula 710, the underlying resource has been allocated to other resource data values when the overhead of virtual request allocation is greater than that of mapping algorithm, with the continuous application of the virtual domain, network resources cost allocation overhead than mapping algorithm-distribution than steady at 62%; Compared with greedy resource mapping algorithm (74%) and shortest path resource mapping algorithm (81%).

Mapping overhead–allocation ratio.
Because the shortest path mapping scheme is in virtual network mapping, many factors are not considered, so the effect is the worst. For most virtual mapping requests, the optimal virtual map can be found in the tanxin resource mapping scheme, so it is better than the shortest path mapping scheme. The network resource overhead–allocation ratio mapping scheme considers the underlying resources and the actual occupied resources of the mapping completely.
Conclusion
Under the new network architecture, this article discusses SDN controller deployment issues. The controller deployment of multiple attribute decision-making model is set up, and a mapping algorithm is put forward in view of the virtual data domain when applying for establishment of overhead—distribution network resources. Through a simulation experiment, the realization of virtual mapping of data against real data domains is achieved and guarantees to build a virtual data domain communication; the greedy resource mapping algorithm and the shortest path algorithm reduce the communication time delay of the virtual domain and realize the effective utilization of the underlying resources.
However, the method proposed in this article still has some shortcomings. For example, when the underlying network facilities are mapped with multiple virtual networks, if a single underlying network device fails, multiple virtual networks will be affected. Therefore, ensure that no uniqueness exists for each underlying network device. The research on this problem can be combined with the virtual data domain construction framework proposed in this article to establish backup resource data nodes and dynamically update the resource usage of the entire network, and further in-depth research can be conducted.
Footnotes
Handling Editor: Luca Reggiani
Declaration of conflicting interests
The author(s) declared no potential conflicts of interest with respect to the research, authorship, and/or publication of this article.
Funding
The author(s) disclosed receipt of the following financial support for the research, authorship, and/or publication of this article: The authors acknowledge the National Natural Science Foundation of China (Grant: 61373160), the Standardization Processing and Application System Development of Science and Technology’s Big Data (Grant: 17210113D), and Science and Technology Resource Survey, Statistical Analysis and System Development (Grant: 179676334D).