
Abstract
Human movement is closely linked with muscle activities. Research has indicated that predicting human movements with surface electromyography signals is feasible. However, the classification accuracy of surface electromyography signal–based movements is still limited due to the low signal to noise ratio, especially when multiple movement categories are investigated. In this study, six representative time-domain feature extraction techniques and four frequency-domain feature extraction techniques with three different types of classifiers (the statistical classifier Gaussian mixture model, the neural network classifier multilayer perceptron, and the ensemble method AdaBoost) were applied for the recognition of 52 movements in Non-Invasive Adaptive Prosthetics database 1. From the experimental results, we observed that the performance of Gaussian mixture model was superior to that of the multilayer perceptron in both classification accuracy and computational load. When AdaBoost was introduced into the multilayer perceptron, the classification accuracy significantly improved, such that the performance was comparable with that of the Gaussian mixture model. Using the combination of the Gaussian mixture model and the mean of absolute value, we achieved an accuracy rate of 89.5% for the classification of the 52 movements, which was much higher than the 76% rate reported in previous studies.
Introduction
Surface electromyography (sEMG) is a measuring technique that involves placing electrodes on human skin overlying muscles to detect the electrical activity during muscle contractions. A lot of research has indicated that it is possible to predict motion intention through the analysis of sEMG signals, 1 and the corresponding technique can be used to develop control interfaces. This kind of human computer interface is also called the muscle-computer interface (muCI). 2 The muCI has many applications; for example, it can be used in hand prosthetics, 3 exoskeletons,4,5 game control, 6 and tele-operating systems. 7 Thanks to the rapid development of sensing technology, the performance of sEMG systems has become more stable. Therefore, more attention has been placed on myoelectric control systems.
In recent decades, researchers have concentrated on developing sEMG-based systems to identify movements as accurately as possible. To name a few studies on this topic, two channels of sEMG signals were analyzed for four different elbow and forearm movements. 8 sEMG signals were collected from four muscles located on the forearm for the classification of six hand movements. 9 Four pairs of surface electrodes were utilized to collect sEMG signals for the classification of seven hand movements. 10 Other studies worked on human movement prediction with more surface electrodes, such as 16, 11 22, 12 or even more sEMG electrodes.13,14 It is generally understood that more muscle information is collected with an increase in the number of sEMG channels. However, due to the finite skin area and limited muscles in the forearm, there is a limit to the number of sEMG channels that can be increased. Since human hand movements are characterized by 21 degrees of freedom (DOFs) under the control of 29 superficial and deep muscles, 15 some of which may not be sensed by surface electrodes. Therefore, it was our opinion that the introduction of novel feature extraction methods and classification algorithms would be of great importance in improving the performance of systems.16,17
Kuzborskij et al. 18 compared seven feature extraction methods and four classifiers using a database that consisted of sEMG signals collected from 27 intact subjects as they performed 52 hand movements. The experimental results showed that although discrete wavelet transform (DWT) was a powerful feature extraction method and was successfully applied to various scenarios, its classification accuracy was not higher compared with some simple time-domain methods. The same conclusion was drawn in Atzori et al. 19 and Englehart and Hudgins. 20 Phinyomark et al. 21 studied 37 features in time-domain and frequency-domain for the classification of sEMG signals and showed that accuracy rate of frequency-domain features was lower, and computation was more complex than that of time-domain features. There have also been some studies in which the frequency-domain features produced the best results.22,23 Actually, for different applications, the feature extraction methods may also introduce different results. To study the influence of different features on the classification of human movements, six features in time-domain and four features in frequency-domain were investigated in this study.
The support vector machine (SVM), 24 K-means, 25 artificial neural network,26–30 and linear discriminant analysis (LDA)18,19,31 are commonly used for sEMG-based movement control systems. A comparative study of K-means, LDA, SVM, and random forest was analyzed in Atzori et al., 31 which showed that the highest recognition accuracy of intact subjects was produced by the random forest, but for amputated subjects, the SVM showed the best performance. Huang et al. 32 compared the performances of LDA, Gaussian mixture model (GMM), multilayer perceptron (MLP), and linear perceptron (LP) for the classification of six movements collected from 12 subjects. The results demonstrated the effectiveness of the GMM in terms of its higher accuracy rate and lower computational load. However, all of these experimental results can only be considered as a qualitative evaluation of the algorithms because the experimental setup and protocol in these studies were different. To overcome this problem, we relied on a publicly available database for our study named the Non-Invasive Adaptive Prosthetics (NinaPro), which has been applied in many studies. The database contained three sub-databases collected from 78 subjects consisting of 67 intact subjects, as well as 11 trans-radial amputated subjects. The three databases contained in NinaPro were named database 1, database 2, and database 3, which included different types of movements that were acquired by using different devices. Since the data acquisition device of database 1 was different from that of database 2 and 3, only the movements contained in database 1 were analyzed in this study.
Many classifiers have applied to the classification of movements in NinaPro database 1, and relatively high accuracy rates have been reported.18,19,33 However, the use of a single classifier is still limited, particularly when it is applied for sEMG signals classification, 34 because sEMG signals are weak signals that are sensitive to many factors, including electrode displacement, muscle fatigue, and signal recording environment. In order to develop a myoelectric control system with high recognition accuracy, and stable performance, we investigated three different kinds of classifiers in this study: the neural network MLP, the statistical classifier GMM and the adaptive boosting (AdaBoost) ensemble learning method.
The article is organized as follows: the “Materials and methods” section describes the data applied in this study and the feature extraction methods. The “Methodology” section presents the classifiers and the evaluation method. The “Discussion” section details the classification results of each of the movements and the effect of windowing technique on classification accuracy. Classification results with combined features are also presented in this section. The conclusions are detailed in the “Conclusion” section.
Materials and methods
Data description
The database used in this study was from the NinaPro project. This project consisted of three databases including data from 67 intact subjects and 11 hand-amputated subjects as they performed repetitive movements.35,36 The database 1 applied in this study included sEMG signals collected from 27 intact subjects as they performed 52 movements (rest excluded) with 10 MyoBock sEMG electrodes.
The 52 movements were divided into three exercises according to movements and force patterns, as Table 1 shows. Exercise A included 12 basic finger movements, which consisted of the individual flexion and extension of five fingers, as well as the abduction and adduction of the thumb. Exercise B included eight isotonic and isometric hand configurations (e.g. thumb up, or pointing index), as well as nine basic wrist movements (e.g. wrist pronation, wrist flexion, etc.). Exercise C included 23 grasping and functional movements (e.g. large-diameter or fixed-hook grasp). All three different types of exercises were analyzed in this study.
Movements description. 31

For the experimental configuration of database 1, 10 electrodes with a 100 Hz sampling rate were applied, among which eight electrodes were placed on the forearm at a certain distance from the elbow joint, and the other two electrodes are placed on flexor digitorum superficialis and the extensor digitorum superficialis. A detailed illustration of the experimental setup can be found in Atzori et al. 31
Feature extraction
The features that have been applied in myoelectric signal processing can be divided into four categories: time-domain features, frequency-domain features, time-frequency domain features, and spatial domain features. Among these four categories, time-domain and frequency-domain features were applied in this study due to their lower computational complexity compared with the other two types of features. The non-stationary property of myoelectric signals demands the features to be extracted with the sliding window technique, as shown in Figure 1. Overlapped windowing technique was applied in this study, the number of which depended on movement duration. For each analysis window, one feature was extracted for each channel. After features of all windows had been extracted, a classification decision would be made by the selected classifier.

Illustration of feature extraction and classification. Only a single channel was potted for simplicity.
These features were mathematically defined as follows.
Root mean square (RMS)

where
Mean of absolute value (MAV) 14
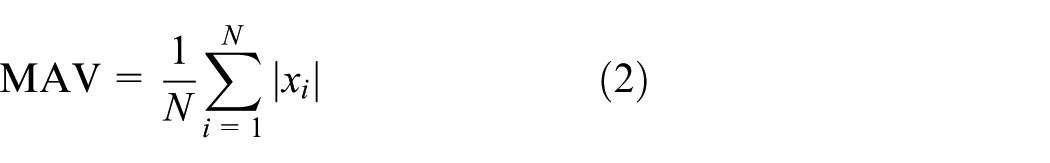
where MAV is a reflection of muscle contraction levels.
Variance (VAR) 14

where VAR measures the power of the myoelectric signal.
Waveform length (WL)
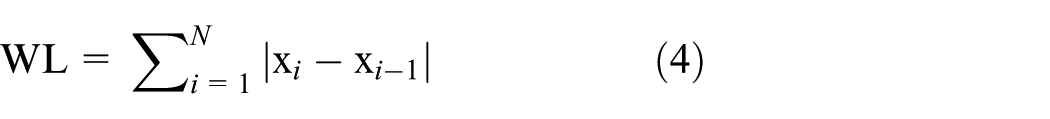
The amplitude, duration, and frequency of the signal can be measured with WL.
Slope sign change (SSC)


where
Integrated absolute value (IAV)

IAV, also called IEMG is related to the signal sequence firing point. 23
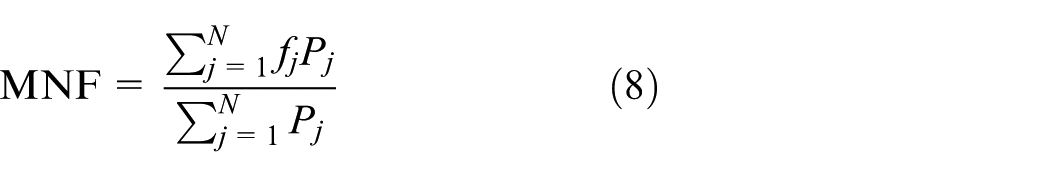
Mean frequency (MNF)
where
Median frequency (MDF)

MDF is a half of the total power of the signals in current window.
Mean Power (MNP)
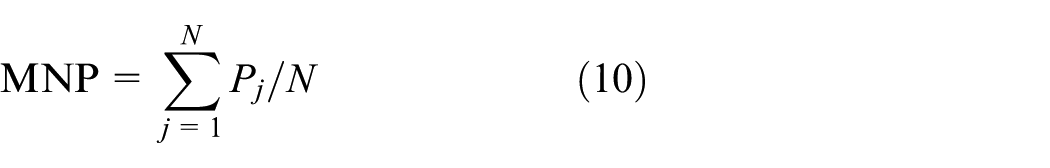
MNP is the mean power spectrum of signals in current window.
Peak frequency (PKF)

PKF is the location of frequency where there is the maximum power.
Since the sampling frequency of the 10-channel myoelectric signals was 100 Hz in this study, the window size was empirically set to 500 ms, and N was obtained by multiplying 100 Hz and 500 ms to get 50. The overlap of the two consecutive windows was set to 20 ms.
Methodology
In addition to feature extraction methods, classifiers also play a key role in the performance of myoelectric control systems. Among the many known pattern recognition algorithms, the statistical method, machine learning, and the neural network are the three main historical strands. 37 In this study, the GMM and the MLP which may represent the statistical method and the neural network, respectively, were applied. In addition, the AdaBoost ensemble learning method was also applied with MLP to enhance the system performance.
GMM
The GMM, which can be viewed as the weighted sum of several Gaussian components that best approximate the inputs, 38 was described as follows


where

The parameters of the GMM included mixture weights, mean vectors, and covariance matrix. By estimating the parameters with training samples, we were able to obtain the distributions of the training samples of each category. In the case of M categories, the probability of each test sample belonging to each category could be calculated as follows.
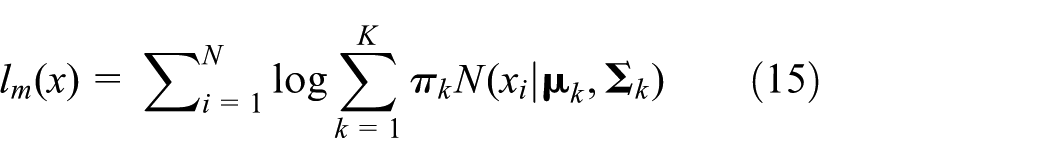
where m = 1,2, … , M. The test sample belonged to the category with the maximum logarithmic likelihood.
MLP
The MLP applied in this study consisted of three layers: an input layer, a hidden layer, and an output layer. All three layers were fully connected. In order to better train the network with the given training samples, a back propagation (BP) algorithm was applied. There were two phases of computation during network training. In the first phase, the weights remained unchanged, while the functions of signals were computed neuron by neuron. In the second phase, the error signals of the output layer were passed leftward, 39 and the local gradient of each neuron was recursively calculated for the whole network. In this study, the activation functions of the output layer and hidden layers that were applied were both logistic functions expressed as follows:

where
For practical applications, the duration of each movement was different, and due to the limitation of the MLP, a time normalization was applied to make all the movements the same length. Therefore, the inputs to the MLP network were feature vectors formed by concatenating the features calculated from each sEMG channel.
Multi-class AdaBoost learning scheme
AdaBoost is capable of combining a series of base classifiers into a more powerful classifier. As an ensemble method, AdaBoost has exhibited excellent performance in improving the generalization performance of a classifier. The algorithm has also been successfully used to solve two-class classification problems. 40 When AdaBoost is applied to solve multi-class problems, the researcher usually reduces these problems into multiple two-class problems. 41 In this study, k(k – 1) / 2 two-class classifiers were needed for the case of k categories, which were too many when k is large.
Unlike previous studies, the AdaBoost algorithm applied in our study was extended to solve multi-class problems without changing them into multiple two-class classifiers. The algorithm, which was easy, much faster to implement than traditional methods was implemented as follows:
Given N training set

where
The multi-class AdaBoost-MLP network proposed in this study worked as follows.
Initialize the weights of all the training samples as follows:


For m = 1, 2, … , M (M is the number of MLP networks): Train the MLP network Compute error
where Compute the weight of the mth MLP network
Update all the training samples’ weight distribution as follows:
where


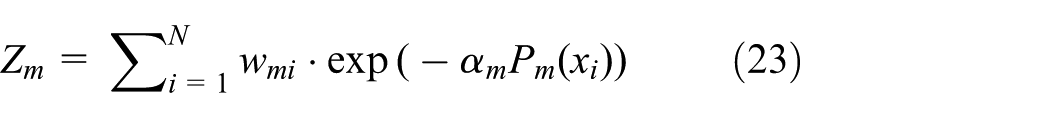

The final classifier can then be expressed as follows

Evaluation
The performance of the classifiers was evaluated from three indices: classification accuracy, averaged training time cost, and averaged recognition time cost. The classification accuracy (Ac) applied in this study was defined as follows

For calculation of the number of correctly recognized movements, confusion matrix is applied, which was obtained by totaling the confusion matrices of all the subjects. The number of correctly recognized movements equaled the sum of the elements on diagonal. Moreover, the total number of the elements amounted to the sum of the movements in each row.
Experimental results and analysis
To assess the performance of proposed feature representations and classification algorithms, we considered four sets of movements with different sizes: exercise A, with 12 movements, exercise B, with 17 movements, exercise C, with 23 movements, and all the 52 movements contained within the NinaPro database 1. The description of these movements can be found in “Materials and methods” section. For each movement type of 10 repetitions, the training indices were
Performance evaluation of the GMM
As described earlier, the Gaussian mixture density is the weighted sum of several component densities. In order to accurately match the distribution of the training samples, it is usually understood that the greater the number of mixture components, the closer the approximation is. However, one characteristic of sEMG signals is that the signals are weak; the useful signals are easily buried in noise. In order to search for the optimal estimation of the signals, we investigated the effect of the number of mixture components on the classification results in this study.
Figure 2 shows the classification accuracy for different numbers of mixture component for exercise A, exercise B, and exercise C in NinaPro database 1. As the figure shows, the accuracy rate decreased significantly as the number of mixture components increased. The maximum accuracy rate occurred when the number of mixture component was 1 for all three exercises. The same conclusion was drawn in Huang et al., 32 which proved that increasing the number of mixture components does not ensure an increase in accuracy rate. Moreover, the computational cost increased significantly as the number of mixture components increased. Therefore, we set the optimal number of mixture components to 1 in this study after considering the accuracy rate and computational cost.

Averaged classification accuracy rates across all the 27 subjects for different number of mixture components by using MAV as feature representation.
Classification accuracies with different features
Figure 3 shows the classification accuracy of exercise A, exercise B, exercise C, and all 52 movements in NinaPro database 1 with the 10 feature extraction methods when the mixture number of the GMM was set to 1. As the figure shows, MAV achieved the highest classification accuracy for all the four movement sets, followed closely by RMS, IAV, WL, and VAR. The classification accuracies of SSC and MNF were much lower compared with those of the other methods. Actually, SSC can be viewed as a measure of frequency information of EMG signals that were defined in the time-domain. 21 Their distributions in space were similar. If we sorted the classification accuracies in descending order, the results showed that the performance of the time-domain features were much better than that of the frequency-domain features.
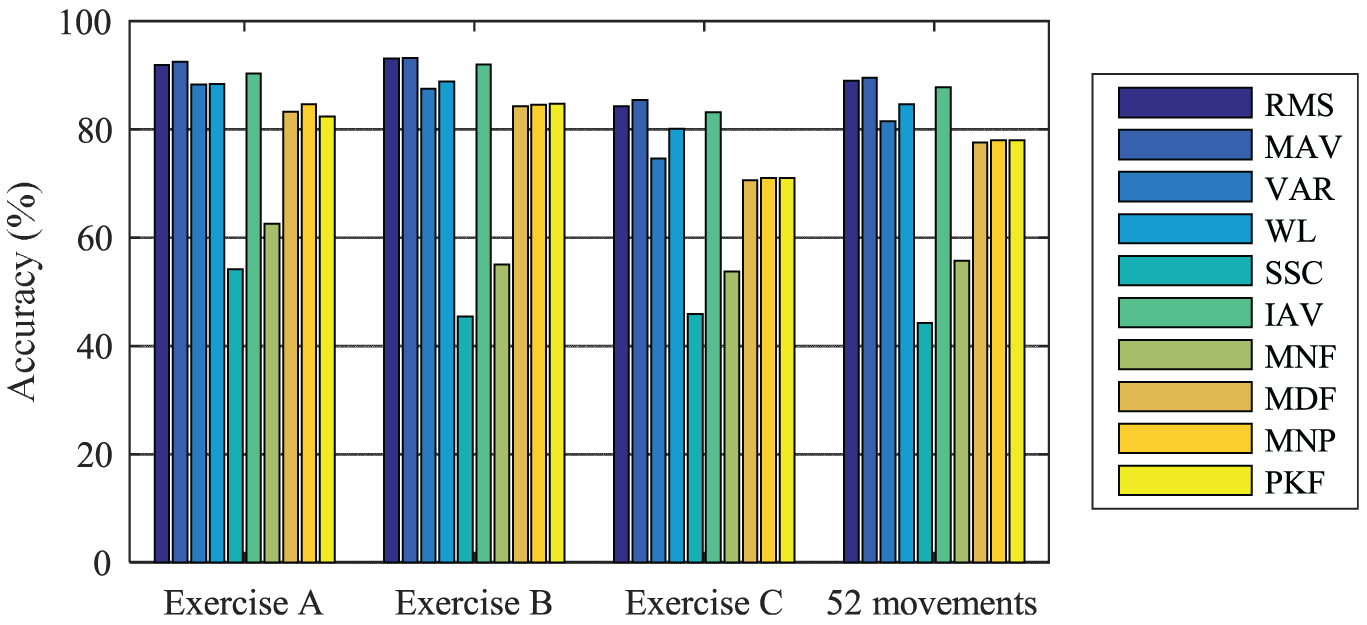
Average classification accuracies over 27 subjects in NinaPro database 1 with the 10 feature extraction methods using the GMM.
Influence of duration normalization on classification accuracies
The signals used above first went through a time-normalization process. Then, the features of the duration fixed signals were extracted from each of the 10 sEMG channels. We also studied the classification accuracies of the 52 movements when a movement’s duration was normalized to different scales. Figure 4 shows the corresponding results. In Figure 4, the maximum accuracies of each feature are denoted by the text above the bar. As the figure shows, the classification accuracies dropped considerably as movement duration was normalized from 500 ms to 100 ms. The highest classification accuracy, 90%, was obtained using MAV when movements were unscaled, which was much higher than the best results (around 76%) that were reported by Kuzborskij et al. 18 and Atzori et al., 19 which was obtained by using the SVM with the radial basis function (RBF) kernel, or the MLP, and K-nearest neighbor (k-NN) with combinations of features in the time-domain and frequency-domain. The comparison of the experimental results proved the effectiveness of the GMM in sEMG-based movement classification.

Classification accuracies of the 52 movements when movements are normalized in different scales by using the GMM.
Performance evaluation of the MLP
Previous studies 18 applied the MLP to the classification of all the movements (rest included) in NinaPro database 1. Hence, the MLP was taken as the baseline classifier to evaluate the proposed classifiers and feature extraction methods in this study.
For the 52 movements with 10 repetitions, half of the repetitions were used as training samples, and the remaining samples were used as testing samples as described earlier. Therefore, the number of training samples and testing sample was both 260. The optimal number of hidden units was found by using the grid-search method. The search range was set to
For the movement classification with features, Figure 4 shows that the time-domain features had higher classification accuracy rates compared with the frequency-domain features. Therefore, six time-domain features (RMS, MAV, VAR, WL, SSC, and IAV) were used for the evaluation of the MLP.
The classification results were summarized in Figure 5. To eliminate the sensitivity of the classification results due to different subjects, the results in Figure 5 were averaged to obtain classification accuracies across all 27 subjects. From Figure 5, it can be seen that the best classification accuracies for exercise A, exercise B, exercise C, and the 52 movements were 88.0%, 86.3%, 75.7%, and 75.2%, respectively, which were obtained either through RMS or MAV. The best classification result of the 52 movements was comparable to the best results reported by Kuzborskij et al. 18 and Atzori et al. 19

Average classification accuracies over 27 subjects in NinaPro database 1 with the MLP.
Aside from classification accuracy, the computational training and recognition time cost were also two indices that were also considered for practical applications, especially the recognition time cost. Table 2 shows the computational time cost for training the same training samples that were used to obtain the best classification results for exercise A in Figures 4 and 5. For the GMM classifier, the number of mixture components was set to 1, and for the MLP, there were 32 hidden units with 1000 maximum iterations. The total number of training samples was 60 in both cases.
Average computational time cost for the GMM and the MLP.

GMM: Gaussian mixture model; MLP: multilayer perceptron.
From Table 2, one can observe that the computational time cost for training the GMM was much lower than that of the MLP. Although the recognition time cost of the GMM was more than that of the MLP, it was still fast enough for real-time applications. Considering the accuracy rate and the computational training and recognition time cost, we found that the GMM was superior to MLP both in terms of higher accuracy and lower computational training time cost.
Performance evaluation of AdaBoost
The AdaBoost algorithm is one of the most successful algorithms in the field of machine learning. To enhance the classification accuracy of sEMG-based control system, we studied the AdaBoost with MLP as base classifiers.
Figure 6 shows the average classification accuracy of the AdaBoost-MLP with respect to different numbers of MLPs. From Figure 6, it can be found that the classification accuracy of AdaBoost-MLP was much higher than that of the single MLP. The accuracy rate increased with the increase of the number of MLPs, indicating that the “adaptive boosting” strategy is helpful in enhancing the performance of the base classifiers. However, the greater the base classifiers, the higher the computation time cost was. Actually, the computational training time cost of the AdaBoost-MLP was proportional to the number of base classifiers. For the recognition time cost, since AdaBoost-MLP was the weighted sum of several MLP networks, the average recognition time cost of the AdaBoost-MLP was slightly higher than the summation of all MLP networks. For practical applications, this suggested that as long as the appropriate number of the MLP is selected, a good balance between the accuracy and recognition time cost can be achieved.

Averaged classification accuracies of the 12 movements in exercise A for different number of MLPs. All the MLPs share the same configuration, for examples, the number of hidden unit, learning rate, and maximum number of iteration, which are 32, 0.05, and 1000, respectively.
Summary
Figure 7 shows the mean classification accuracy of exercise A, exercise B, exercise C, and all the 52 movements by using the GMM, MLP, and AdaBoost-MLP, where the number of MLP was 6. The configuration parameters of the MLPs for each corresponding exercise were the same. From Figure 7, it can be observed that the classification accuracies significantly improved after the AdaBoost algorithm was introduced for all the four categories. The average accuracy enhancement was nearly 4%. For the classification of the 52 movements, the accuracy rate increased by nearly 6%, which proved the effectiveness of the “adaptive boosting” strategy. As Figure 7 shows, the classification accuracy of the 52 movements obtained by using the GMM was 14.3% higher than that of the MLP, which was also significantly higher than the best reported accuracy by Kuzborskij et al. 18 and Atzori et al., 19 as can be found in Table 3. We also found that among the three classifiers applied, the performance of the GMM was the best in both accuracy rate and computational efficiency.

Averaged Classification accuracies of exercise A, exercise B, exercise C, and all the 52 movements by using the GMM, MLP, and AdaBoost-MLP. The number of MLPs in the AdaBoost-MLP is 6. The feature extraction method applied is MAV.
Comparison of optimal classification results for the 52 movements obtained in this study with the results obtained using the other methods.
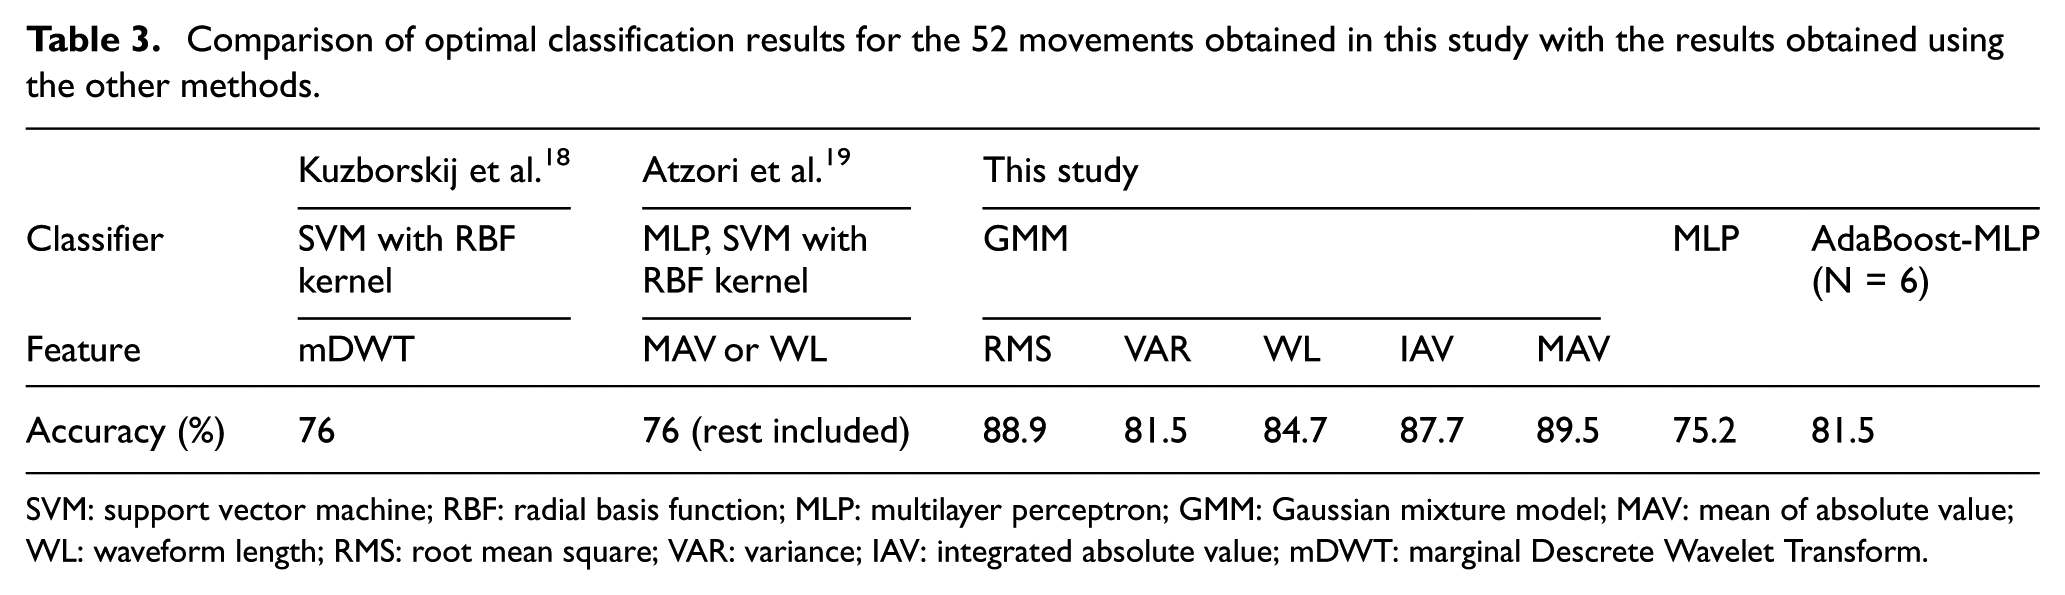
SVM: support vector machine; RBF: radial basis function; MLP: multilayer perceptron; GMM: Gaussian mixture model; MAV: mean of absolute value; WL: waveform length; RMS: root mean square; VAR: variance; IAV: integrated absolute value; mDWT: marginal Descrete Wavelet Transform.
Discussion
Classification accuracy of each movements
In this article, we discussed the performance of 10 feature extraction methods and three different classifiers used for the recognition of 52 sEMG-based hand movements in NinaPro database 1. Figure 8 shows the classification results of each movement in the three exercises by using the 10 feature representations with the GMM. As the figure shows, the accuracy rate was movement dependent. Figure 8(a), for example, shows that the classification accuracies of the movements with indices 4 (middle extension) and 5 (ring flexion) are significantly higher than that of the other movements when using the same feature extraction method. But for movements with indices 9 (thumb adduction) and 10 (thumb abduction), the accuracy rates were much lower than that of the other movements. This is because only minor part of muscle activities related to thumb movements could be sensed with the electrode configuration compared with the other fingers, which induced very weak corresponding signals that were hard to identify.
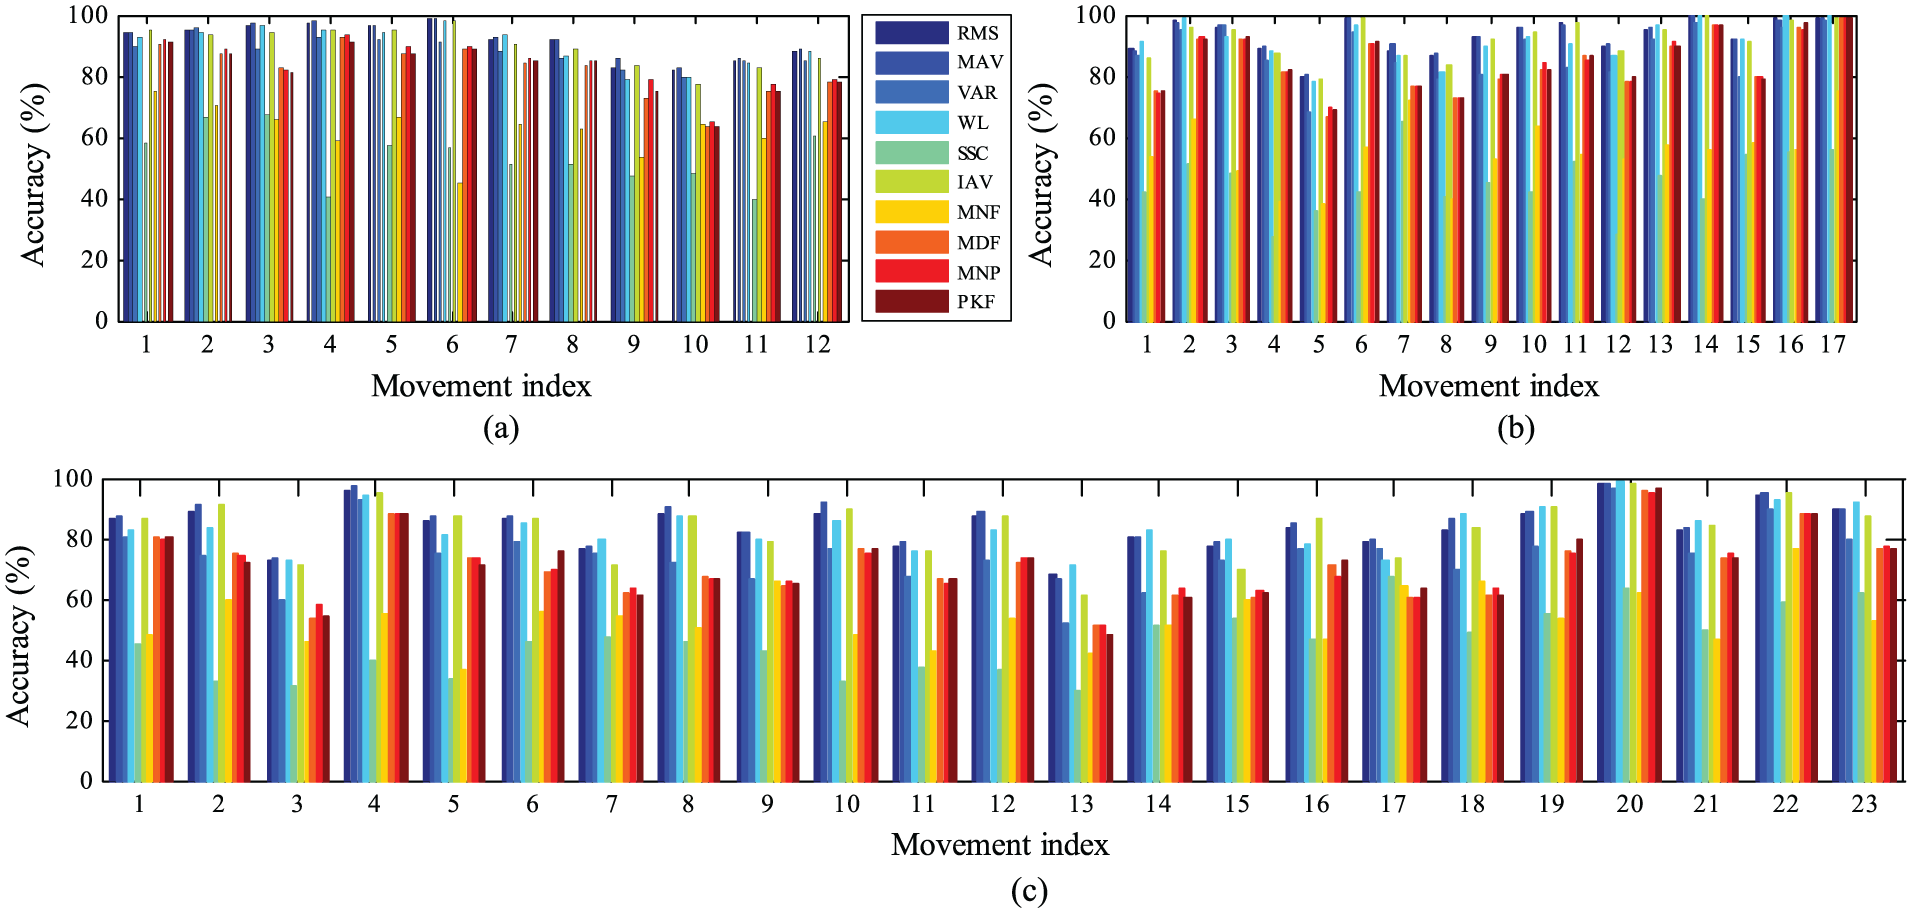
Classification accuracy of each movements in exercise A, exercise B and exercise C with respect to different features. (a) Classification accuracies of 12 movements in exercise A. (b) Classification accuracies of 17 movements in exercise B. (c) Classification accuracies of 23 movements in exercise C.
As Figure 8(b) shows, although there was a greater number of movements in exercise B than in exercise A, the muscles related to these movements were superficial and the amplitudes of the movements were relatively large. In summary, the classification accuracies were good for some features, but for exercise C, the accuracies dropped considerably. One possible reason was that the movements in exercise C were grasping and functional movements that mimicked daily actions. Some of the movements were very similar to each other. For example, the movement of the large-diameter grasp was similar to the movement of fixed-hook grasp; it also resembled the movement of medium-wrap movement, which made it difficult to distinguish between these movements.
Windowing technique
Previous myoelectric control systems split the signals into several fixed-width time windows, calculated the features of each window, and identified its corresponding movements, which resulted in a series of results for a single movement.20,32 Although majority voting (MV) can be applied to make a final decision, this kind of method is time-consuming, since the discrimination process has to be performed several times before a final decision is made. The feature extraction scheme applied in this study also used a sliding time window, but the feature set of each channel was obtained by concatenating all the features calculated in each window after a resampling process was performed to normalize the features for a fixed duration. This kind of recognition scheme was shown to be much more efficient.
Results with feature combinations
We also studied the classification accuracies of the 52 movements with possible combinations of features using the GMM classifier. For the combination of m features of 10 sEMG channels, the feature set was expressed as follows:

where
Average classification accuracy of 52 movements using different feature combinations.

RMS: root mean square; MAV: mean of absolute value; SSC: slope sign change; WL: waveform length; MNF: mean frequency; IAV: integrated absolute value; VAR: variance.
The movement duration is unscaled.
We compared the results in Table 4, Figures 4 and 5; we found that the feature combinations did not produce a higher classification accuracy compared with results obtained using a single MAV feature, which was quite different from the results in previous studies as in Huang et al., 32 Hudgins et al., 42 and Oskoei and Hu 43 One possible reason may be that the data studied in this article were already RMS rectified. If features were extracted based on these data, their features would be different compared with the unrectified ones. Therefore, the combination of features did not guarantee an increase in the accuracy rate. The feature of the signals also had been considered. Even so, the maximum classification accuracy of the 52 movements obtained in this study was nearly 14% higher than the results reported in Kuzborskij et al. 18 and Atzori et al. 19 which proved the effectiveness of the proposed features and classifiers.
Conclusion
We conducted a comparative study of six time-domain features and four frequency-domain features, with three different kinds of classifiers for the recognition of 52 movements in NinaPro database 1. The three classifiers were the statistical classifier GMM, the neural network MLP, and the ensemble learning method AdaBoost. Based on the experimental results, we concluded that MAV was the most effective among all the 10 features. The frequency-domain features were not as effective as the time-domain features in sEMG movement classification with the proposed classifiers. Through a comparison of the MLP and AdaBoost-MLP, we also found that the AdaBoost method significantly improved the performance of the MLP, but it came with the side effect of enhancing training time costs and recognition time. That said, as long as the appropriate number of base classifiers is selected, there would be a good balance between the classification accuracy and computational time cost. We also observed that the combination of the GMM with MAV, RMS, VAR, WL, and IAV achieved much higher accuracy rates for the classification of the 52 movements compared with previous studies. This suggested that myoelectric recognition systems should be developed using the GMM classifier due to its superior performance.
Footnotes
Handling Editor: Daming Zhou
Declaration of conflicting interests
The author(s) declared no potential conflicts of interest with respect to the research, authorship, and/or publication of this article.
Funding
The author(s) disclosed receipt of the following financial support for the research, authorship, and/or publication of this article: This work has been partially supported by National Natural Science Foundation of China under Grant 61703342, and the Aerospace Science and Technology Joint Foundation of Equipment Pre-research under Grant 6131B062202203.