
Abstract
Network intrusion detection is a relatively mature research topic, but one that remains challenging particular as technologies and threat landscape evolve. Here, a semi-supervised tri-Adaboost (STA) algorithm is proposed. In the algorithm, three different Adaboost algorithms are used as the weak classifiers (both for continuous and categorical data), constituting the decision stumps in the tri-training method. In addition, the chi-square method is used to reduce the dimension of feature and improve computational efficiency. We then conduct extensive numerical studies using different training and testing samples in the KDDcup99 dataset and discover the flows demonstrated that (1) high accuracy can be obtained using a training dataset which consists of a small number of labeled and a large number of unlabeled samples. (2) The algorithm proposed is reproducible and consistent over different runs. (3) The proposed algorithm outperforms other existing learning algorithms, even with only a small amount of labeled data in the training phase. (4) The proposed algorithm has a short execution time and a low false positive rate, while providing a desirable detection rate.
Keywords
Introduction
In this age of connectivity, where services, utilities, and the majority of everyday tasks are reliant on the Internet, vast amounts of personal data are stored “in the cloud.” 1 Network attacks that impact the availability or the confidentiality of these services may result in significant losses. 1 Network intrusion detection systems (IDSs) are often used for monitoring, detecting, and analyzing events which flagged as violating network security policies. 2 In general, IDSs are mainly categorized into two categories: host-based IDSs and network-based IDSs.3,4 Based on that, the detection methods in IDSs can be classified into two groups: misuse-based IDSs and anomaly-based IDSs. For misuse-based IDSs, the rules of them often defined by domain experts. Herein, Snort 5 and Bro 6 are two typical examples. However, for anomaly-based IDSs, they require to learn the information of all normal types before detecting the abnormal behaviors. 7
Machine learning has shown to be sufficiently robust in detecting malicious activities and network threats. In supervised learning, the method is trained using labeled dataset in order to make predictions on new (unlabeled) data. 8 Plenty of supervised machine learning methods including support vector machine (SVM), 9 neural network (NN), 10 Bayesian algorithm 10 as well as clustering methods 2 have been employed in IDSs for defense against intrusions. However, due to the constant evolution of today’s network traffic, the majority of the recently obtained and stored data are unlabeled in practice. It is also time-consuming and expensive and in some cases, impractical, to obtain a large amount of labeled dataset to improve the detection accuracy, particularly in our data-driven society. Unsupervised learning methods can be trained using unlabeled data. The clustering is one of the most commonly used unsupervised learning methods. 11 In clustering algorithm, according to the data similarity, a set of data is divided into different groups. Then, different labels are assigned to each group. Samples in the same cluster usually have the similar characteristics. The disadvantage of unsupervised methods is the artificial classification of samples, which has lower detection efficiency and accuracy. To overcome these challenges, semi-supervised learning algorithms designed to leverage unlabeled dataset and labeled ones are becoming increasingly popular.
Thus, the focus of this article is not only to decrease the intrusion detection error rate but also to find a model which is capable of incorporating new data with a good generalization ability. Specifically, we propose a semi-supervised intrusion detection system (SS-IDS) by combining tri-training 12 with three different Adaboost algorithms. This combination scheme allows us to minimize the number of false positive, reduce the time consumption, and increase the detection accuracy of the system. Many simulations with different parameters are performed to prove the efficieny of the proposed algorithm. The change of the amount of the labeled and unlabeled samples could have an impact on the experimental results. KDDcup99, 13 the benchmark dataset, is employed in the experiments to test the performance of the proposed algorithm.
This article is structured as: Section “Related work” makes a reviews about the intrusion detection. In section “Knowledge background,” we make an analysis about the different Adaboost methods, tri-training approach, and chi-square algorithm. The intrusion detection model for the proposed STA algorithm is presented in section “Proposed network intrusion detection algorithm.” Evaluation results are shown in section “Evaluations.” Finally, in section “Conclusion,” the conclusion and next research work are presented.
Related work
Machine learning methods are popular to be utilized in complement existing IDSs to enhance the detection accuracy at low false positive. 1 However, the current research on the semi-supervised IDSs is limited. Semi-supervised learning is a combination of supervised and unsupervised learning, which need a small amount of labeled samples and with a large amount of unlabeled samples to train the model. 14 However, obtaining the labeled data is expensive and consuming time, in some cases requires the expert efforts of many domain. In addition, the majority of the new data are unlabeled in practice. This is particularly true given the volume, variety, velocity, and veracity of today’s dataset (i.e. 4 V’s of big data). Thus, it is not surprising that attention has been diverted to exploring the utilization of semi-supervised IDSs such as self-training, co-training, tri-training, cluster-based.
Mao et al. 15 utilized the unlabeled data and multi-view data with a framework of co-training method to improve the intrusion detection accuracy. Moreover, an active learning framework was employed to identify the unlabeled data and gave the suitable label to them. The experiment results proved that compared to supervised learning method which using the unlabeled data alone, the proposed semi-supervised learning method reduced the false alarm rate by leveraging the labeled and unlabeled data. Two semi-supervised learning methods including spectral graph transduction and Gauss random fields were used in Chen et al. 16 to detect the unknown intrusions. In addition, a novel semi-supervised approach for clustering, MPCK-means, was proposed to improve the IDSs performance. Experiment results suggested that MPCK-means has an improved performance compared to previous methods. Self-training methods, a semi-supervised learning method, was used in Pachghare et al. 17 to solve the intrusion detection problems of IDSs. The performance of supervised methods was improved in this study. Specifically, supervised methods were trained using labeled data. Then, the test data with unlabeled data were labeled using trained supervised methods. After that, some of the test data filtered using a method based on self-predictions for their self-teaching methods were added to the training data. All steps were repeated until it produced a good detection result. A semi-supervised method was also proposed in Chiu et al. 18 Based on a great number of unlabeled samples, more information is generated by the two-teachers-one-student (2T1S). The false alarms were reduced successfully with connection information, while only a few labeled data were available.
In Li et al., 19 in order to increase the detection accuracy of IDSs, a semi-supervised SVM method was proposed to improve the performance of anonymous detection system. Tri-training and SVMs were combined to have a better classification accuracy. KDDcup99 dataset was used to prove the performance of their proposed algorithm. Although this algorithm can achieve a low classification error, it had a very high cost due to the computation cost of SVMs, which results in few practical applications. In Ashfaq et al., 20 a fuzziness-based semi-supervised learning approach (combining both labeled and unlabeled data are used for anomalous detection) was used. The authors obtain a fuzzy membership vector by training a single hidden layer feed-forward neural network and then utilize the fuzzy quantity to classify the unlabeled samples. In Yuan et al., 21 two layers multi-class detection method including the C5.0 method and the Naive Bayes algorithm is presented for adaptive network intrusion detection. Simulation results proved that the proposed method can achieve a good performance with the imbalanced KDDcup99 dataset. Haipeng Yao et al. 22 proposed a multi-level semi-supervised intrusion detection model to solve the imbalance and non-identical distribution problems of KDDcup99 dataset. In Camacho et al., 23 a semi-supervised algorithm was proposed based on multivariate statistical network monitoring approach and partial least squares. It combined the advantages of supervised learning and unsupervised learning strategies. Experiment results based on the real traffic proved the practical applicability of the proposed approach.
Knowledge background
Adaboost approaches
Adaboost, “Adaptive Boosting,” is a boosting method that builds a highly accurate method by combining multiple simple ones. For our proposed method, we use three well-known Adaboost approaches, namely, discrete Adaboost approach, real Adaboost algorithm, and gentle Adaboost method.
The output of the weak method
The main difference between gentle Adaboost method and real Adaboost algorithm is the way they use the estimates of the weighted class probabilities.
Generalized tri-training algorithm
The tri-training algorithm that uses three learners was proposed by Zhou and Li. 12 For consistency, we will use the same terminology and variable names as the original paper.
Let
In the training phase, three methods are obtained by applying the same learning algorithm to three bootstrap samples of the labeled dataset. Then, one unlabeled data
Feature selection
In IDSs, feature selection and ranking have been contributed a lot to improve the IDSs performance. In the feature selection, the minimum number of features or attributes is chose to denote the whole dataset precisely. 27 As for network intrusion detection, there are many features, some of which are not useful in improving the detection performance. The detection accuracy can be enhanced by removing the useless features, which can also reduce the time cost significantly.
Chi-square is a widely used metric, which evaluates the usefulness/relevance of a feature by calculating the value of the chi-square statistic with respect to different classes (types). Table 1 presents the two-way contingency of feature

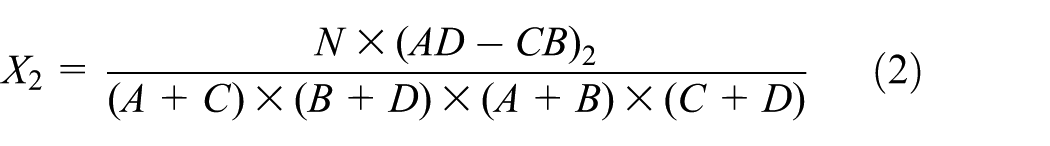
where
Chi-square statistical two-way contingency table.

Proposed network intrusion detection algorithm
We illustrate the detailed implementation of our proposed STA algorithm in this section, including the construction of decision stumps and weak methods. Based on Yuan et al., 30 STA algorithm gives more detail evaluation and better performance. In Yuan et al., 30 tri-training algorithm with Adaboost method was first proposed. However, this article only gave a simple introduction and did not use the feature selection algorithm, leading to a high computation cost.
Implementation of weak methods
In many cases, some of the learning methods, such as SVMs, neural networks, K-nearest neighbor, and Naive Bayes, are used as weak methods. In our proposed algorithm, the decision stump will be utilized as sub-weak-method and several sub-weak-methods are combined as the weak method of Adaboost algorithm. Decision stump is defined by one-node tree with two leaves. 31 The learning of the decision tree continues until the most informative feature is selected. In the input dataset, one feature is corresponding to one decision stump. Our choice of a decision stump is as follows:
It is simple and fast. In the testing dataset, each decision tree corresponding to one sample only needs one comparison to get the results.
Both continuous and categorical features can be implemented conveniently.
Implementation of sub-weak-method based on categorical features
Let

where
Implementation of sub-weak-method based on continuous features
Provide that
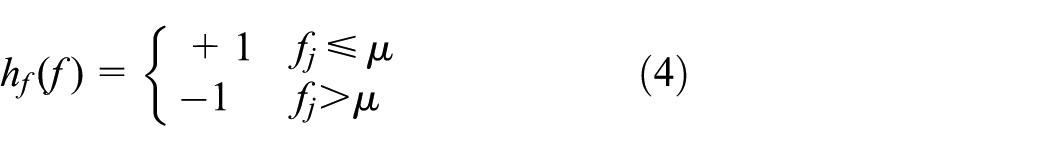
In the above equation,
Implementation of weak methods
We integrate all obtained sub-weak-methods as one weak method. The weak method based on categorical features and continuous features is described as equation (5).

Implementation of STA algorithm
The proposed STA algorithm in this article is designed to improve the performance of the anomaly detection, using a massive unlabeled dataset. We generalize the tri-training approach with three different Adaboost algorithms (i.e. discrete Adaboost, real Adaboost, and gentle Adaboost) instead of the bootstrap samples to create the diversity. Although these three Adaboost algorithms are different, they are easily integrated due to the similarity of their input and output form. The flow chart of STA algorithm is given in Figure 1.

Flow chart of proposed STA algorithm.
Evaluations
Dataset analysis
In the experiment, the Knowledge Discovery and Data Mining CUP 1999 dataset 13 is used to evaluate our proposed algorithm. This dataset, developed by the Defense Advanced Research Projects Agency, has been widely used in the intrusion detection literature. 32
The advantages of this dataset are given as follows:
Many intrusion detection algorithms used it to evaluate their performance and describe it as a reliable benchmark dataset.
Each TCP/IP connection has a predefined label, which is normal or a specific type of an attack, in this dataset. Since the dataset is labeled, it is easy for us to verify the efficiency of our proposed algorithm.
It is freely available online, so it can be accessed by anyone.
This dataset includes four general types of attack:
Denial-of-service attack (DoS): Attacker, as its name implies, tries to make some resources, such as computing or memory, very busy or full. In this situation, users cannot access to the online resources.
Remote to local attack (R2L): Attacker pretends to be a legal user on the victim machine by exploiting some vulnerabilities to get the access right, and in fact, it does not have an account to that machine.
User to root attack (U2R): Attacker attempts to be the super user and uses its privileges on the victim machine; however, in fact, it only has the local access account.
Probing attack (PROBE): Attacker tries to access the information related to the target host.
Table 2 illustrates the proportions of the attack types with all contained specific attack types in the training data. The portions of specific attack types in testing data are described in Table 3. It is noticeable that the training dataset and testing dataset are different. Seventeen attack types in the testing dataset are not in the training dataset, as shown in bold format in Table 3. In addition, the distributions of attack types in the training and testing dataset are different. There are about 20% attacks in both datasets.
Attack types and distribution in training dataset.

PROBE: probing attack; Dos: denial-of-service; U2R: user to root; R2L: remote to local.
Attack types and distribution in testing dataset.

PROBE: probing attack; DoS: denial-of-service; U2R: user to root; R2L: remote to local.
Data preprocessing
The proposed STA algorithm requires a labeled and an unlabeled dataset for its input. We name these datasets as train_labeled and train_unlabeled. We use the testing dataset named test_data to test our algorithm. The procedure to obtain these datasets is described as follows.
We remove some samples from the testing dataset or training dataset. The samples’ features where their values are unique to one dataset are removed from the testing and training dataset. For example, the value of one sample feature in the testing dataset is “icmp,” which is not in the training dataset. Similarly, the value of one sample feature in the training dataset is “red_i” but not in the testing dataset. We removed them in both dataset. Since the number of such samples is small, they do not really affect the overall distribution of the dataset.
Since our focus is a binary classification of the dataset to normal or attack, we continue by labeling all the data which have a type “normal” with 1. All data with abnormal type will be marked as 2 which denotes as attack. This procedure is done only once at the beginning of the simulations both for the training and testing dataset.
Feature selection and dataset extraction
Feature selection using chi-square method
In this section, chi-square method is used to improve the detection efficiency by reducing the number of feature dimensions and selecting the minimum useful features to express the whole dataset accurately. Eighteen features are selected as optimal subset based on the ranking search method. The detailed descriptions and feature weights are given in Table 4, where Dhsspr is Dst_host_same_src_port_rate; Dhsdhr is Dst_host_srv_diff_host_rate; Dhsc is Dst_host_srv_count; Dhdsr is Dst_host_diff_srv_rate; Dhssr is Dst_host_same_srv_rate; Sdhr is Srv_diff_host_rate; Dhsser is Dst_host_srv_serror_rate as well as Dhsr is Dst_host_serror_rate.
Features selected by chi-square method.

Dataset extraction
To extract the labeled and unlabeled dataset, first we split the KDDcup99 training dataset into two separate parts. For this split, we use stratified sampling 33 without replacement. This ensures that even though after every run of the algorithm, we have different data at each sample, and the number of normal samples equals to the number of attack samples. From these two parts, one part is used for the labeled dataset and the other one is for the unlabeled ones. Based on the required size for the labeled, or unlabeled dataset, and the ratio of the normal/attacks, we select again random stratified samples from each part. We obtain the testing dataset following the same procedure. This procedure of randomly partitioning and sampling the dataset is repeated every time that we execute our algorithm. This ensures that we have different data for every iteration.
Simulations
We run simulations where we vary the size of the testing dataset, the training dataset including the unlabeled and the labeled dataset. During each simulation, the ratio of normal/attacks is 75%/25% for the labeled dataset and 70%/30% for the unlabeled dataset in the training step. In the testing step, the ratio of normal/attacks is 83%/17%. For each different set of parameters, the results are obtained by averaging 30 times simulations. As already mentioned above, for each iteration, we will have different training and testing samples.
In order to get the average results, the proposed STA method is run 30 times for each simulation. A Lenovo G490 laptop, with an Intel(R) core(TM) i5-3230M CPU at 2.60 GHz and 6 GB (DDR3 1600 MHz) of RAM is used to run all the simulations. The R version used is 3.3.1.
General results
We use several classical evaluation metrics to measure the performance of the proposed STA method. The definition of them is shown in equations (6)–(9). The symbols used throughout equations (6)–(9) are given in Table 5.


Symbols used throughout equations (6)–(9).

The average values, which are based on the dataset with full feature set as well as with subset of features selected by chi-square method, are shown in Table 6, where FFV is the full feature value and SFV is the subset feature value. All values are obtained from 30 runs. It is worth to note that in comparison with the method using the full feature set, the time cost is reduced by about 45% with the subset of features. The overall performance also increases with the subset of features.
Average results over the total number of simulations.
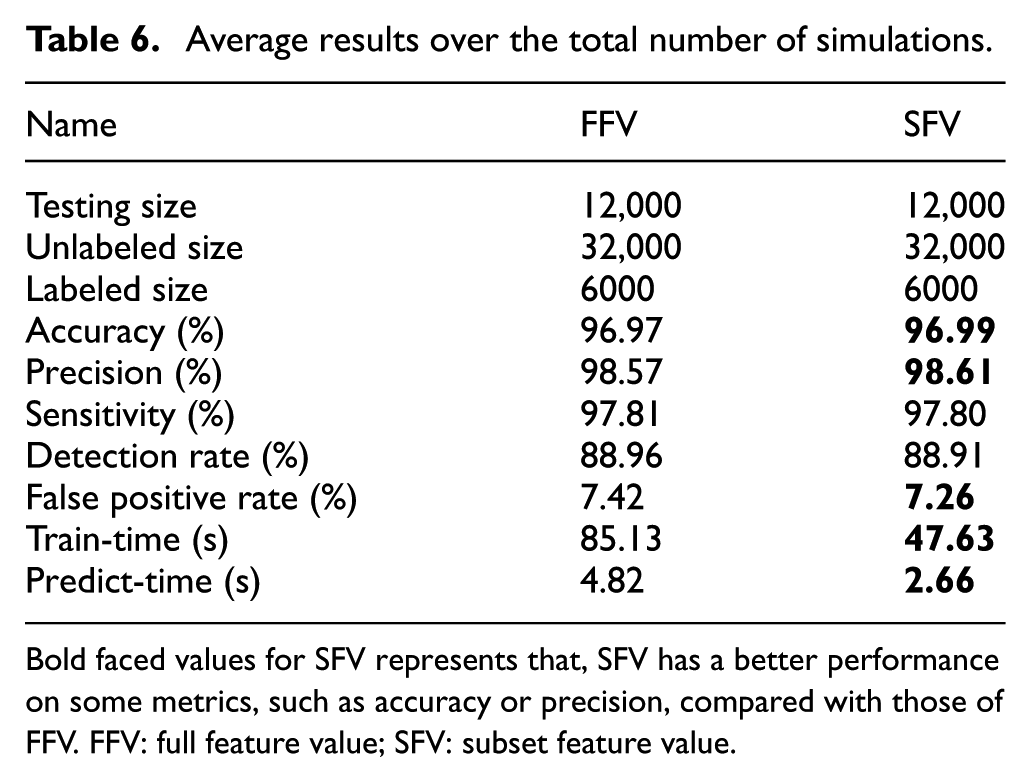
Bold faced values for SFV represents that, SFV has a better performance on some metrics, such as accuracy or precision, compared with those of FFV. FFV: full feature value; SFV: subset feature value.
Table 7 shows that just by using 450 labeled samples and 4500 unlabeled ones, we can classify a testing set of size 45,000, with a precision of 98.08%.
Results for 10% ratios of labeled and unlabeled datasets with the subset of features.

Varying the size of datasets
In order to better explain our proposed STA algorithm, we vary the size of datasets. Specifically, we utilize the sizes of testing dataset from 5000 to 65,000 samples, with a step of 10,000. The size of the unlabeled dataset is 10% of the size of current testing dataset. Similarly, the size of the labeled dataset is 10% of the current unlabeled dataset size. Both labeled and unlabeled samples are randomly selected from the KDDcup99 dataset. 13 Figures 2–4 report that in comparison with the proposed STA method using the full feature set, the accuracy, detection rate and false positive rate are improved using the subset of features.

Accuracy over unlabeled dataset size increases.
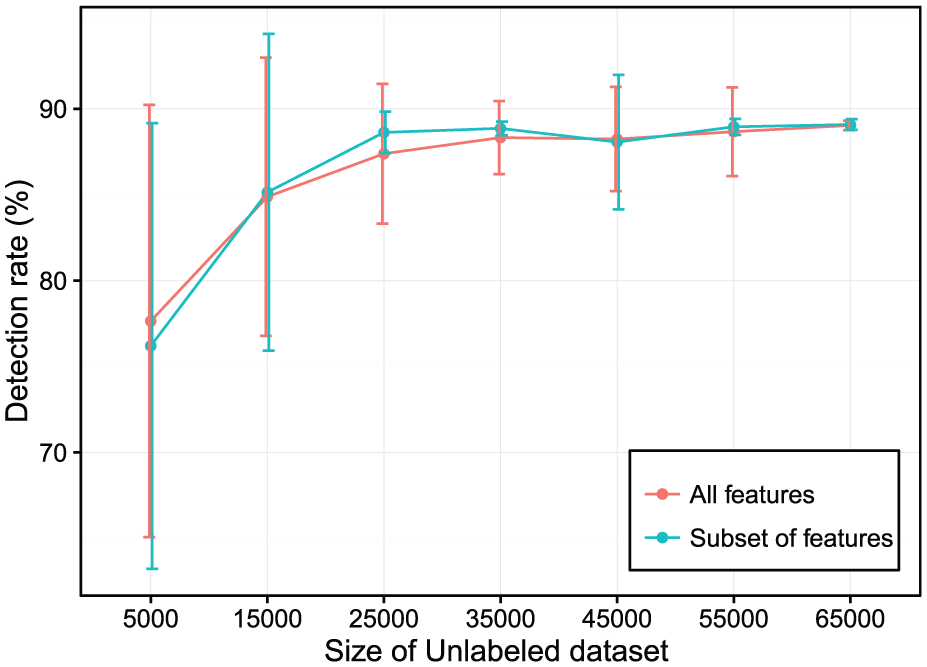
Detection rate over unlabeled dataset size increases.

False positive rate over unlabeled dataset size increases.
We observe that with the number of unlabeled training data increasing, the performance of our experiment increases. This empirical result is very useful in real applications since the unlabel data are cheap to obtain and can help to increase the penalty for the misclassified samples in the proposed algorithm. Therefore, the experiment performance can be improved by simply using a large number of unlabeled samples.
The accuracy, detection rate as well false positive rate with the different ratios of labeled dataset can be seen in Figures 5–7. Similarly, we extract the different labeled dataset with the ratios of 10%, 20%, 30%, and 40% from the current unlabeled dataset. In these figures, the vertical bar of each point presents the value of standard deviation, with lower values being better. Figures 5–7 illustrate that the proposed STA algorithm can achieve a very good result even with only a very small fraction of labeled dataset. The proposed STA algorithm starts with a small number of labeled samples in the training dataset and then increases the number of labeled samples incrementally using a large amount of unlabeled samples in order to improve the detection performance.

Accuracy over a different set of labeled/unlabeled data ratios.
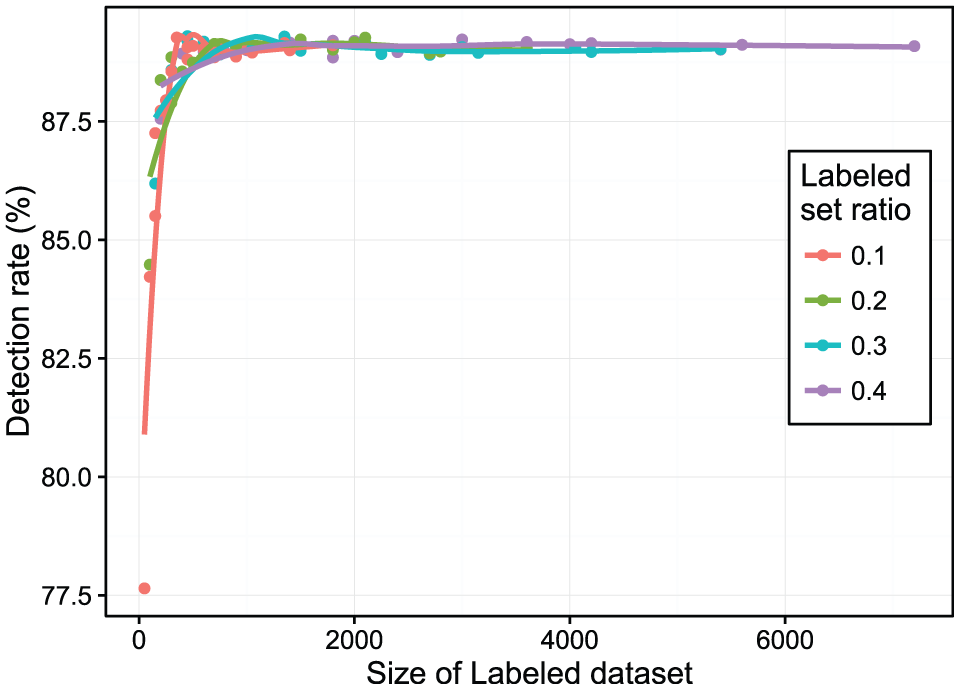
Detection rate over a different set of labeled/unlabeled data ratios.

False positive rate over a different set of labeled/unlabeled data ratios.
Comparison with existing methods
Finally, to have a comparison of our model, we compare some of our results with those obtained by Jimin Li et al. 19 This article used tri-training approach with three different SVM algorithms and employed the KDDcup99 dataset 13 to prove the performance of their algorithm.
Both the training dataset and testing dataset in our experiment have the same sizes or ratios with those in the paper by Jimin Li et al. 19 to evaluate the performance of STA algorithm. Specifically, the labeled dataset consists of 4000 samples, with 3000 normal and 1000 attacks. The unlabeled training dataset has 10,000 samples, with 7000 normal samples and 3000 attacks. Finally, the testing set consists of 30,000 samples, with 25,000 normal samples and 5000 attacks. Table 8 shows a basic comparison of our results.
Semi-supervised tri-Adaoobst (STA) approach and semi-supervised SVM (SSM) method.

Bold faced values for STA represents that, STA has a better performance on some metrics, such as false positive rate, compared with those of SSM. SVM: support vector machine.
Thirty rounds are performed in order to get the average results and in each round, different samples are randomly selected. From the simulation results, it is obvious that the proposed method has a good detection rate and a low false positive rate. In addition, the detection time of the proposed method is low, which proves that STA is efficient.
Conclusion
In many real-world deployments, particularly in systems where the data volume, variety, velocity, and veracity are significant, labeled network samples are difficult, expensive, or time-consuming to obtain. Compounding the challenge, experienced human annotators are generally required to classify the data. However, unlabeled samples are easier to be collected in the real world. For instance, by capturing the network traffic, say in a hospital network or a government agency network, using existing tools.
In our paper, we proposed the STA algorithm based on the training dataset which consists of only a few labeled samples and a massive unlabeled samples. Three different Adaboost methods were combined using the tri-training approach. In the evaluations, we utilized different sizes of labeled dataset and mixed these labeled datasets with unlabeled datasets of varying sizes to generate the training dataset. We demonstrated that our method achieves a low false positive rate, a good detection rate, and a high precision, even when the size of the labeled dataset is 1% of the testing dataset. Just by using 450 labeled samples and 4500 unlabeled ones, we were able to classify a testing set of size 45,000, with a precision of 98.08%. This showed that even using only a very small labeled dataset in the training step, the proposed STA method can achieve a very good performance. It is noteworthy that the detection time of our algorithm is very low, which is a crucial factor in real-world deployment.
As for the future work, we plan to implement a prototype of the proposed algorithm in a real-world environment, perhaps within a close network. This will allow us to more effectively evaluate its real-world utility.
Footnotes
Acknowledgements
The authors would like to thank our colleague Arne Bochem for his suggestions. Y.Y. and Z.W. would like to thank the scholarship support from the China Scholarship Council (CSC).
Handling Editor: Shancang Li
Declaration of conflicting interests
The author(s) declared no potential conflicts of interest with respect to the research, authorship, and/or publication of this article.
Funding
The author(s) disclosed receipt of the following financial support for the research, authorship, and/or publication of this article: Z.W. was also supported by the grants from the NSFC (nos 61772407, 61771387), Youth Fund of the Ministry of Education of China (no. 16YJCZH109), Shaanxi Science (no. 2014M18), Shaanxi Department of Education (nos 16JS080, 18JK1216, SGH18H466), CERNET (NGII20171202, NGII20170303), YANAN Science and Technology Project (no. 2018KG-02), Ph.D Innovation (no. 112-451115006), and Innovation research and development (nos 2016JXKY-20, 310/252051835).