
Abstract
With the development of sensed technology, more and more sensor nodes carry multiple sensors in information collection wireless sensor networks. As a result, there are always a large number of correlated dynamic sensing data transmitted in the network. These data contain a lot of redundant information and errors, which leads to the resource waste and causes data congestion. Although various researches have focused on the sensing data collection and fusion, most of them do not consider the correlation of sensing data, and the network cannot adaptively collect data according to the accuracy required by users. Therefore, this article proposes a hierarchical data collection scheme for data-collecting wireless sensor networks. We combine the clustering and chain network structure and propose a probabilistic multi-mode sensing data selection method based on the characteristics of the sensors. Moreover, a data correlation analysis method based on gray correlation analysis is proposed to measure the similarity of the sensing data. Furthermore, we use the Bernoulli uniform sampling to estimate the approximate average value of data quality and make the approximation for the multi-mode sensing data on the basis of required data accuracy. Experimental results show the effectiveness of the proposed approach. And experiments prove that the proposed approach has better performance than state-of-the-art approaches.
Introduction
Wireless sensor networks (WSNs) are widely used to gather the information in physical environments, and they usually consist of a large amount of small, low-cost, and wirelessly connected sensor nodes. In information-gathering applications, sensor nodes periodically sense and collect data from the deployment area and send them to the sink. With the development of sensed technology, more and more sensor nodes carry multiple sensors in information-gathering WSNs, and sensors can produce different sensing information. Therefore, there are always a large number of correlated dynamic sensing data transmitted in the network. These data contain a large number of redundant information and errors, which leads to the waste of network resources and causes data congestion and other problems. As the sensing accuracy and power consumption of sensors are different, some sensors should get into sleep to save energy, and some inaccurate and redundant sensing information need to be removed effectively without degrading the accuracy of sensing information in the process of data collection, which is one of the basic functions of WSNs. It refers to the transmission of data sensed by sensors to sink nodes, so that users can analyze and process the data. Data collection includes sensing, processing, and transmission of the data, such as environmental monitoring and wildlife tracking. For example, the scientists from Intel research team and University of California, Berkeley, want to track the movements and monitor the habitat of seabirds on Duck Island. Since the seabirds are alert and the environment on Duck Island is very bad, the researchers cannot observe and track the seabirds in a usual way. Therefore, to do this, they apply a self-organizing WSN, which contains hundreds of sensor nodes equipped with multiple sensed modules, such as light, humidity, acoustic, infrared, and camera sensors. These nodes collect and transmit the sensing data to base station computers 300 feet away, via satellite to California servers.
For data collections, clustering is one of the effective methods, such as LEACH, 1 which can reduce the energy consumption of data transmission and decrease data collisions. Data collection is divided into several levels in the clustering-based network. Some of the nodes selectively become cluster heads, which collect the data transmitted by the nodes in the cluster and then simply process it and transmit it directly or multi-hop to the sink node. The other nodes in the network join the nearest cluster to form a hierarchical network. However, in clustering network, correlated sensing data are sent to different cluster heads, which leads to inconvenient data fusion and multiple data transmission flows toward the sink. In addition, the structure of cluster needs to be reformed periodically. To improve it, Lindsey and Raghavendra 2 proposed a chain-based approach, called PEGASIS (power-efficient gathering in sensor information systems), in which all sensor nodes are organized as a chain, and they play the role of chain leader in turns to send the aggregated data to the sink. The network structure does not need to be reformed. And the sensing data can be transmitted step by step along the chain, which facilitates the data fusion, but incurs long transmission delay.
Traditional sensor nodes always have a single sensor, and the power consumption of the sensed module is very small. Thus, communication module is considered to be the most power-consuming module. At present, sensor nodes always carry many different types of sensors such as sound, magnetic, infrared, and video. Some of sensors consume a lot of energy and produce large amounts of data, which need larger transmission bandwidth and cost. Thus, the data selection of the multi-mode sensors must be taken into consideration. The existing works did not involve the data selection for one sensor node with multiple sensors, and they regarded the nodes and sensed modules as a whole to manage the data collection.
To solve the problems described above, we propose a hierarchical data collection scheme for data-collecting WSNs in this article. We consider not only the correlation of the sensing data but also the data selection of the multi-mode sensors. The main object of our proposed approach is to ensure the data collection quality and save the network resources as much as possible. In the proposed scheme, all the sensor nodes are divided into three kinds of roles which are collection node (CN), aggregation node (AN), and aggregation leader (AL). All the CNs transmit their sensing data to their AN at a certain probability. Then, the AN measures the correlation degree of the sensing data to aggregate the data and send them to the AL. Finally, the AL selects the sensing data to satisfy the accuracy demands based on sensed quality. In addition, the network is divided into clusters and all the cluster heads form a data collection chain. Cluster head gathers the sensing data from its members and it takes turns to act as the chain leader to forward the aggregated data to the sink. To sum up, the contributions of this article include the following points:
An adaptive data collection scheme for multisensory WSNs is proposed. In the proposed approach, the network combines the cluster-based and chain-based network structure and adopts a hierarchical data collection scheme. Using the way, the sensing data can be efficiently gathered and aggregated on the different hierarchical level. In addition, the transmission of redundant data is reduced in the network and the precision requirement of data acquisition is ensured.
For each data CN, we propose a probabilistic sensing data selection method, in which sensing data are transmitted to the AN according to the characteristics of these sensors and the sensing information from the neighboring area. Moreover, the greater residual energy the node has, the more probability the sensing data are sent, so that the energy consumption is balanced on each node.
We propose a data correlation analysis method based on gray correlation analysis. Since the high-density distribution of nodes in WSNs, there is usually a strong correlation between the sensing data. Therefore, the gray relational analysis is used to obtain the gray relational degree and measure the similarity of the sensing data.
A sensing data selected algorithm according to sensed quality is proposed and implemented on the AL nodes. The main idea of the algorithm is using the Bernoulli uniform sampling to estimate the approximate average value of data quality and make the approximation for the sensing data according to required data accuracy. Using this way, network resources are saved with data collection quality.
Related works
To achieve efficient data collection, various methods have been proposed in the existing literatures. 3
A typical data collection protocol is LEACH, 1 in which clustering is adopted to gather the sensing data. Each cluster head sends the aggregated data to the sink. Although LEACH has better energy efficiency to some extent, the clusters have to be rebuilt periodically to avoid unbalanced energy consumption. Abbasidaresari and Abouei 4 propose a weighted compressive data aggregation (WCDA) method in the network layer. WCDA algorithm focuses on the load-balancing issue by using the power control ability in sensor nodes to form energy efficient routing trees. Moreover, the authors propose a cluster-based weighted compressive data aggregation (CWCDA) method to make a significant reduction in the energy consumption. Liu and Cao 5 propose a data aggregation method hop by hop through a multi-hop path. However, the route must be established in advance in this scheme. Xiao 6 proposes a mobile data gathering protocol using clustering and controlled mobility techniques. Moreover, they propose a heuristic algorithm to minimize the number of clusters. Lin 7 proposes a mixed-integer linear programming (MILP) model to optimally determine the sink locations as well as the data flow in the network. They adopt a hierarchical network structure with multiple sinks by efficient use of the limited energy at the sensors. In addition, they develop an effective Benders decomposition (BD) approach to incorporate an upper-bound heuristic algorithm. Arumugam and Ponnuchamy 8 propose an energy-efficient LEACH (EE-LEACH) protocol for data gathering. EE-LEACH offers an energy-efficient routing based on the effective data ensemble and optimal clustering. Moreover, the most residual energy nodes are selected to forward the data to the sink to minimize the energy dissipation of the sensor nodes and to optimize the resource utilization. Thus, it achieves better packet delivery ratio with lesser energy utilization. However, the similar sensed data are always sent to different cluster heads not to facilitate data aggregation.
Zhou et al. 9 propose an integrated framework called Secured Marvin and Adaptive Derivative Scheduler (SM-ADS) to improve the fastness of data collection of sensed data event in the sink. SM-ADS achieves the secure data collection by simplifying the encryption and decryption of sensor data using Marvin Message Authentication Codes. In addition, an adaptive derivative scheduler based on Steiner tree is introduced to decrease the energy consumption. Boubiche et al. 10 study a new paradigm named the feedback control system to eliminate data redundancy and dynamically optimize the trade-off between the data aggregation process and the network constraints. The main idea is to adapt the data aggregation degree to the environment changes and the sensor network applications. Li et al. 11 propose an adaptive aggregation routing (AAR) scheme to effectively reduce the data transmission volume and improve the lifetime of a network. In AAR, the senders select the forwarding node dynamically according to the length of the data queue and send data to the nodes with a long data queue, which can balance the aggregating and data sending load so as to increase the network lifetime. Furthermore, the authors propose an improved AAR scheme to improve the quality of service (QoS). They dynamically change the aggregation deadline and the aggregation threshold to reduce the end-to-end delay. In literatures,12,13 the authors adopt multi-path based methods in which each node has more than one parent and to exploit all of them during data gathering phase so as to obtain more robust. Although it may be not much more energy intensive than the single path one, there is duplication of information at each level because each node has more than one parent, which makes it difficult to implement duplicate sensitive aggregation function, such as computing the average, or the count. And using a tree network structure brings serious imbalance in energy consumption of the network, because the closer the distance between the node and the sink, the heavier the workload of the node.
After PEGASIS, chain-based sensor networks have been also used widely in recent works. Mamun et al. 14 propose an efficient localized chain construction (ELCC) scheme to reduce the energy cost by minimizing the transmission distance among sensor nodes. ELCC creates several chains for the topology using Voronoi tessellation. Sran et al. 15 propose an Energy Aware Chain Oriented Sensor Network (EA-COSEN) protocol. EA-COSEN is an extension of existing COSEN protocol and it considers duty cycling of the sensor nodes to save the energy and prolong the network lifetime. Mamun et al. 16 built a chain according to the coverage requirement of the network. They mitigate the constraints of sensor nodes by using a variety of logical topologies. Moreover, choosing only a selected number of sensors, instead of choosing all of them in the chain, saves more energy and lengthens lifetime of the network. Although, chain-based networks are not necessary to rebuild the structure if the head node is changed comparing with cluster and tree-based architectures, one chain includes a lot of sensor nodes, and the sensed data are transmitted through a long and redundant path.
Naranjo et al. 17 propose a prolong-stable election protocol (P-SEP) for cluster head elections in the energy-limited heterogeneous WSNs. P-SEP enables uniform nodes distribution and considers two-level nodes’ heterogeneities: advanced and normal nodes, which have the opportunity to become cluster heads. Shojafar et al. 18 propose a new method to improve channel assignment and decrease interference in multi-channel wireless mesh networks. The proposed method assigns a channel to each of the links subject to the interface constrains such as minimum amount of network interferences so that the implemented channel assignment algorithms are able to adapt themselves to their underlying environment based on their functionalities.
System model
Network model
We assume that the network is a static WSN consisting of one sink and q randomly deployed sensor nodes Ni, i
The sink is assumed to have a constant source of energy and collect sensing data from the deployment field. It has a fixed location.
Each sensor node distributes independently. In addition, it has constrained energy powered by a battery.
Every node knows its position by GPS or any localization algorithm. Using Xi(xi, yi) denotes the location of node Ni.
The sensing data are collected periodically from the network. In each round of data collection, every sensor node decides if there is sensing data needed to send.
We assume that each sensor node is equipped with multiple sensors Sj (1 ≤ j ≤ m) and can provide multi-mode sensing data, and then each sensor has a known sensing range Rs(Sj). Then, the measurement Z(Sj,t) of sensor Sj at time t can be expressed as following,

where h(Sj,t) is the observation value of the sensor Sj of the node Ni at the t-th time step, and w(Sj,t) is the observation noise at the sensor Sj. It is an independent and identically distributed Gaussian random variable with mean zero and covariance

In this article, CNs, ANs, and ALs are all the normal sensor nodes, and they did not have externally powered. The nodes in a cluster take turns to be ANs. Moreover, nodes with different roles in each layer take a different degree of data processing and fusion.
Energy consumption model
Each sensor in a sensor node have two statuses, active and sleep, and their energy consumption consist of three parts, working status, transition from active to sleep, and transition from sleep to active. The details can be shown as follows

where Ttra(Sj) denotes the number of sensor Sj turned on or turned off, Pa(Sj) and Ta(Sj) are the power and working time of sensor Sj in active status, respectively.
An energy consumption model of the communication module is assumed as the same as that in literatures.1,16,19ET(j,d) and ER(j) are the energy consumption of transmitting and receiving j bits data over a distance d.


where ET−elec and ER−elec denote the electronic circuit overheads of the transmitter and receiver, and they are independent with the transmitting distance. εamp [Joule/(bit
Energy-efficient and adaptive data collection scheme
In the Initial stage, the network is organized as clustering. All the nodes in one cluster are located in a local area. They can directly communication with each other. Then, a chain is established for the sensing data transmitting among the clusters. The sensing data are gathered and aggregated along the chain until they arrive at the sink. All the sensor nodes in a cluster have the same cluster identifications.
In order to send the sensing data, each sensor node can choose the different communication distance and transmitted power to achieve reliable data transmitting and energy saving. Accordingly, there are three kinds of communication distance for data transmitting, which consume different energy. The first is Rin that is transmitting the sensing data within a cluster. The second is Rou that is transmitting the sensing data among clusters. The third is Rsi that is transmitting data to the sink.
Each node is able to control and adjust the transmitted power to a reasonable range based on its roles. If the network is divided into g clusters, each node estimates its transmission distance as follow

where

where node Ni and Nj are in the different clusters, which are cluster Ck1 and Ck2.

where
The proposed data collection scheme is based on a hierarchical and hybrid network structure. The data collection processes are divided into three steps, which are respectively implemented on the different kinds of nodes. They are defined as follows:
Definition 1
CN: the sensor node which participates in sensing and obtains sensed data from the environment.
Definition 2
AN: the node that gathers the sensed data from the CNs near to itself, and then it transmits the aggregated data to the AL through the other ANs.
Definition 3
AL: the node which receives the aggregated data from ANs and makes further data fusion, and finally it sends the fused data to the sink.
The three kinds of node roles can be interconverted into each other as Figure 1.

Three kinds of node roles transferring and data transmitting.
A three-tier data collection scheme is introduced in this section in detail. The network architecture is shown as Figure 2.

Illustration a hierarchical data colletion scheme.
In Figure 2, all the CNs transmit their sensed data to their ANs at a certain probability. Then, the AN measures the correlation degree of the sensing data by the gray relational analysis. After that, it aggregates and sends the data to AL, which selects the sensing data with the satisfied accuracy by the sensing data selected algorithm. Finally, the aggregated data are sent to the sink by the AL. Here, we implement the proposed data collection strategy on CN, AN, and AL, respectively.
Sensing and data transmitting in CN
Usually, the sensing ranges of sensors can be approximated by a circle with center node Ni and radius Rs. Since the sensed module in each node includes several multi-mode sensors, each sensor has different sensing range. In our proposed data collection scheme, each node transmits the data sensed by part of its sensors instead of all the sensors. Moreover, each sensor in practice has different detected successful rate because of some reasons like time latency or located environment conditions. Consequently, during the procedure of the data collection, each node has to decide which sensing data should be transmitted to the AN according to the characteristics of these sensors and the sensing information in the neighboring area. First, the detection accuracies of the sensors in a node are assumed as follow:

where

From equation (10), we can obtain the status of node Ni as follows

where sn is the number of the sensors of node Ni.
When each node sends the sensing data to its AN, it incidentally sends its sensor status and remaining energy. Thus, the AN can be aware of the sensor status and residual energy of all the nodes in its cluster. Each CN sends its Sa(Ni, t) to its AN which calculates the value of JSa(Ck, t). If the AN wants to collect the sensing data, it broadcasts a data-collecting message to its CNs. The message includes the joint status JSa(Ck, t) and the average residual energy AE(Ck, t) of the nodes in the cluster. JSa(Ck, t) denotes the joint status of the nodes in cluster Ck at time t, and it is obtained as follows

where nn is the number of the nodes in the cluster Ck. And the average residual energy of the nodes in the cluster Ck at time t is obtained as follows

where
As soon as CNs receive the data-collecting message, they estimate the probability of transmitting data for each sensor in the light of the received information by the following equations.

where

where ① represents

where ① represents
According to equation (14), the data transmitting probability of the sensor Sj in node Ni is

From the procedures of the data transmitting in CNs, we can see that the greater residual energy the node has, the more probability the sensing data are sent. Conversely, if the node has smaller residual energy, it has less probability to send the sensing data. Moreover, the data transmitting probability of each sensor is also affected by the data collection rate and detecting accuracy. The better sensing performance the sensor has, the higher data transmitting probability there is. In this way, the energy consumption of the sensor nodes can be balanced and the required sensing accuracy can be achieved.
Data collection and aggregation in AN
Since the high-density distribution of nodes in WSNs, there is usually a strong correlation between the sensing data. When an AN receives the sensing data from its CNs, the AN will measure the correlation degree of the data to aggregate the data. In this section, gray correlation degree is used to measure the similarity of the sensing data. The data correlation degree refers to a measure of the relevance degree of multiple sensing data with the factors. In the process of data collection, if the changed trends of the data are consistent, the correlation degree of the data is higher. On the contrary, it is lower. Therefore, the gray relational analysis method is to measure the correlation degree of the data according to the similarity or difference of the data development trend. Based on this, this article uses the gray relational analysis method to obtain the gray relational degree of the different sensing data, then the AN estimates the similarity between the data and makes the data aggregation. The process of the data collection in AN can be divided into the following steps.
Determining the reference sequence and the comparison sequence
The reference sequence reflects the behavior of a system, and the comparison sequence affects the behavior of the system. The values of reference data sequence can be set according to the specific application context or relevant regulations. It is usually the optimal values of each data. Let

Calculating the gray correlation coefficient
Because of the different physical meanings of each sensing data in the system, the dimensions of the data are also different. Thus, it is difficult to compare or get the correct conclusion. Therefore, it is usually requires the dimensionless data processing for the reference to compare data sequences in the gray correlation analysis. After that, the gray correlation coefficient of the reference and comparison data sequences can be calculated as follows

where
Calculating the correlation degree
Because the correlation coefficient is the value of the correlation degree between the reference and the comparison sequences at each time, it has more values. Thus, the information is too scattered to facilitate the overall comparison. It is necessary to concentrate the correlation coefficient of each moment into one value that is to find their average value. The value can be used as the quantitative correlation degree between the comparison and reference sequences. The correlation degree is calculated as follows

where
AN sends the aggregated data to AL
AN obtains the gray correlation degree of the received sensing data. If
Data fusion in AL
Due to the large area and high-density nodes in data collection WSNs, the amount of data transmission is too large if all the sensed data are transmitted to the sink. The data contain a lot of redundant information, and it results in data distortion due to data congestion. In order to reflect the information of the physical world more realistically, the deployed sensing areas are usually divided into several disjoint sub-regions. The sensing data are selected and further aggregated in the aggregated leader in each sub-region, and then the AL sends the aggregated data to the sink.
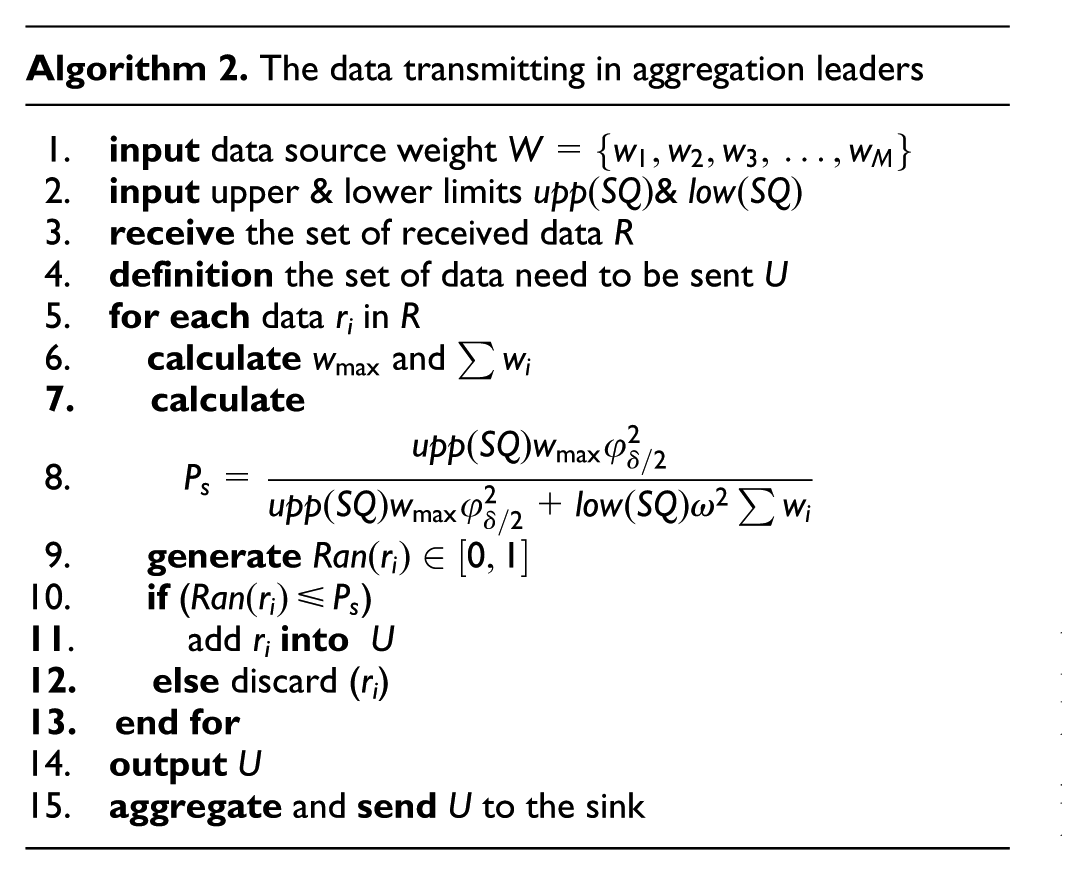
Based on the above discussions, a sensing data selected algorithm according to sensed quality is proposed and implemented on the AL nodes. The main idea of the algorithm is to make the
We assume that the sensing data set of M data sources at time t is

where
Using the Bernoulli uniform sampling method to estimate the approximate average value of data quality, we should first determine the sampling probability Ps in view of required data accuracy
If

where si denotes the status of sampling, it has two values 1 and 0. si = 1 represents the data information is chosen and si = 0 represents the data information is not chosen. In addition, each si is independent and

where

Consequently,

After each AL receives the sensing data, it decides the minimum sampling probability Ps according to the inequality (24) to satisfy the given accuracy requirement. Then, the AL produces a random number for each received data to decide whether the sensing data are sent to the sink. Finally, the AL aggregates all the sensing data, which need to be sent to the sink. The details are shown in Algorithm 2.
Data collection chain forming and leaders selecting
After the network initialization, the network is organized as clustering. In each cluster, we choose the cluster head as the AN and the cluster members as the CN. Therefore, each node can adjust its communication distance and transmitted power to achieve reliable data transmitting and energy saving. CN chooses Rin that is transmitting the sensing data within a cluster, and AN chooses Rou that is transmitting the sensing data among clusters. To balance the energy consumption on each node, when the AN has lower residual energy, we should select a new AN instead of the last AN. Here, we set a threshold
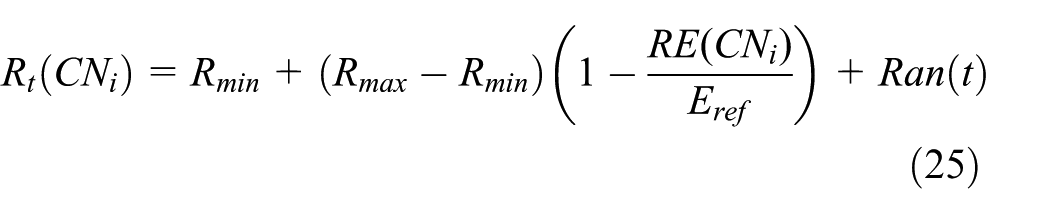
where Rmin and Rmax are the minimum and maximum waiting time,
The collection chain is established by ANs, which are added to the chain one by one. For data transmitting, the larger the transmission distance, the more the energy consumed. Thus, we should shorten the distance between ANs in the chain. In the beginning, the farthest AN from the sink is selected to initiate the collection chain establishing. The AN is perceived as the original AL and its cluster is added to the chain, and then it creates an AL token. After that, the AN selects another AN that locates nearest to add it into the chain and pass the AL token to it. Moreover, the AN that owns the AL token is regarded as the AL. In this way, each time, one AN closest to AL is added to the chain and the process is repeated until all ANs join the chain.
In order to balance the energy consumption, all the ANs take the role of AL in turn. Each AL is set a lifetime to act as the AL according to its remaining energy. If the lifetime of AL expired in the chain, the AL passes the AL token to its downstream AN, which is transferred as a new AL. The AN which does not get the AL token transmits its data along the chain to the downstream AN until the data reach the AL. The lifetime of the AL can be obtained as follows

where
Performance evaluation
We used the Castalia, which provides realistic channel models, radio models, and MAC layer protocols based on the OMNeT ++ simulator,20,21 to evaluate the performance of our proposed schemes, and the default simulation parameters are summarized in Table 1. We also compare the proposed approach with EE-LEACH and EA-COSEN in terms of total energy consumption, average data collection delay, and network lifetime. For each simulation, we run at least 10 times with different random node distributions. Each result is averaged over these runs, and the distribution of sensor nodes is different for each time so that it can avoid the influence of occasionality in one time simulation. The average results of the multiple times are more reliable. However, if the number of simulation times is more than 10, the average results of the simulations tend to stabilize. If we increase the number of simulation times again, there is a little influence on the average value.
Simulation parameters.

Table 2 shows the average energy cost and building times of the network architectures in different approaches. The network architectures building includes system initializing and chain forming and leader nodes selection and so on. From Table 2, we can see that the amount of energy consumed in EA-COSEN is the most and the building time is also the longest compared with the other two approaches. This is because several hierarchical chains are established for all the nodes and one node has to communicate with others to obtain their locations when the node is added into the chain. The average energy consumption and building time in EE-LEACH are smaller than that in EA-COSEN due to the simple clustering algorithm. The proposed approach consumes less energy and spends shorter building time than EA-COSEN approach because it combines the advantages of cluster and chain network architectures. And in the proposed approach, only the head node in each cluster attends the procedure of chain building and the communication just occurs between the cluster head nodes.
Network architectures building in different approaches.
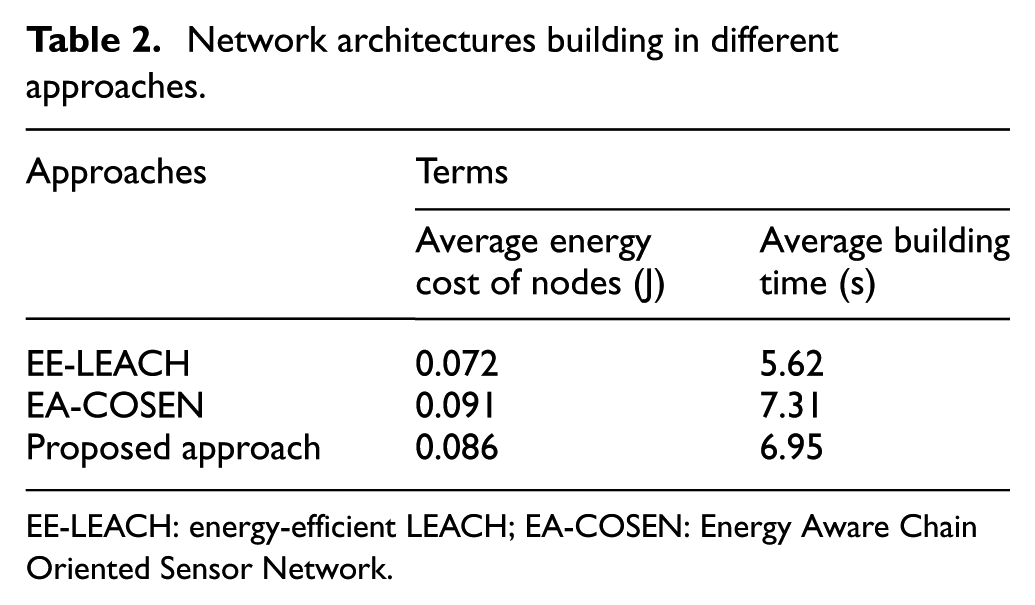
EE-LEACH: energy-efficient LEACH; EA-COSEN: Energy Aware Chain Oriented Sensor Network.
Table 3 shows the performance comparisons in the different approaches in terms of average energy cost of nodes, data transmitting delay, and failed data transmission percentage after the 600-s simulation time. For data collection, EE-LEACH consumes the highest average energy because each cluster head has to send the sensing data from its members to the sink through a long distance. Since the cluster head can directly send the data to the sink, EE-LEACH achieves good performance on data transmitting delay. In contrast, EA-COSEN consumes lower average energy since the sensing data are transmitted along the chain hop by hop and the transmitting distance of each hop is relative shorter, eventually only the chain head sends the data to the sink. However, that the data are transmitted along the chain step by step incurs long data transmitting delay. In the proposed approach, since the sensing data can be selected and aggregated on the aggregation and leader nodes and the aggregated data are transmitted along the data collection chain through a relative shorter distance, the proposed approach consumes the smallest average energy. Meanwhile, the data transmitting delay in the proposed approach is shorter than that in EA-COSEN and it is close to that in EE-LEACH. In addition, EE-LEACH has less failed data transmission percentage than EA-COSEN due to fewer relay nodes in data forwarding processes. Because effective data selection and fusion reduce the amount of data transmitted in the network, the proposed approach has the least failed data transmission percentage.
Performance Comparisons of different approaches.

EE-LEACH: energy-efficient LEACH; EA-COSEN: Energy Aware Chain Oriented Sensor Network.
Figure 3 illustrates that average data collection delay changed with the number of the sensor nodes in the different approaches. We assume that the other parameters are invariant and the number of nodes varied from 250 to 2000. As the amount of sensing data increases, the data collection latency of all three methods increases with the nodes increase. The data collection delay of EA-COSEN sharp rises in pace with the nodes increasing and it is the largest one among the approaches since the chain is much too long with a large number of nodes. Nevertheless, the data collection delay of EE-LEACH increases slowly and it is lower than that in the other approaches for all the node densities, because there are more clusters when the node number increases, and data transmitting can be carried out in each cluster at the same time. In addition, because of the effective data selection and fusion, the data collection delay of the proposed approach is almost near to the results of the EE-LEACH.

Average time delay of the data collection.
Figure 4 illustrates that the total energy consumptions of the data collection changed with the number of the sensor nodes in the different approaches. The other parameters are also invariant and the number of nodes varied from 250 to 2000. As the number of the sensor nodes increases, the amount of sensing data increases; therefore, the total energy consumptions for the data collection in all the methods also increase. In EE-LEACH, as the cluster heads have to send a lot of sensing data to the sink through long distances when the number of the nodes increases, the total energy consumption is the most one compared with the other approaches. The total energy consumptions of the data collection in EA-COSEN is less than that in EE-LEACH because nodes are close to their neighbor nodes in the chain and the transmitting distance between the nodes is shorter, so the energy is saved. Nevertheless, the proposed approach consumes the least total energy because it adopts the effective methods for data selection and data aggregation so as to reduce the redundant data transmitted in the network as much as possible. Moreover, it reduces the data transmitting distance by combining the cluster and chain network architectures.
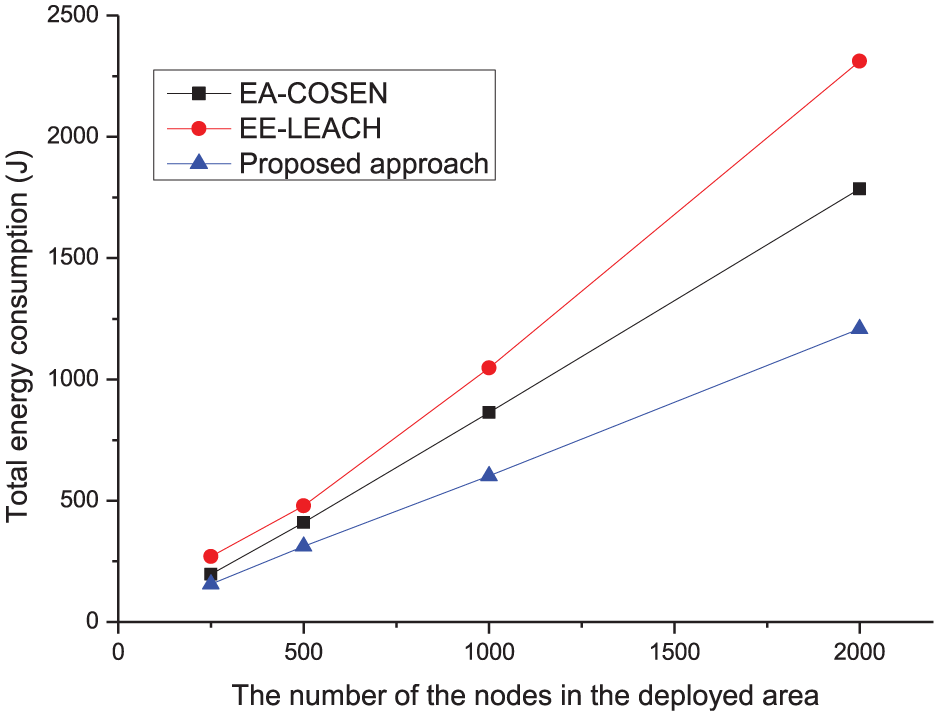
Total energy consumptions of the data collection.
Figure 5 shows the failed data transmission percentages of the data collection changed with the number of the sensor nodes in the different approaches. The other parameters are also invariant and the number of nodes varied from 250 to 2000. As the number of nodes increases, the amount of sensing data increases; therefore, data transmitted collisions also increase and the failed data transmission percentages in all the methods also increase with the node increasing. In EA-COSEN, if one node in the chain is failed, the sensing data will not be transmitted successfully; thus, the failed data transmission percentage is the highest comparing with the other approaches. In contrast, the failed data transmission percentages in the proposed approach increases slowly with the node number and it is the lowest one for all node densities. It is because the proposed approach reduces the data transmission by effective data selection and aggregation so as to decrease the data collisions. Furthermore, if one node in the data collection chain fails, the other node in the same cluster will instead of it join the chain and transmit the data. As a result, the proposed approach has better robustness.

The failed data transmission percentages of the data collection.
In WSNs, many nodes often fail to work for varied reasons, such as energy depletion and physical destruction. To investigate the robustness of the network, we progressively increase the nodes failed percentage from 0% to 50% with the other invariant parameters. The failed nodes are located at random positions. Figure 6 shows the data successful transmission ratio under the different nodes failed percentage in the different approaches. Obviously, all the approaches achieve good performance of the data successful transmission ratio if there is no failed node in the network, and the ratio reduces with the increasing node failures. Remarkably, because all the nodes in one cluster can play the role of the data collection chain member to relay the data in the proposed approach, it has more robustness and achieves good performance if some nodes fail to work. In contrast, in EA-COSEN, the data successful transmission ratio drops swiftly when the failed nodes increase. It is because the data cannot be transmitted to the downstream node until the chain structure is reformed if one node fails to work in the chain. In EE-LEACH, if the cluster head fails to work, it cannot send the data to the sink successfully, and then the cluster structure needs to be reformed. Furthermore, the failures of the cluster members in EE-LEACH have little effect on the data transmission of the whole network.

Data successful transmission ratio under certain node failed percentage.
Finally, we compare the lifetime of the network under the different approaches, and the results are shown in Figure 7. We can see the proposed approach achieves the longest lifetime compared with the other approaches. This is caused by the following reasons: (1) The proposed approach adopts the effective data selection and aggregation methods so as to reduce the data transmitted in the network. (2) The proposed approach combines the cluster and chain network structures so that there is little long-distance data transmission. (3) We balance the energy consumption of nodes in a network by allowing nodes with more residual energy to act as leader nodes for a longer time. Nevertheless, cluster heads in EE-LEACH consume more energy to send the data to the sink through a long distance so that their energy is quickly depleted, and the cluster structure needs to be rebuilt frequently. Thus, EE-LEACH has the shortest lifetime among the approaches. Moreover, EA-COSEN has longer lifetime than EE-LEACH because the sensing data are transmitted along the chain and the transmission distance in each step is very short so that less energy is consumed for data collection.

The lifetime comparison in the different approaches.
Conclusions
This article proposed a novel hierarchical data collection scheme for data-collecting WSNs. The proposed approach ensured the data collection quality and saved the network resources with a combination of cluster and chain network structures. In this article, we proposed the effective methods for data selection and data aggregation to reduce the redundant data transmitting so as to decrease the energy consumption in the network. In addition, each node plays the role of leader different times based on the residual energy and its location so that energy consumption is balanced and the network lifetime is prolonged. Furthermore, in the proposed approach, one cluster is regarded as a unit to join the data collection chain, which decreases the chain reformed frequency and improves the network robustness without degrading the data collection performance. Experiments prove that the proposed approach has better performance than state-of-the-art approaches.
Footnotes
Handling Editor: Daming Zhou
Declaration of conflicting interests
The author(s) declared no potential conflicts of interest with respect to the research, authorship, and/or publication of this article.
Funding
The author(s) disclosed receipt of the following financial support for the research, authorship, and/or publication of this article: This research was funded by the National Natural Science Foundation of China under Grants 61601352 and 61771393, the Fundamental Research Funds for the Central Universities under Grant JBX171310, and the foundation of State Key Laboratory of Air Traffic Management system and Technology under Grant SKLATM201702.