
Abstract
Discovering the road sequences traveled by the bus lines is of great importance for public transport management, such as bus journey time prediction and multimodal travel route recommendation, as the road sequence provides important information on roadway characteristics such as the number of intersections and traffic signals, road type, and number of lanes. This article develops methods to discover the covered road sequence for a given bus line, using bus stop information as well as historical bus locations (i.e. locations where buses had appeared in history). To solve the problem, we first construct a high-quality global positioning system (GPS) trajectory and then employ a novel map-matching algorithm to the resultant dense trajectory to obtain the road sequence of the bus line. We focus on constructing high-quality trajectory with dense GPS points by (1) forming an initial bus stop trajectory using ordered bus stop coordinates, (2) identifying sufficient suitable historical bus locations, and (3) inserting the identified bus locations into proper positions of the bus stop trajectory. Our proposed method is evaluated on real-world bus line data involving more than 400 bus services in Singapore.
Introduction
Efficient and easy-to-use public transportation system is an important element in sustainable cities as it can contribute to considerable reduction in traffic congestion and lower carbon emissions from vehicles. 1 A key enabler to the success of public transportation system lies in the provision of accurate travel time information for travelers to make reliable journey planning. This is especially critical for bus services which typically account for the majority ridership among all public transport journeys. 2
Unfortunately, since bus travel time is affected by multiple factors such as the riding time of moving on road segments, the stopping time at bus stops as well as the delays at intersections, accurate prediction of the travel time for bus journeys remains to be a challenging problem. This problem can be effectively circumvented by providing sufficient features to capture roadway characteristics (e.g. distance, number of bus stops, traffic signals) and traffic conditions (e.g. congestions) on the road segments covered by the bus line. However, the road characteristic information is not immediately available as the road sequence of bus lines is typically not publicly available. Therefore, there is a need to discover the sequence of road segments covered by the bus lines.
An intuitive method to find the road sequence of a bus line is to treat the sequence of bus stops as an object moving trajectory (called bus stop (BS) trajectory) and map the BS trajectory to road network using map-matching method. However, the points of BS trajectory are sparse, because the distance between consecutive bus stops is typically large, ranging from 200 to 500 m. Thus, it is possible that there could exist multiple road paths connecting consecutive bus stops. As such, existing map-matching algorithms typically cannot generate good results for such sparse BS trajectories.
In this article, we investigate the problem of discovering the road sequence covered by a bus line using bus stop information as well as historical bus locations where buses had appeared in history (bus location for short). Due to the fact that there usually exist many possible travel paths between two consecutive points of a sparse trajectory (e.g. as large as 300 m between two consecutive points), thus, it is a challenging task to determine which is the traveled one. Most of the existing works try to improve map-matching accuracy for a given trajectory without considering to augment the input trajectory. In this article, we explore new possibility to further optimize map-matching results by producing dense trajectory, which is also a challenging task. We will develop efficient methods to construct dense hybrid trajectories based on the two datasets. The first dataset—that is, bus stop data—has fixed global positioning system (GPS) coordinates and known orders of the bus stops, but the resultant BS trajectory is too sparse to produce correct sequence of road segments of the bus line using existing map-matching algorithm. The second dataset has large volume of historical bus location records where each record has the information of the bus service ID (e.g. bus 179). However, the records do not have the information of bus ID, meaning that it is not known which bus locations belong to the same bus trajectory, because there are usually multiple buses in operation simultaneously along the bus line/service. In other words, the second dataset contains historical bus locations that certainly locate on the bus line but out of order.
To address our problem, we first form a sparse BS trajectory using the ordered GPS coordinates of bus stops, then we strategically select a set of bus locations (where buses had appeared in history) and insert them into the BS trajectory to obtain a dense hybrid trajectory. We develop novel techniques to (1) identify sufficient suitable bus locations from the mass disordered historical bus locations, and (2) determine the proper positions of the BS trajectory in order to insert the identified bus locations. With the obtained dense trajectory, the map-matching algorithm proposed in Koller et al. 3 is employed to find the sequence of road segments that are covered by the corresponding bus line. We evaluated our method on real-world bus line data involving more than 400 bus services in Singapore, and the results show that the proposed method achieves remarkable results by comparing with Baidu Map.
The remainder of the article is organized as follows. The “Related works” section discusses the related works. The “Preliminary” section introduces important definitions and preliminary knowledge on Hidden Markov Model (HMM) for map matching. The “Data representation and problem formulation” section discusses the used datasets, the problem description as well as the proposed method. In the “Case study” section, a case study is presented to demonstrate and verify the proposed approach. The performance of the proposed approach is evaluated in the “Experimental results and analysis” section. The “Conclusion and further work” section concludes the article and discusses future work.
Related works
Since we are not aware of any reported works that address the same problem considered in this article, in this section, we review related works that can be categorized into the following two categories.
Map-matching algorithms
A large number of map-matching algorithms have been reported to map a trajectory (sequence of GPS points) to road networks. In the early stage, the closeness (between trajectory points and road network nodes from GPS data) 4 and the shape of the road segments are used as the imported features to map a trajectory point to a road segment. 5 However, urban areas typically have dense road networks, and the closest road segment may not always be the correct one to match with 6 thus, the connectivity of road segment is also considered to reduce the errors of map matching, 7 which is typically known as a topological map-matching algorithm when it utilizes the geometry and the connectivity of the road segments. These algorithms considering the connectivity of the road network usually model the constraints with speed, travel time, or shortest path distance to filter out outliers in order to obtain better results.
However, most of the above methods do not work well when matching on the intersections. This is because an intersection typically has multiple adjacent road segments; thus, it is difficult to determine the correct road segment to match with simply based on the closeness and topology of the road network. To address this challenge, many probabilistic methods have been proposed, which require the error region estimation of GPS observations and jointly consider multiple influencing factors (e.g. multicasting, 8 heading, connectivity, and closeness). 9 Recently, more advanced methods have been proposed based on Kalman filter, 10 HMM, 11 HMM model with precomputation, 12 fuzzy logic, 13 and multiple hypotheses. 14 In addition, the above-mentioned methods were also used in a hybrid manner. 15
Map matching for sparse trajectories
The methods discussed in the previous section typically cannot produce good results when the trajectories are sparse (e.g. one point per 1–2 min). There are still many issues, such as improving the accuracy of map matching for sparse GPS trajectories, developing efficient online algorithms, and reducing matching errors at junctions, that have not been well addressed. A few works have been reported aiming at addressing the above issues, including the HMM-based methods (e.g. off-line map matching, 16 real-time map matching 17 ), the conditional random field (CRF) model, 18 the path inference filter (PIF) 19 as well as the ST (spatial–temporal) matching method.20,21 However, these approaches typically utilize a lot of impact features to assist the matching procedures such as driving behavior, length of the path, the number of traffic signals along the path, and average travel time. Most of these factors are difficult to obtain for the general situation or could cause considerable errors when compared with the actual situation. In addition, the prior knowledge of the trajectory point distribution among road networks also becomes a problem. These prerequisites prohibit the generalization of the above methods because most GPS datasets only contain the simplest information such as latitude, longitude, and the time stamp. In fact, the problem considered in this article is that the trajectory points even do not have the time stamp information; thus, the above-mentioned methods cannot be directly applied.
In this article, we do not intend to improve the procedure of map matching by designing more sophisticated algorithm. Instead, we try to improve the quality of trajectory which can be treated as a preprocess and can be combined with existing map-matching algorithm. We demonstrated the performance of our proposed method by combining our approach with an existing HMM-based method. Note that there exist several research efforts to assign GTFS (General Transit Feed Specification) bus stops to road networks. 22 They either rely on the shortest path model 23 or maintain a set of candidate paths connecting successive geographic points. 24 The difference between the above works and our work is that we focus on developing efficient method to discover the sequence of road segments covered by a bus line, instead of only the road segments corresponding to the bus stops of the bus line.
In particular, the most similar work was reported in Vuurstaek et al. 25 The differences between Vuurstaek et al. 25 and our work are as follows: (1) first, our work and Vuurstaek et al. 25 rely on different datasets; and (2) our work and Vuurstaek et al. 25 focus on different tasks with different challenges. Vuurstaek et al. 25 aim to match the bus stops to a road network, which faces the challenges of inaccuracy of GPS locations, while our work aims to find a connected road sequence that is covered by a given bus line (denoted as a trajectory of GPS points). The challenge in our problem is mainly caused by the sparse GPS points in the trajectory such that there may exist multiple feasible road paths between two consecutive points. As such, our work and Vuurstaek et al. 25 focus on different specific tasks and propose different frameworks to solve their problems.
Preliminary
Definitions and notations
Definition 1
Route distance: The total sum of the distance of all consecutive point pairs along the bus route.
There are many types of route shapes of bus line segments such as straight line, folding line, and curve shape. In particular, we partition the line shape into two categories, that is, one-way road and two-way road, as shown in Figure 1.
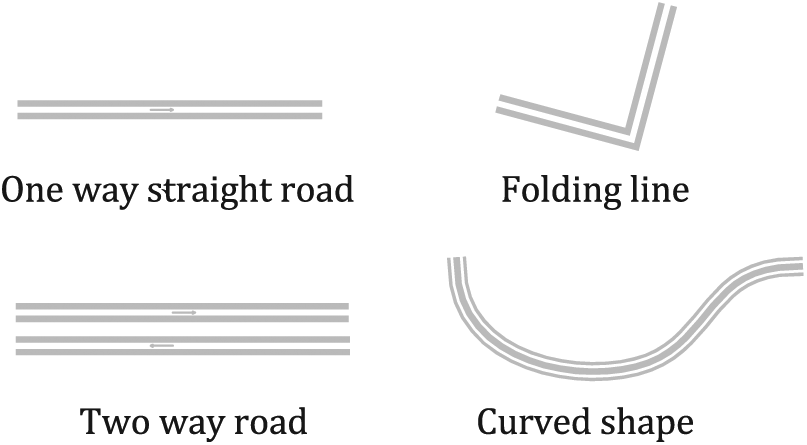
The actual bus route category.
Definition 2
Road segment curvature: Let two points A and B be the end points of directed road segments (from point A to point B); we use notation
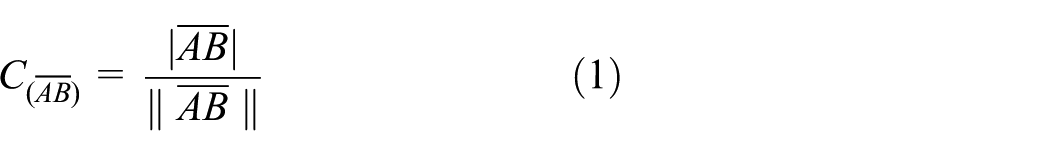
Since it always satisfies that

Demonstration of the road segment curvature: (a) on curved road and (b) on folding line road.
Definition 3
We define road segment
Definition 4
Deviation degree: As shown in Figure 3, there is a point O located near the road segment


Deviation degree: (a) on straight road and (b) on curved road.
Deviation degree D introduced in Figure 3 is the closeness degree of point O to the road segment. Smaller deviation degree indicates a close relation between the point and the route segment, and vice versa.
HMM for map matching
Map matching solves the problem of how to match a set of ordered GPS coordinates to the road networks. Map-matching algorithm typically takes a sequence of vehicle/human trajectory as input and obtains the sequence of road segments traveled by the vehicle/human of the trajectory. Due to the existence of errors caused by a natural random noise source, simply matching each trajectory point to its nearest road will lead to considerable matching error.
The HMM map-matching algorithm 17 utilized in this article, reduce the noise by a series of filters, but is limited by the connectivity of the road network. Then it calculates the different matching probabilities of several possible paths and selects the best candidate of travel paths. The main ideas are illustrated in Figure 4.

The six possible travel routes of the trip.
For the GPS point
Data representation and problem formulation
Dataset description
As mentioned before, we rely on two datasets to construct dense hybrid BS trajectories, that is, bus stop data and historical bus location data.
Bus stop data: The bus stop data are given in the form of bus lines, which are sequences of ordered points where each point corresponds to a bus stop and contains the information of the ID of the bus stop, the GPS coordinates (i.e. latitude and longitude) of the bus stop, and the distance between consecutive bus stops. With the bus line data, we can easily construct a BS trajectory since the order of the bus stops is known. However, the obtained BS trajectory is very sparse as the distances between consecutive bus stops are large ranging from 200 to 500 m in Singapore. Because of this, there typically exist multiple road paths connecting the consecutive bus stops, which makes it a challenging problem for matching the sparse BS trajectory to road networks.
Historical bus location data: The second dataset has large volume of historical bus location records. In particular, each record has the information of GPS coordinates of the bus location, the bus service ID, bus moving direction, and time stamp of the record. However, the records do not have the information of bus ID, meaning that it is not known which bus locations belong to the same bus trajectory, because there are usually multiple buses in operation simultaneously along the travel route of the bus service. In other words, the second dataset contains historical bus locations that certainly locate on the bus line but out of order. In addition, the bus location records suffer from measurement errors, redundancy, outliers, and disorder. As such, there is a need to develop efficient method to select the suitable bus location records to insert into the BS trajectory.
Road network data: We use the road network of Singapore, which comprised of 41,732 nodes and 98,539 road segments. The road network is utilized as an input to the map-matching algorithm together with the constructed high-quality hybrid BS trajectory.
Problem description
As discussed before, we can easily construct a BS trajectory from the bus line data since the GPS coordinates and the order of the bus stops are known. On the other hand, since the BS trajectory is sparse, we treat the BS trajectory as an initial trajectory to be refined. Then we develop novel methods to select a certain amount of bus locations and insert them into the initial BS trajectory to form high-quality trajectory, that is, hybrid dense BS trajectory.
Let

where
The major challenges for building the DTL include the following:
How to extract a certain amount of suitable bus locations from dataset BL in the existence of measurement errors, redundancy, and outliers.
How to insert the selected points into the correct position of the hybrid dense trajectory DTL. We refer to this process as the positional interpolation procedure, as shown in Figure 5.

An example of inserting historical bus locations to form dense BS trajectory.
We next present the proposed methods for addressing the above two tasks.
Main idea
Our proposed method jointly solves the two challenges. Based on definition 3.2 and definition 3.3, we first identify all the candidate paths of road segments that connect the same consecutive bus stops and partition them into clusters by choosing proper parameter
We adapt the number of bus locations to be selected and inserted accordingly based on the curvature degree of the road segment. Larger curvature degree requires that more historical bus locations need to be selected and inserted into the BS trajectory, in order to improve the quality of map matching. For each pair of consecutive bus stops, we select a certain amount of historical bus locations and insert them into proper position of the BS trajectory between the two bus stops.
In particular, we first calculate the distance between the consecutive bus stops using the dataset of bus line information. With the GPS information of two points (including longitude and latitude), equation (5) can be used to calculate spherical distance. The spherical distance between the two consecutive GPS points can be regarded as the Euclidean distance. Due to the existence of device error, the recorded GPS information sometimes could be very far from the actual location of the bus. However, it is difficult to identify all the outliers in a raw GPS trajectory. As a result, we do not try to obtain an ordered accurate GPS sequence through a single interpolation process. Instead, the interpolation process needs to be repeated many times to obtain a high-quality trajectory.
We conduct an “inaccurate interpolation, accurate culling” procedure as shown in Figure 6 to preprocess the GPS points from the raw bus location dataset (GPS points), that is, selecting sufficient historical bus locations and inserting them into BS trajectory to improve the trajectory quality. First, we perform distance-based sampling to select a certain amount of historical bus locations and insert them into the interval between points S and D of the BS trajectory. That is, the distances of consecutive bus location pairs are approximately equal. We first treat point S as the current point, and repeatedly find a successor point for the current point and update the new inserted point as the current point. The process repeats until point D can be regarded as the successor point for the current point. Second, we examine the quality of the sampled bus locations and remove anomaly locations and the locations that are inserted in incorrect position (order). We repeat the process until a dense ordered high-quality BS trajectory is obtained. We next present the detailed description on the interpolation processes.
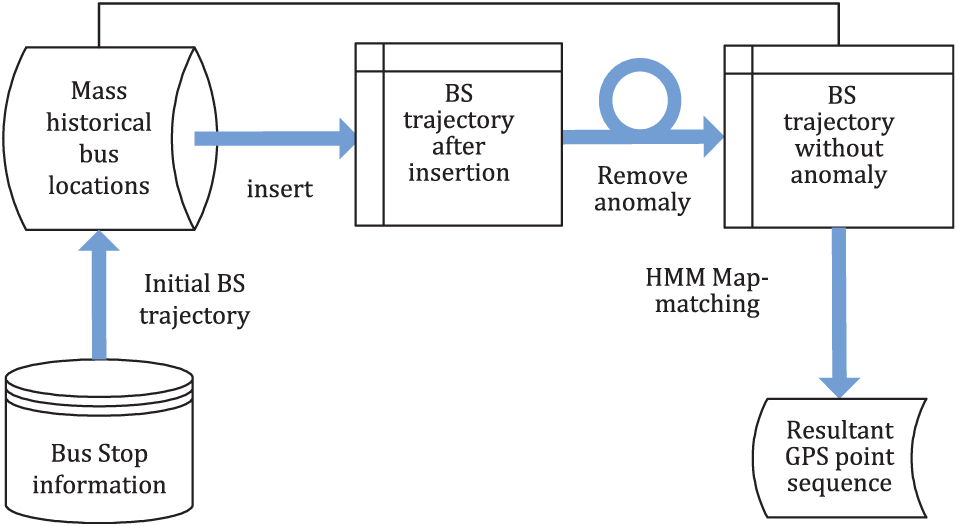
The entire map-matching scheme process.
Insertion procedure
Suppose that we are given a point S and we need to find a historical bus location to be the successor point of S. Let
Case 1: If the road segment
1.
2. The deviate distance of point O relative to road segment
If the above properties hold, then point O can be regarded as a historical bus location to be inserted into road segment
Note that (1) a (geometric) projection of a point O on road segment
Case 2: If the road segment
1.
2. The distance of point O to straight line
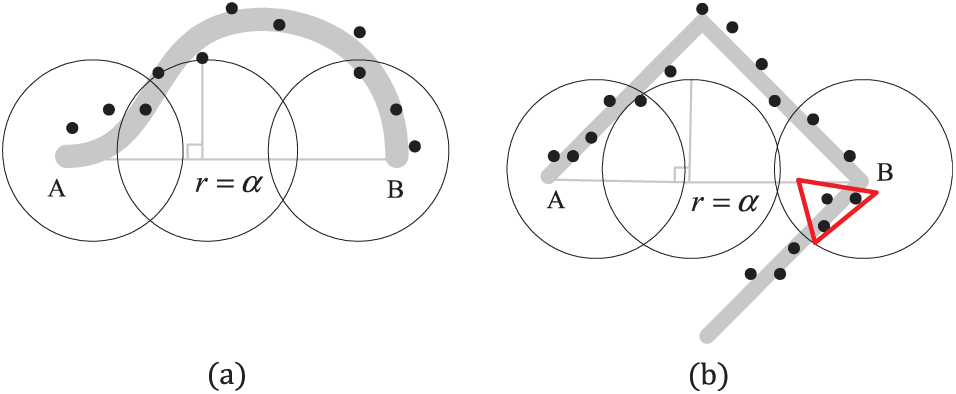
The candidate trajectory insertion point: (a) candidate bus locations to be selected on curved line and (b) candidate bus locations to be selected on folding line.
If the above properties hold, then point O can be regarded as a candidate historical bus location to be inserted into road segment
In this case, (1) a (geometric) projection of a point O on road segment
As shown in Figure 7, the circle radius
Removing anomaly points
Suppose that the above interpolation process outputs a refined dense BS trajectory of a bus line:

The above equation (i.e. equation (4)) can be used to remove the anomaly points and the points that are inserted to incorrect positions. By repeatedly inserting historical bus locations and removing anomaly points, a refined high-quality BS trajectory with dense GPS points can be obtained.
Case study
We take the bus service 241 in Singapore as an example to demonstrate the map-matching result. With the sequence of ordered bus stops as the original BS trajectory, we use the “fuzzy interpolation, accurate culling” strategy to insert a certain amount of historical locations into the BS trajectory points. The resultant refined high-quality BS trajectory is shown in Figure 8.

The obtained high-quality BS trajectory which is fed into map-matching algorithm.
With the obtained dense BS trajectory, an HMM-based map-matching algorithm, as described in the “Map matching for sparse trajectories” section, is performed to find the best road segment path that matches the BS trajectory on the road network. Figure 9 shows the obtained GPS point sequence obtained from the map-matching algorithm, while Figure 10 shows the resultant road sequence traveled by the bus service 241.

The GPS point sequence obtained from the map-matching algorithm.

The corresponding sequence of road segments covered by the bus line 179 obtained from map matching.
All bus lines are matched to the digital map, and the entire bus line network is shown in Figure 11, where different colors are used to indicate different travel routes. 26

The demonstration of the discovered road sequences of all the bus lines considered.
Experimental results and analysis
We evaluated our proposed method using real-world bus line data involving more than 400 services in Singapore. The results are verified by comparing with Baidu Map through visualization, as shown in Figures 9 and 10. In addition, we use the following method to verify the results of all bus lines.
Suppose there are n bus stops on a bus route, and the total length of the route is L. Let RPL be the output of the map-matching algorithm

where
We partition RPL into

where
Figure 12 demonstrates the MARE with varying parameter j on four randomly selected bus lines.

The obtained MAREs with varying parameter j on four randomly selected bus lines.
As such, we should use
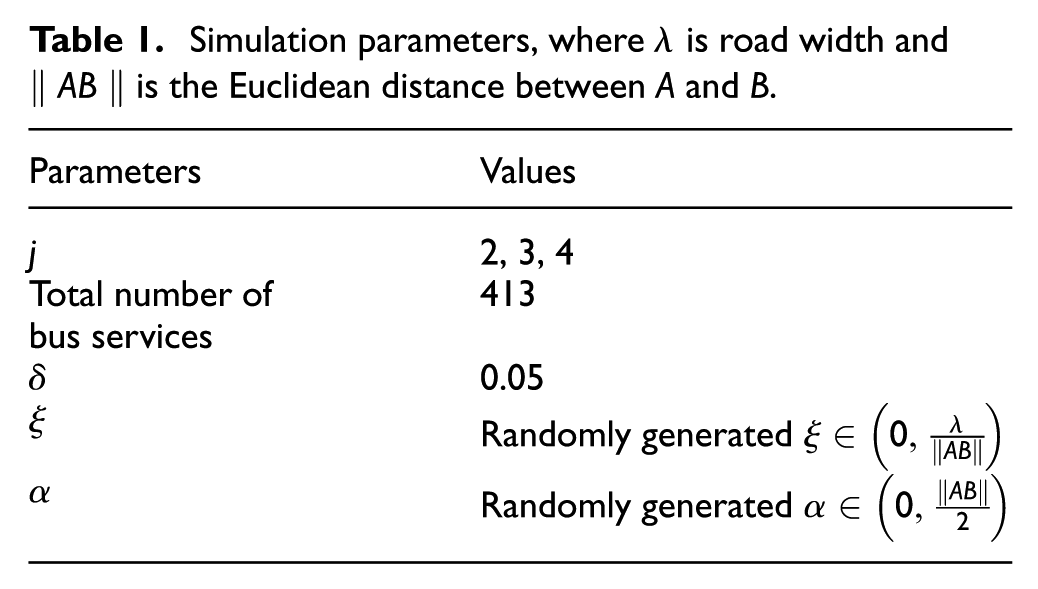
In order to mitigate the impact of the precision errors of the distances between consecutive bus stops, and to effectively measure the details of map matching, we choose
Simulation parameters, where

The results of MAREs on more than 400 bus lines.
Figure 13 shows the MARE values obtained from more than 400 bus lines. For the ease of observation, the bus lines’ index is sorted in increasing order of the obtained MARE values. From the figure, we can observe a consistent trend that larger j leads to smaller values of MARE. When

The results on bus 3: (a) result by Baidu Map and (b) result by our method.
However, some bus lines go through very complex road segment sequence, such as the cases shown in the green box in Figure 15. It is very challenging to obtain the correct road sequence for those scenarios automatically. One method to address this issue is to manually insert a certain amount of historical bus locations. We will consider the problem of automatically addressing these challenging issues as our future work.

The results on bus 36: (a) result by Baidu Map and (b) result by our method.
Conclusion and further work
This article investigated the problem of discovering the road segment sequence traveled by any given bus line. We rely on bus stop information as well as historical bus location records. We utilized the sequence of bus stop locations as an initial sparse trajectory and developed novel methods to insert a certain amount of historical bus locations to form dense trajectory. With the obtained high-quality trajectory, the sequence of road segments traveled by a given bus line can be efficiently recovered. It also provides a reasonable evaluation metric and verification scheme for the map-matching result in the absence of ground truth. The performance has been evaluated using real-world data involving more than 400 bus lines in Singapore.
Footnotes
Handling Editor: Syed Hassan Ahmed
Declaration of conflicting interests
The author(s) declared no potential conflicts of interest with respect to the research, authorship, and/or publication of this article.
Funding
The author(s) disclosed receipt of the following financial support for the research, authorship, and/or publication of this article: This research project is funded by the Science and Technology Development Strategy Research Program of Tianjin under Grant No. 15ZLZLZF00070.