
Abstract
Load model has significant impact on power system simulation. Current load modeling approaches are inadequate on revealing the accuracy and time-variation of load compositions. The application of wireless sensors dispersed in power distribution networks provides further opportunities for load modeling. In this article, a data-driven online aggregated load modeling approach is proposed systematically. First, all the electricity consumers are clustered according to big data of power consumption behaviors. In each cluster, typical users are designated to stand for the characteristics of the cluster, and intrusive measurement is adapted to capture these typical users’ time-varying information by employing wireless intelligent terminals, which can identify the composition of static load and induction motor load online. Second, the load models of other users in each cluster are assumed identical to typical users, including static impedance–current–power models and induction motor models. Finally, the composite load model is achieved by hierarchical aggregation and bottom-to-up stepwise equivalence. Simulations demonstrate that the load model built by proposed approach reflects higher accuracy and adaptability in power system.
Introduction
With the large-scale construction of ultra high voltage direct current/alternating current (UHVAC/DC) transmission project in China, the risk of large-capacity power shortage is increasing correspondingly in power system. 1 The bipolar locking of Jinping-Sunan DC transmission line resulted in 4900 MW power shortage in East China power grid on 19 September 2015, and the lowest frequency declined to 49.56 Hz, which threatened the stable operation of power system severely. 2 After accident, simulations show that the frequency response trajectory could not be reproduced exactly while adapting existing model parameters, among which the load model is one of the most important factors. The impact of induction motor (IM) proportion in load model on dynamic frequency characteristic is analyzed in Figure 1. Based on the adopted load model and simulation boundary, the frequency response characteristic slightly deteriorates with the increase of IM load proportion.

The dynamic frequency trajectory under different proportions of IM load in East China power grid.
Moreover, the procedure of DC commutation failure is affected by load model as well. By means of fault scan in East China power grid, it is found that the three-phase N-1 fault of 500 kV AC line is likely to trigger simultaneous commutation failure of three DC lines (Fulong-Fengxian, JinPing-Sunan, and Yibin-Jinhua). The number of these “perilous” 500 kV-AC lines will significantly decrease while altering part of constant-power (CP) load to IM load. The detailed simulation results are shown in Table 1.
The impact of load model on DC commutation failure.

CZ, CI, and CP represent the constant-impedance, constant-current, and constant-power part in static ZIP load model; DC: direct current.
Obviously, load model has crucial impact on power system simulation. Applying inaccurate load model may lead to discrepancy between simulation results and actual system response, and obtain ‘conservative” or “aggressive” conclusions, which is bad for the control strategy decision.3–6
Various model structures have been studied over the history of load modeling practice. Nowadays, the composite load model composed of static constant impedance–current–power (ZIP) component and dynamic IM component is widely applied for power system simulation due to its preferable generalization capability.7–9 As expected, two kinds of approaches for specifying the parameters of this composite load model are developed, namely, the component-based approach 10 and the measurement-based approach.11–13 The component-based approach captures the inventory of load components connected to feeders so as to synthesize composite load model. 14 However, the statistical work is time consuming and laborious, and dynamic performance of load model is poorly expressed. The measurement-based approach regards various loads as a black box model, and its parameters are identified to fit the real field measurement, which reflects real dynamic behaviors and allows for direct application to practical power system. 15 Whereas, the measurement devices used by measurement-based approach are generally deployed at high-voltage feeders, so that the detailed load information at user-side is unavailable. Identifying accurate load model is complicated due to the following issues: (1) load composition is time variant and stochastic; (2) a wide range of diverse load components is penetrating into power system.
In recent years, continuously expansive power system and penetration of new load components have intensified the load diversity and time-variation, brought severe challenges to load modeling practice.16,17 More literatures have involved in further innovative works for load modeling, expect to improve the accuracy of load models. These studies can be approximately concluded as two aspects:
Innovation of load model modality. Yu et al. 18 propose a new simplified composite load model by dominant parameters selection, in which the IM model is converted as a second-ordered state equation. Kim et al. 19 develop a fast-computational technique for deriving the composite load model parameters based on analytical similarity of parameter sensitivity. These literatures mainly focus on reducing the number of load model parameters to be identified and facilitating the parameter estimation in optimization process.
Optimization of load modeling approach. Kontis et al. 20 employ the vector fitting technique for measurement-based dynamic load modeling. Proposed method in this paper exploits multi-signal from phasor measurement unit (PMU) measurement and facilitate the development of robust dynamic load models. Ge et al. 21 present a new event-oriented method for online load modeling, which is based on an adjustable sliding window applied to load step changes. These approaches can be regarded as the evolution of conventional measurement-based method.
Actually, recent studies have provided some preferable program for load modeling. Whereas, the inherent issue is unsettled, detailed information of bottomed load components is unavailable and its real-time characteristics cannot be tracked. Only by mining users’ power consumption data and commanding the dynamic characteristics of load components, the accurate time-varying load model can be built.
Data-driven online aggregated load modeling strategy
With the application of industrial wireless sensor technology, a large number of dispersed sensors are penetrating into electricity users, and more power data are available and allow real-time access.22–25 These messages can be collected within a short time interval and imposed for online load modeling practices. Load monitoring approaches can be concluded as intrusive load monitoring (ILM) and non-intrusive load monitoring (NILM). NILM approach aims to identify appliances according to the power characteristics, which are disaggregated from user’s integrated power consumption.26–28 High-frequency smart meter is usually employed as its monitoring device. 29 The limitations of NILM are mainly reflected in two aspects: (1) high data sampling frequency is needed, generally required up to 1 kHz; (2) load components may not be accurately identified. ILM approach captures the electrical information by means of connecting sensors with load components directly inside users.
Due to the high identification accuracy of ILM approach, it is adopted for online load measurement and identification in our research. Specially, a kind of wireless intelligent terminal is studied and developed, which is used for capturing detailed load information through ILM approach. In practice, for a large number of users in distribution network, the installation cost of intelligent terminals is excessive. Consequently, a “point-to-area” concept is developed by selecting typical users based on user clustering results.
Combined with load identification theory and intelligent terminal devices, a data-driven online load modeling approach is presented. Detailed processes are stated as follows:
For numerous users in distribution network, the daily load data are adapted for user clustering, which can be provided by intelligent meter reading system. The dimension of daily load data is reduced and all users are clustered consequently. The result of user clustering is updated for several days interval.
In each cluster, several users that are closest to cluster center are designated as “typical users” to stand for the power consumption characteristics of the cluster. Specially, the amount of selected “typical users” can be determined according to practical scenarios.
The intelligent terminals are adopted for intrusive measurement to capture the real-time power information of load components in “typical users,” which is wirelessly uploaded to control center for a short time interval, such as 10 min.
In control center, load information is conducted for sample training and feature matching to achieve load type identification, and corresponding model parameters are matched for different types of load components. Consequently, the load models of “typical users” are attained.
The load models of other users in each cluster are substituted by “typical users,” which consist of static ZIP models and IM models generally. Above process is summarized as “point-to-area” concept.
The aggregation models of static ZIP loads and IM loads in all users are derived respectively by model parameters equivalence.
Considering the impact of distribution transformer and lines between different voltage grades, the composite load model is built by bottom-to-up stepwise equivalence, which is updated for 10-min interval.
The flow chart of proposed load modeling approach is depicted in Figure 2.
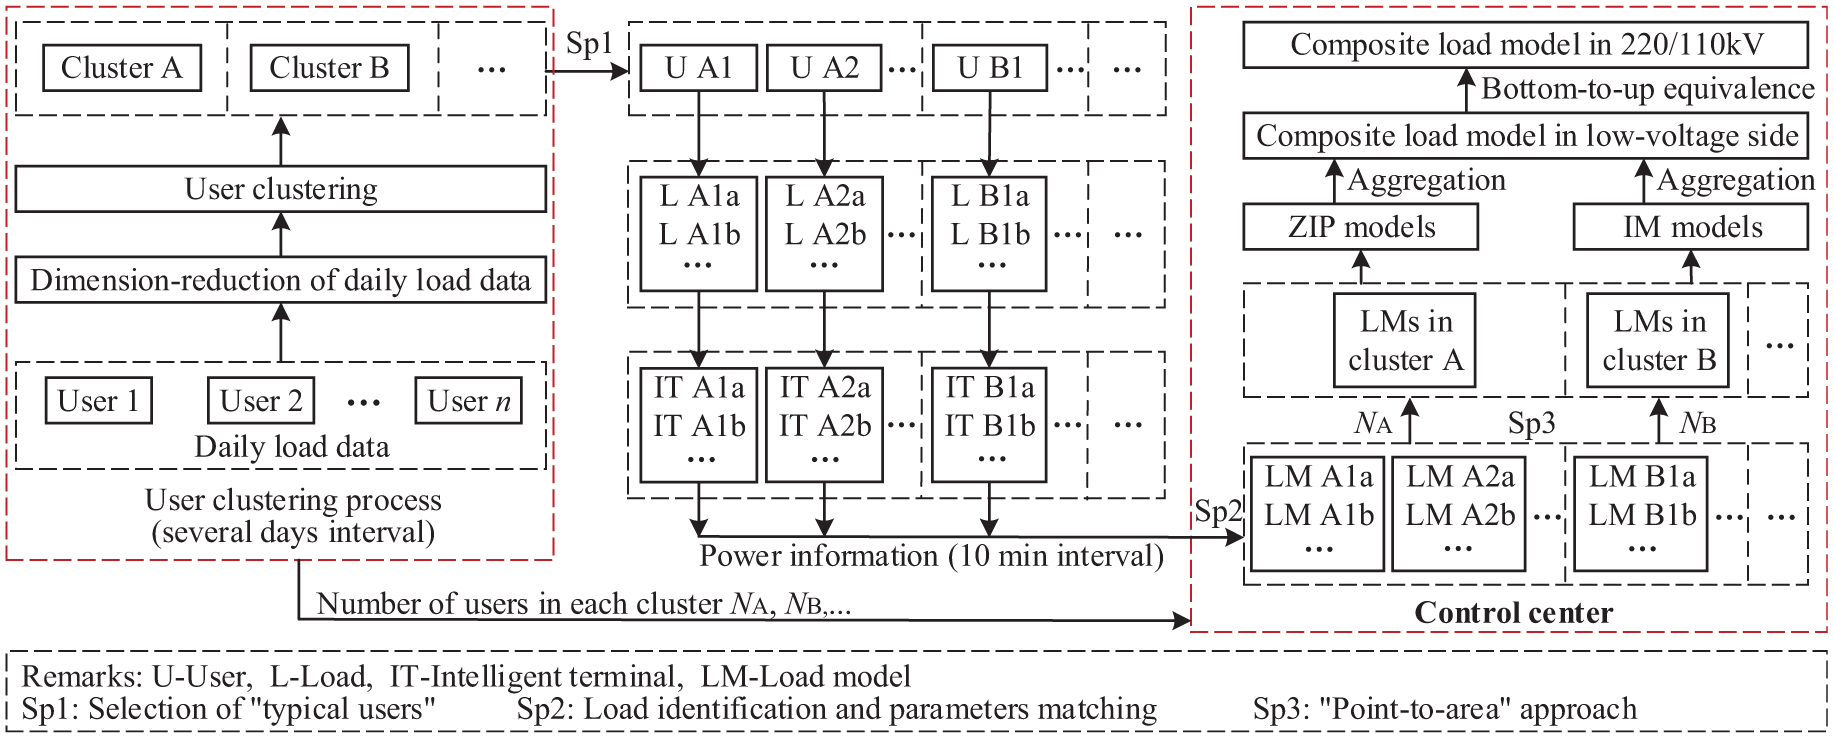
Diagram of user clustering and online load modeling.
Based on above analysis, the contributions of this article are mainly reflected in three aspects:
A data-driven approach is proposed and applied for user clustering, and based on which a “point-to-area” concept is developed for mining the power consumption characteristics from typical users.
A bottom-to-up stepwise equivalence approach is proposed, by converting static ZIP model paralleled with IM model to high-voltage side from low-voltage side.
The time-variation of load composition can be more accurately reflected by proposed online aggregated load modeling approach.
The following contents of this article are arranged as follows: section “Data-driven user clustering approach” proposes a data-driven user clustering approach based on dimension-reduced load pattern indexes. Section “Online load measurement and aggregated load modeling” introduces the online load measurement and aggregated load modeling procedure. Section “Case study” validates the rationality and effectiveness of proposed online load modeling approach in case study. Concluding remarks are addressed in section “Conclusion.”
Data-driven user clustering approach
User’s daily load curve comprises sequential power consumption data retrieved from all appliances; its pattern is determined by operating state of appliances. Users owning similar daily load curves generally comprise nearly identical appliances and reflect similar power consumption behavior. 30 A new user clustering approach originated from data mining is proposed, by reducing the dimension of user’s daily load data. First, six-dimensional load pattern indexes are applied for dimension reduction. Then, based on the expert weights of load pattern indexes, k-means algorithm is utilized for user clustering. Finally, the expert weights are revised according to clustering validity test, so as to achieve the optional clustering results.
Dimension reduction of daily load data
The load pattern describes the consumption behavior and characteristics of load components, which can be expressed by load pattern index. Six-dimensional load pattern indexes are appointed from four different periods: whole day, peak period, smooth period, and valley period, so as to reflect user’s daily power consumption characteristics. The definitions of load pattern indexes are shown in Table 2.
Daily load pattern indexes.
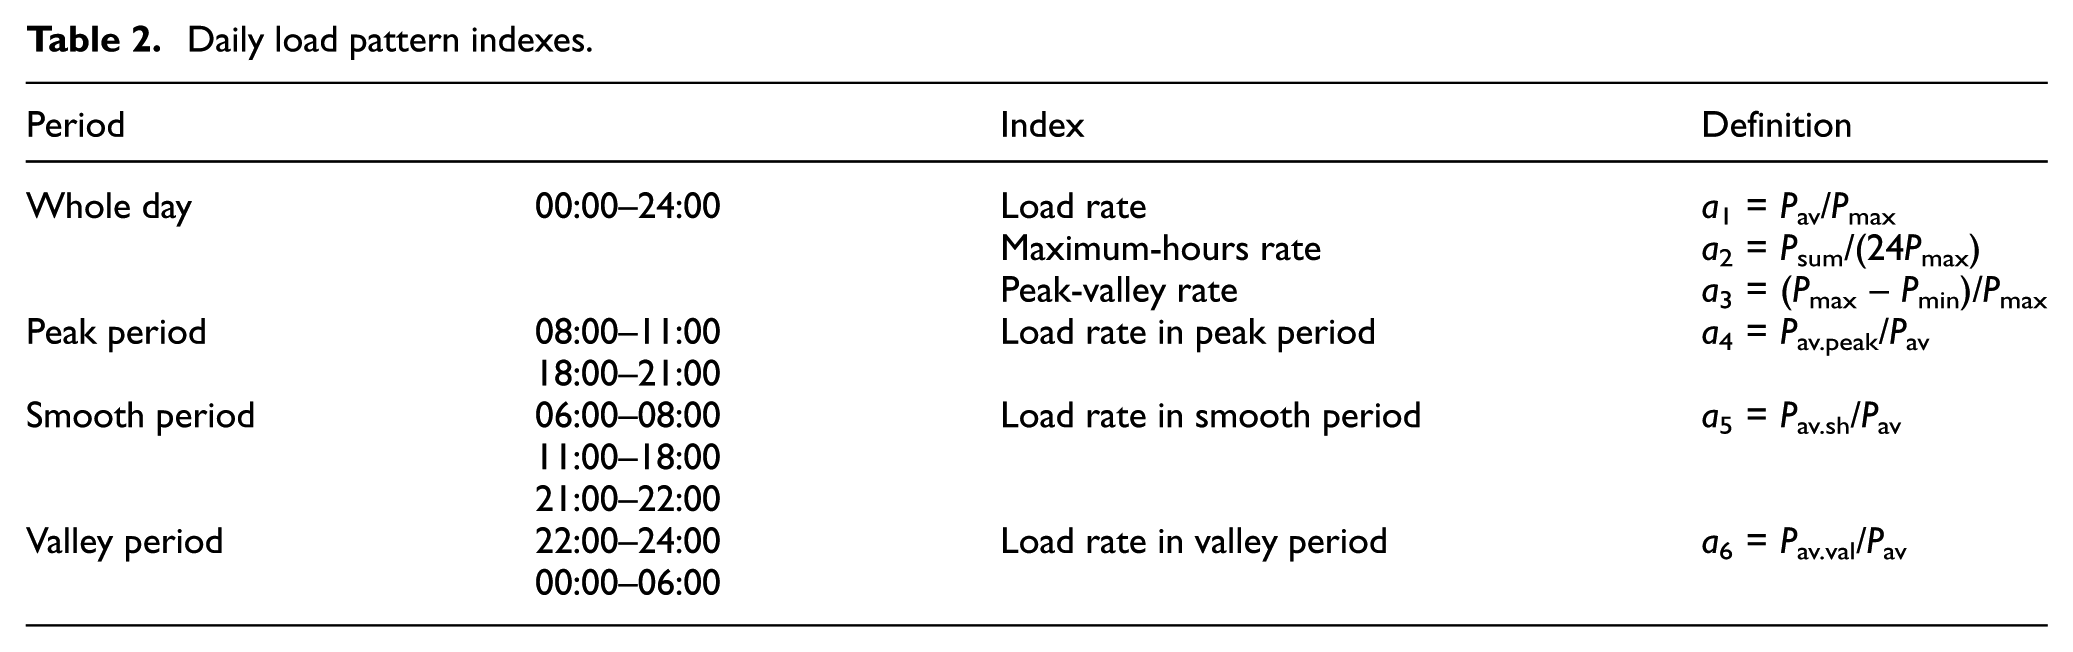
The indexes a1, a2, and a3 reflect the power consumption characteristics in whole day from three aspects of average load rate, time utilization efficiency, and peak-shaving capacity. The indexes a4, a5, and a6 express the load rate in different periods of peak, smooth, and valley period. Proposed 6 kinds daily load pattern indexes can be used for reducing dimensions of daily load data matrix. The significance and importance of six-dimensional load pattern indexes are different in revealing load characteristics. Its weight vector is denoted as
User clustering algorithm
Several approaches are available for users clustering, among which k-means, hierarchical clustering, and fuzzy C-means algorithm are maturely applied.31–33 Particularly, k-means algorithm has become the most widely applied clustering approach in science and industry field, since its advantage of fast computing and adaptation for big data mining. Consequently, k-means algorithm is employed for user clustering in our research. The procedure of user clustering is as follows:
For N users’ pattern indexes matrix, in which K users are randomly arranged as the initial clustering center
For each user

All users are assigned to the nearest clustering center according to weighted Euclidean distances dij, and K clusters are formed correspondingly.
The number of users in cluster-j is denoted as mj, and user-i in cluster-j is marked as

The summation of squared errors for all users’ pattern index matrix is figured out

For iteration times t, if
Clustering validity test
Clustering validity test is an overall assessment of merits and demerits for user clustering, developed for determining the optimal clustering scheme. The Silhouette is a clustering validity test index which is suitable for evaluating the similarity of intra-cluster samples and the diversity of inter-cluster samples. It can be applied to determine the optimal cluster number and evaluate the clustering efficiency.
The pattern index matrix of N users is assigned as K clusters. For user-i in a cluster, Din(i) is defined as the average distance of pattern indexes between user-i and all other users in this cluster. It is applied for evaluating the similarity of intra-cluster users. Contrary, the average distance from user-i to all other users in different clusters is depicted as Dex(i). Which is used to describe the dissimilarity of inter-cluster users. The Silhouette index Isil(i) of user-i is defined as

which satisfies −1 ≤ Isil(i) ≤ 1. The smaller the Din(i) and the larger the Dex(i), the value of Isil(i) is closer to 1. The larger value of Isil(i) indicates that the cluster-i reflects greater intra-similarity and inter-dissimilarity, so that the cluster-i is regard as an effective cluster. If Din(i) > Dex(i), Isil(i) < 0, the procedure of user clustering is suspected.
The average value of all users’ Silhouette index, denoted as Isilmean, is defined to evaluate the clustering efficiency. The larger value of Isilmean index indicates more beneficial clustering result. The number of clusters K is optimum when Isilmean index reaches its maximum value

Weight allocation of load pattern indexes
Considering the different significances of six-dimensional load pattern indexes, it is unreasonable to equally weight for them. Adopting the weight from multiple experts’ experience and averagely integrating them is regarded as the most commonly used method. However, the subjectivity of experts will affect clustering effect in some degree. A new user clustering approach is proposed by revising expert weights based on the clustering validity test index. The detailed procedures are as follows:
1.n experts are respectively invited to empower weights for six-dimensional load pattern indexes. The weight of expert-m is denoted as
2.Applying the weight of expert-m for load pattern indexes, and k-means algorithm is utilized for user clustering. Correspondingly, the optimal cluster number
3.Figuring out the mean value of optimal cluster numbers from n experts and marked as

4.Calculating the impact factor of n – α experts based on Isilmean index. Consequently, the impact factor matrix is formed as

Apparently, the larger value of Isilmean, the larger the impact factor β, and which is corresponding to the better clustering result.
5.Considering the impact factor of expert’s weight, the revised weight matrix of six-dimensional pattern index is obtained as

6.Applying the revised weights to k-means clustering algorithm, the meanings of load pattern indexes can be reflect to a greater extent. Consequently, more reasonable clustering result is realized.
Online load measurement and aggregated load modeling
Online load measurement through intelligent terminal
Served as the online intrusive load measurement device in our research, the dispersed intelligent terminals are connected to Routers for wireless data transmission by In our research, numerous dispersed intelligent terminals are connected to Routers by wireless WiFi or ZigBee optionally, so as to capture and transmit load data. Consequently, the electricity information of load components is uploaded to control center via ISP (Internet service provider) by wired or wireless broadband, which can be displayed through Web interface. The network topology diagram of load information capturing and uploading is depicted in Figure 3.
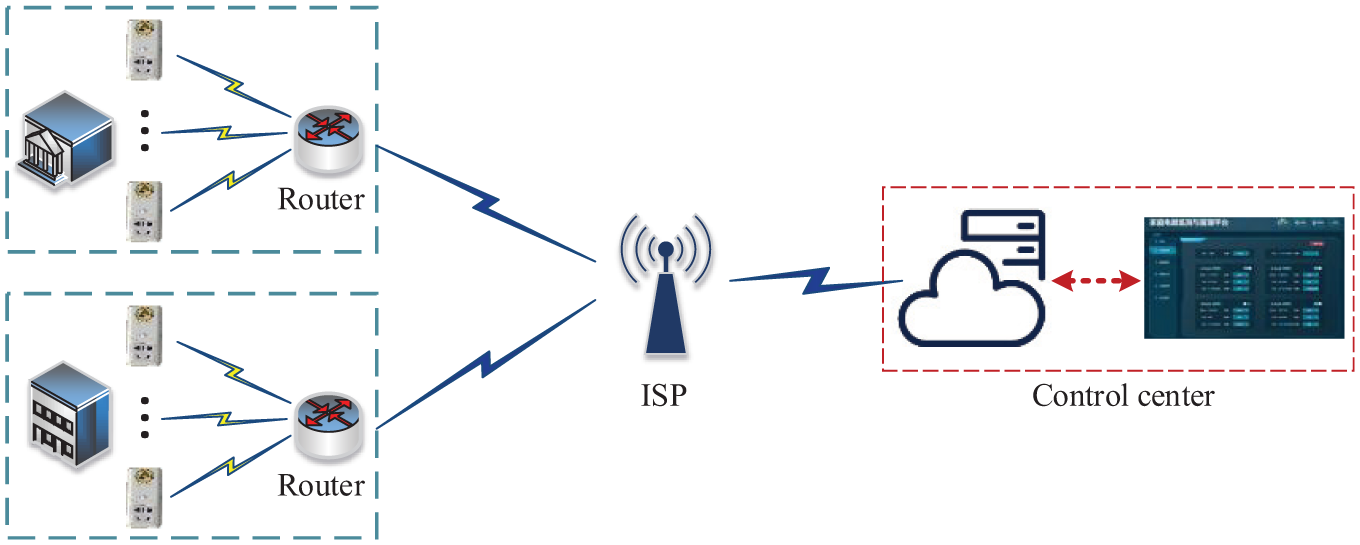
The network topology diagram of load information capturing and uploading.
The intelligent terminal is composed of five parts including sampling and filter module, data processing module, communication module, execution module, and power module. The relationship of five parts is depicted in Figure 4.

Diagram of intelligent terminal composition.
The sampling and filter module capture the voltage, current, and frequency from appliances, which is converter to low-voltage signal and provided to data processing module. As the center of intelligent terminal, the data processing module controls the whole system operation in hardware framework. Meanwhile, its software functions involve parameter calculation, data communication, advanced protection, and instruction execution. The communication module is one of interaction channel for intelligent terminal and control server, which supports WiFi and ZigBee signal optionally. The execution module is responsible for executing the control instructions from data processing module and feedback execution result. The power module is the energy source of entire intelligent terminal module, which converts 220 V AC voltage to 5 V DC voltage for system operation. Moreover, environmental parameters acquisition interface is reserved according to application requirements, which contains two analog input and one serial communication.
The electricity information in control center is conducted for sample training and feature matching so as to identify the load type, and typical model parameters are matched for different types of load components. The daily power curves of several typical appliances in households collected by intelligent terminal are shown in Figure 5. Obviously, the daily power curve of different appliance reflects distinct-different power consumption behavior, for example, the fridge reveals periodic characteristic and the microwave shows pulsing characteristic.

Daily power curves of several typical appliances.
Aggregation of static model and IM model
Static load model is suitable for depicting static components such as resistive loads and light bulbs, which demonstrates the relations between load power with voltage and frequency. The frequency term is usually ignored since that frequency variation has little impact on load power. The polynomial static load model recommended by IEEE Task Force is adopted in this article as follows

where a, b, c are the active power coefficients of constant-impedance, constant-current and CP in static load, which satisfy a + b + c = 1. Similarly, α, β, γ are the reactive power coefficients and α + β + γ = 1. U0 is the rated load voltage; P0 and Q0 represent the active and reactive load power in the rated state.
Aggregating static load can be generalized as the equivalence of load model coefficient P0, a, b, c and Q0, α, β, γ. The active power and reactive power are weighted according to the coefficients of constant-impedance, constant-current, and CP part, respectively.
IM load occupies a large proportion in industrial users. The compressor load like air conditioning and refrigerators are typical IM components in commercial users and residential users. There are many methods to aggregate the IM load, almost all of which can be summarized as weighting its parameters based on rated capacity in some degree. The schematic structure of induction motor load model is shown in Figure 6, where Rs is the stator resistance, Xs is the stator leakage reactance, Xm is the excitation reactance, Rr is the rotor resistance, Xr is the rotor leakage reactance, s is the rotor slip.

Equivalent circuit of induction motor load model.
Generally, the transient process of stator winding is much faster than rotor winding in IM. Therefore, the third-order electromechanical transient model of IM can be retrieved from fifth-order electromagnetic transient model by ignoring the transient characteristics of stator winding, which is shown as follows
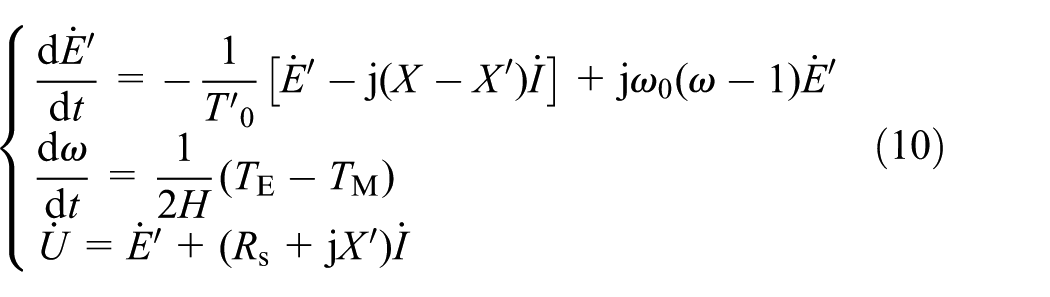
where
The rated capacity of aggregated IM load is the summation of all individuals

where k is the number of IM loads. By setting ρi = SNi/SNM, the equivalent circuit parameters of aggregated IM load are the weighted average value of admittance in branches. The schematic of aggregating process is shown in Figure 7.

where ZM is the electrical branch impedance of aggregated IM load. For stator branch, Z = Rs + jXs; for excitation branch, Z = jXm; for rotor branch, Z = Rr/s + jXr. The aggregated inertia time constant is


The aggregating process schematic of induction motor equivalent circuit.
Stepwise equivalence of composite load model
The load model is generally located on 220 kV/110 kV feeders in power system simulation. Nevertheless, the practical power load is impossibly supplied by 220 kV/110 kV bus directly. Therefore, the impact of distribution network should be further considered in load modeling process. The procedure of converting parallel IM load and static load model to high-voltage side is shown in Figure 8.
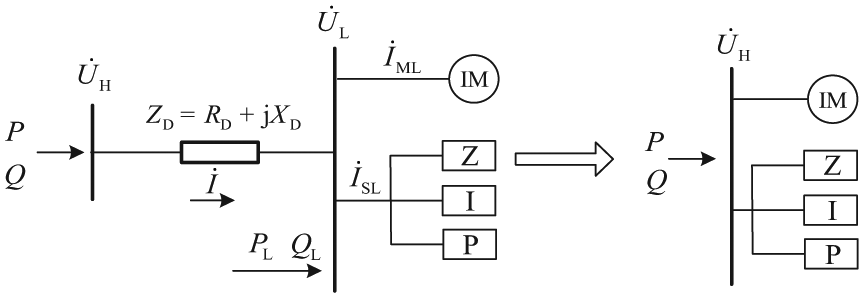
Diagram of converting load model to high-voltage side through distribution network.
In Figure 8, IM and ZIP represent the induction motor load and static load;

The relevant model parameters in equation (14) are derived from equations (15) and (16). Detail computation process is deduced at Appendix 1.


where YS = YZ + YI + YP, YZ is the equivalent admittance of constant-impedance load; YI and YP are the equivalent admittance of constant-current load and CP load respectively, which satisfy
The equivalent impedance of static load at high-voltage side converted from low-voltage side can be described as

Y H is related to the impedance of distribution system, initial voltage and power at high-voltage side additionally. The equivalent admittance of constant-impedance, constant-current, and constant-power static load can be separated from YH according to its ratio in static load model of low-voltage side.
Case study
User clustering
The data processing and user clustering procedure are developed in MATLAB R2017a. It comprises four major parts: data cleaning, data dimension reduction, data clustering, and clustering validity test. Specifically, the fuzzy clustering and data analysis toolbox in MATLAB R2017a are employed in simulation.
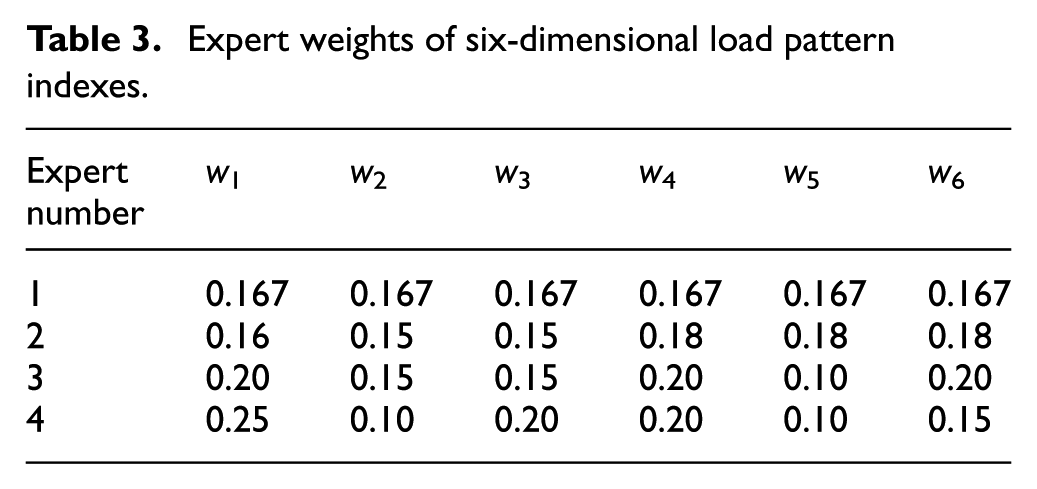
The daily load data of 1800 users in a regional power grid are derived in our research. After data cleaning, the remaining 1776 users are adopted as clustering object. And proposed six-dimensional load pattern indexes are weighted by four experts as shown in Table 3.
Expert weights of six-dimensional load pattern indexes.
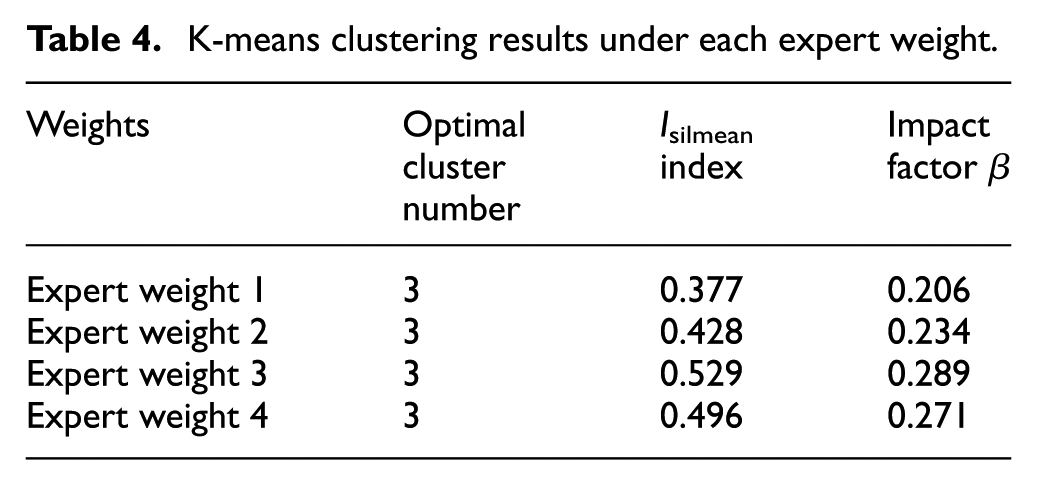
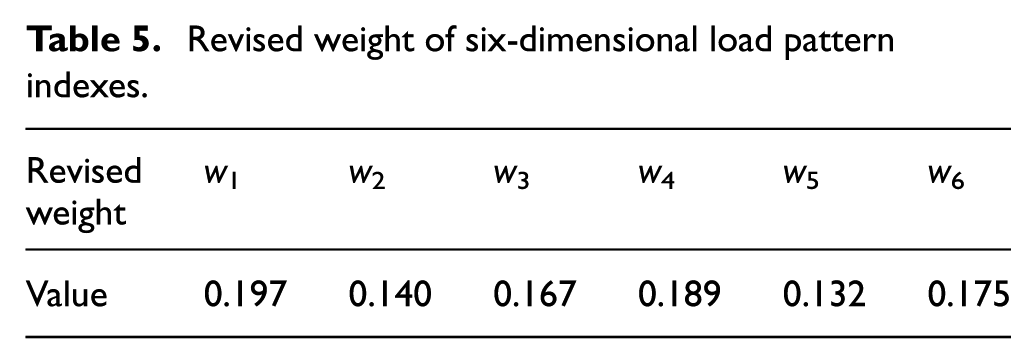
Based on four groups of expert weight schemes, all users are clustered by k-means algorithm. The value of optimal cluster number and corresponding Isilmean index under each expert weight are figured and shown in Table 4. Four groups of weights satisfy requirement and the optimal cluster numbers do not reflect major deviation. Based on the impact factor of four groups’ expert weight, the revised weight of six-dimensional load pattern indexes is figured by equation (8), shown in Table 5.
K-means clustering results under each expert weight.
Revised weight of six-dimensional load pattern indexes.
Revised weights of load pattern indexes are applied for k-means clustering. The index Isilmean is employed for clustering validity test, so as to achieve the most suitable user clustering scheme. Values of Isilmean indexes are figured out while setting different cluster numbers, as shown in Figure 9. It is apparent that Isilmean value can reach its maximum while all users are clustered for three clusters, in which case the clustering efficiency is optimal.

The values of Isilmean index under different cluster numbers.
There are respectively 763, 635, and 378 users in aforementioned three clusters through k-means clustering algorithm; the power curve sets in three clusters are shown in Figure 10.
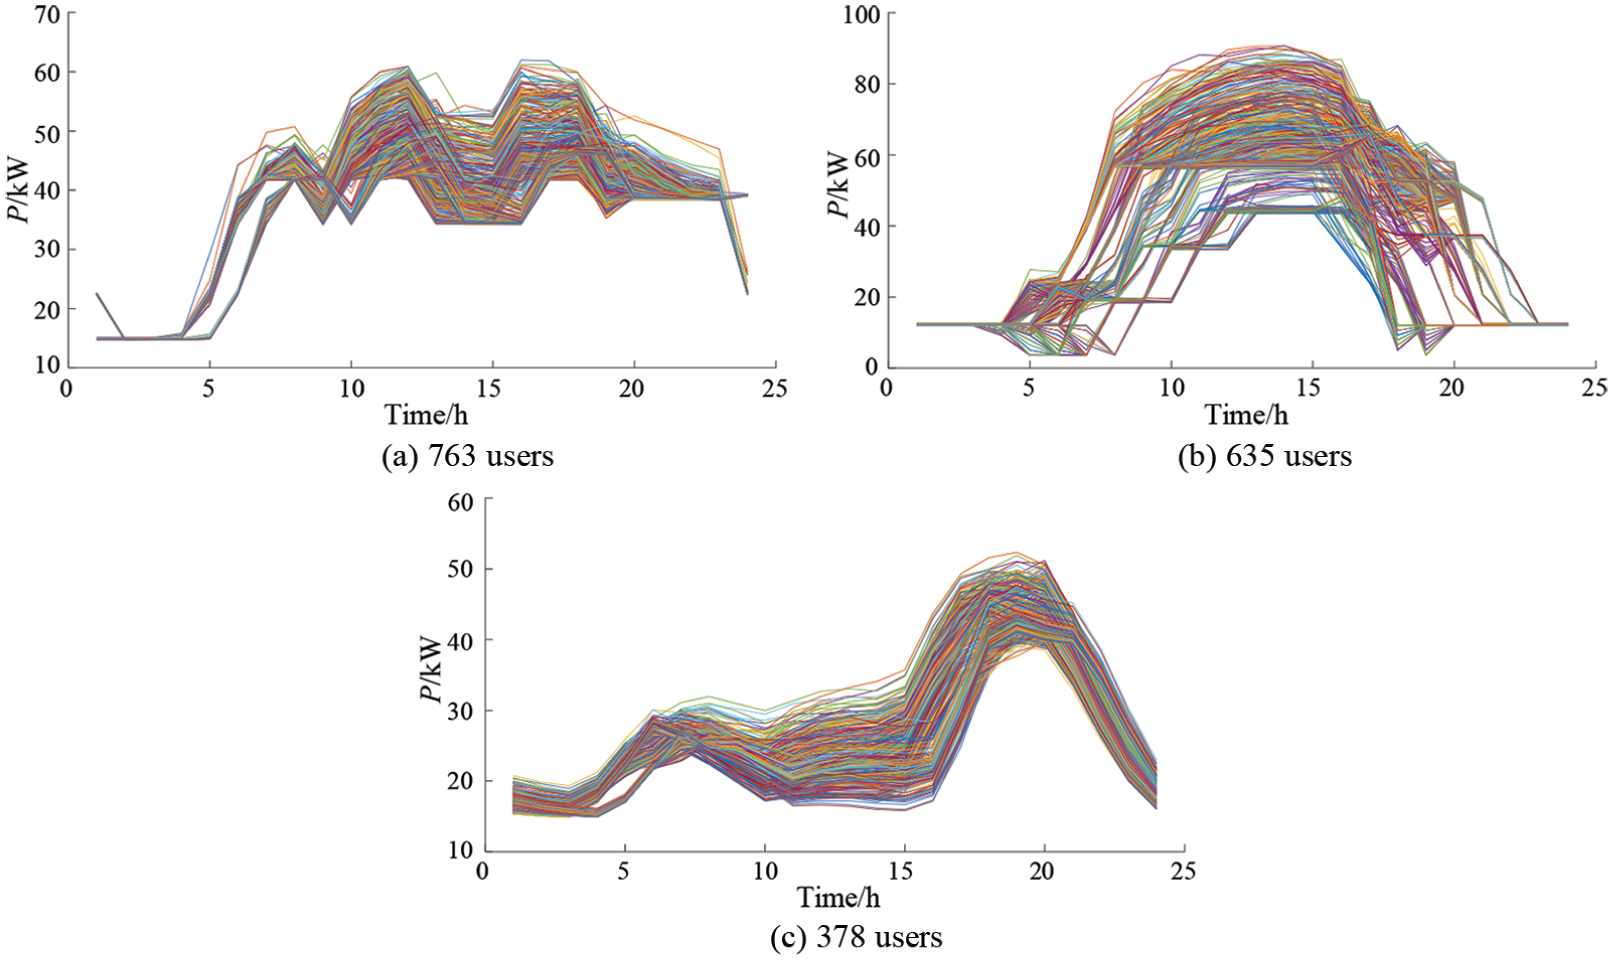
Power curve sets in three clusters.
Power curves in same cluster reflect similar characteristics. In each cluster, typical users that are closest to cluster center can be designated for intrusive load measurement and identification by deployed intelligent terminals. Consequently, the load model of all users can be retrieved real-timely based on proposed “point-to-area” concept, the procedure of which is depicted in Figure 2.
Online aggregated load modeling
In order to test the accuracy performance of proposed approach for load modeling, a simulation system is designed and built in PSCAD/EMTDC X4.5, an effective power system simulation package. As shown in Figure 11, a distribution network is connected to node 6 of Western System Coordinating Council (WSCC) 9.

Simulation system of distribution network connected with WSCC 9.
In Figure 11, the composite loads under 220V bus are assumed to denote the aggregated model of three type users, marked as load 1, load 2, and load 3. The load under 10 kV bus is a large-capacity industrial load, marked as load 4. Moreover, XT1 and XT2 are the reactance of 110 kV/10 kV and 10 kV/220 V transformers respectively; XT1 = 0.03 p.u. and XT2 = 0.02 p.u.
In Table 6, Rs, Xs, Xm, Rr, Xr, A, B, H are the basic parameters of IM load; Z%, I%, and P% represent the ratio of constant-impedance, constant-current, and CP in static load respectively; ηs is the power factor of static load; ZD = RD + jXD is the impedance of distribution line; kM is the ratio of IM load; above parameters are per-unit values. SN(MW) is the rated capacity of composite load.
Parameters of load models.

The following two load modeling approaches are imposed as a comparison:
Building the composite load model on 110 kV bus by proposed bottom-to-up aggregation and stepwise equivalent approach. Detailed processes are (1) converting load 1, load 2, and load 3 to 220 V bus via distribution lines; (2) aggregating three type loads on 220 V bus; (3) converting the aggregated model on 220 V bus to 10 kV bus via transformer; (4) converting load 4–10 kV bus via distribution line; (5) aggregating all loads on 10 kV bus; (6) converting the aggregated model on 10 kV bus to 110 kV bus via transformer, and obtaining the composite load model on 110 kV bus finally.
Under system disturbance, capturing the voltage and power data on 110 kV bus directly and identifying the composite load model parameters by measurement-based approach, which can be summarized as integral identification.
The parameters of composite load model derived from above two approaches are shown in Table 7.
Parameters of built composite load model.
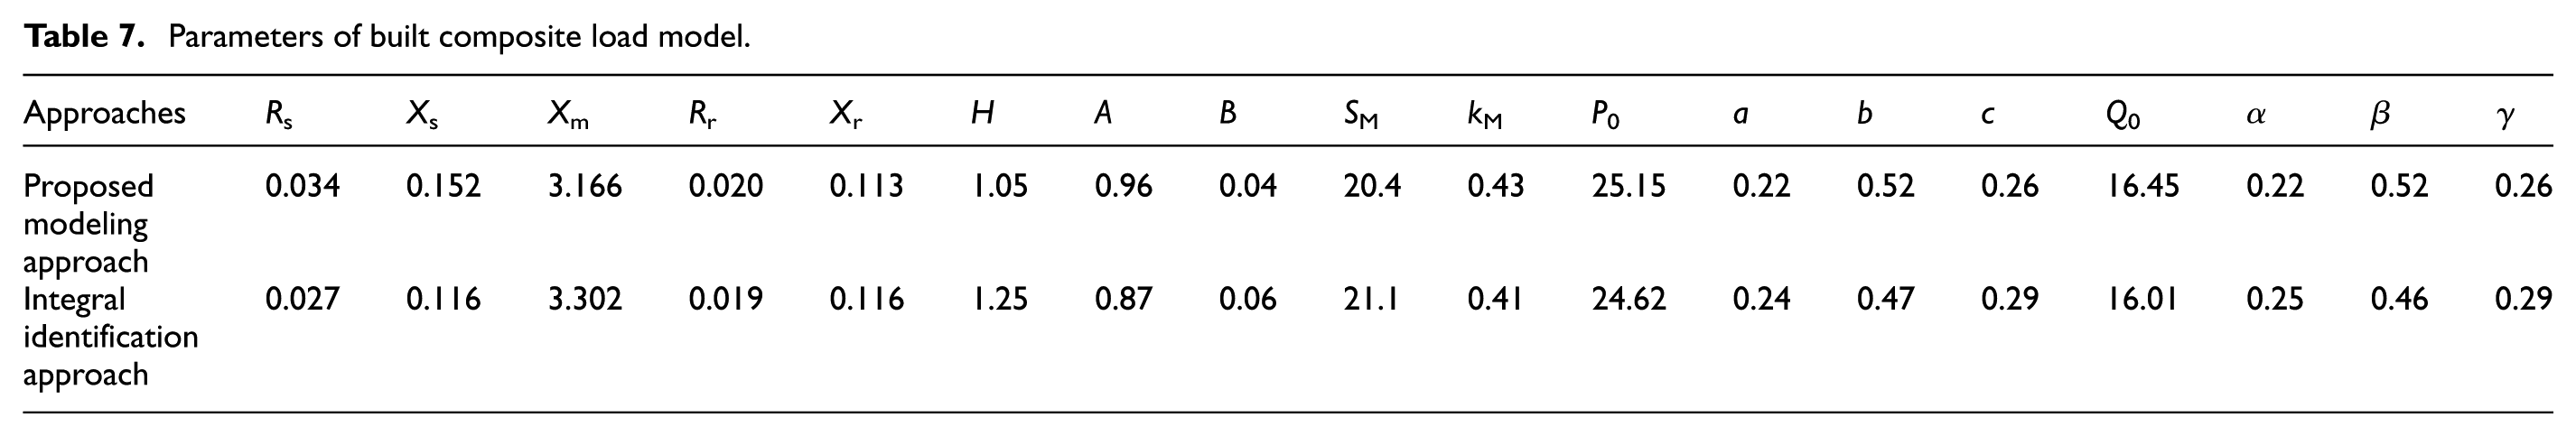
To validate the derived load models, a short-time grounding fault is imposed at bus 5. Subsequently, by considering the randomness and time-variation, an IM load in aggregated IM load 1 is switched off at 8 min. The real-time update can be achieved by proposed online load modeling, set as 10-min interval. In practical power system, the integral identification approach updates the load model for several months interval generally, and the variation of load components cannot be monitored real-timely. Table 8 shows the parameters of composite load model built by two approaches after load composition varied. Acted as the most important parameter in composite load model, the proportions of IM are compared, as shown in Table 9.
Parameters of composite load model after load composition varied.
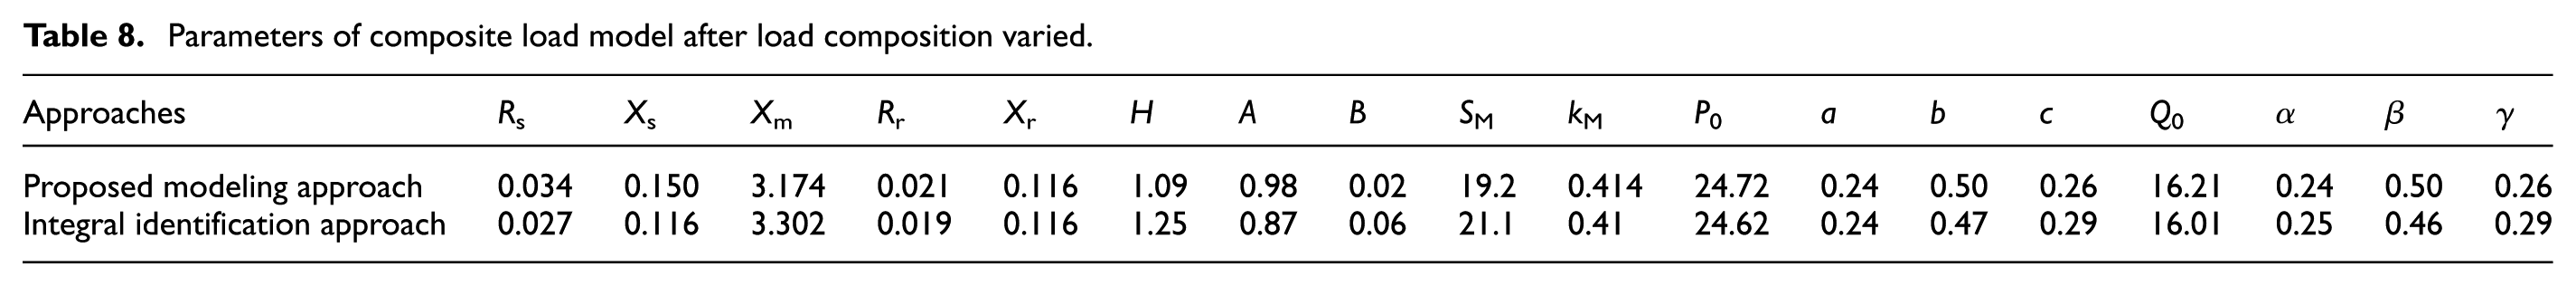
Proportions of IM load at different simulation stages.

IM: induction motor.
The composite load model built by two approaches are applied for simulation and compared with time-domain simulation. The voltage and active power trajectories of 110 kV bus under different simulation conditions are shown in Figures 12 and 13.

Voltage trajectories of 110 kV bus under different simulation conditions.

Active power trajectories of 110 kV bus under different simulation conditions.
Based on above simulation results, the average errors between time-domain simulation approach and two load modeling approaches are calculated to evaluate the accuracy of derived load model, as shown in Table 10.
The average errors of two load modeling approaches.

Results indicated that the composite load model derived from proposed approach reflects lower errors. The errors in voltage and active power simulations are 1.88% and 2.17% respectively. Moreover, more accurate load dynamic characteristic is demonstrated; for example, the minimum values of active power under system disturbance are 34.9, 35.2, and 35.8 MW, for time-domain simulation, proposed modeling approach, and integral identification approach. Specially, the variation of load composition triggers a disturbance at 8 min, which can be rapidly responded at 10 min by proposed approach.
Conclusion
The complexity and time-variation have brought great challenges for load modeling practice. In this article, a data-driven online aggregated load modeling approach is proposed and studied. Based on the big data originated from electricity consumers, a data-driven user clustering algorithm is developed by dimension reduction of load pattern indexes. Detailed information of load components are captured by dispersed intelligent terminals in typical users, so as to identify the load composition. Specially, a “point-to-area” concept is innovatively proposed for deriving all users’ load models from regional typical users. The composite load model is achieved by hierarchical aggregation and stepwise equivalence. Crucially, the time-variation of detailed load composition can be detected real-timely by proposed load modeling approach, which is unavailable for traditional load modeling approach.
Actually, proposed online load modeling approach is still at the stage of theoretical study. For future work, it is expected to be applied in practical power system, to fit actual power consumption features and validate the effectiveness. Moreover, future research will involve further exploration on demand response based on big data collected by intelligent terminals. In particular, these data are employed to aggregate users and each cluster denotes different power consumption behaviors, which can be regarded as a virtual agent to response power variation proactively.
Footnotes
Appendix 1
Equations (14)–(17) can be deduced by following process. In Figure 8, the equivalent impedance ZD of distribution network is calculated from following equations
The voltage of low-voltage bus can be derived from circuit relations in Figure 8
The voltage of low-voltage bus can be described according to the third-order induction motor model as
Integration of equations (21) and (22) is expressed as
By defining
Setting
The voltage equation of high-voltage bus can be figured out by substituting equations (25)–(27) into equation (23)
Substituting equations (25) and (26) into transient EMF equation of low-voltage side as
where
Substituting equations (25) and (26) into electromagnetic moment equation
The initial value of mechanical power is calculated from electromagnetic power while conducting initial calculation. Therefore, the mechanical power can be described as
Setting
In summary, equations (28), (29), and (34) are the primary equivalent model equations of induction motor load connected to high-voltage side.
In Figure 8, the following equation can be deduced
Above equation can be arranged as
Combined with equation (31), the equivalent impedance of static load at high-voltage side converted from low-voltage side can be described as
Handling Editor: Paolo Bellavista
Declaration of conflicting interests
The author(s) declared no potential conflicts of interest with respect to the research, authorship, and/or publication of this article.
Funding
The author(s) disclosed receipt of the following financial support for the research, authorship, and/or publication of this article: This work is supported by the National Key Research and Development Program of China (grant no. 2017YF B0903000) and the National Natural Science Foundation of China (grant no. 51577030)