
Abstract
The last two decades have witnessed a rapid increase in the applications of long-term structural health monitoring technologies to the civil structures. A wealth of field data has been collected by the structural health monitoring systems. Nevertheless, the mining of information associated with structural condition from the large database is still a great challenge. In the structural health monitoring signals, spikes are commonly encountered anomalies that have large amplitudes and may show complex spatial and temporal patterns. They can introduce significant errors in data-based condition assessment of structures. Particularly, the long-term structural health monitoring data have an extraordinarily large volume. To remove the spikes in it, the algorithm is highly desired to be both automatic and efficient. An unsupervised and fast despiking method is proposed in this article on the theoretical cornerstone of the wavelet transform. This method is implemented by two steps, namely, spike detection and spike removal. The hypothesis testing and algorithm of searching wavelet modulus maxima chain are incorporated into the spike-detection procedure. Thus, the arrival time of the spikes can be identified fast. And then, the spikes are removed by a cross-scale maxima and minima search algorithm based on the maximum overlap discrete wavelet transform, retaining the unaffected information. The inverse transformation is not required in the spike-detection step, which improves the speed of the algorithm. The spike-removal algorithm removes spikes only from their occurrence frequency bands; thus, the unaffected signal components are intact after despiking. The proposed algorithm is demonstrated using three sets of structural health monitoring data collected from a real bridge, comparing with three other approaches, that is, the time-domain method, frequency filter and traditional wavelet method.
Introduction
A rapid development of structural health monitoring (SHM) technology in civil engineering has been witnessed in the recent two decades. Permanent SHM systems have been implemented on some major civil structures. The SHM systems continuously collect data of loads, environment and responses from the structures. Thus, a wealth of long-term SHM data has been obtained. Though these data are expected to be interpreted into information about the structural condition, it is still a great challenge at present. Even though the manufacturers and industries have attempted to improve the long-term stability of the SHM systems, it is unavoidable that there are occasional errors in the sensors, signal conditioning unit, analogue-to-digital converter (ADC), or digital communication network. Consequently, the signals are usually contaminated by noises, spikes and trends, which have hindered us from taping the potential of the long-term SHM data. The spikes that have freak amplitudes are often non-physical events in the data. They can introduce errors in the data-based damage detection or condition assessment of civil structures.
The spikes in the SHM signals can originate from different sources, such as capacitive or inductive noise in the analogue signal path and communication errors in asynchronous communication protocols. 1 They do not only show average amplitude exceeding a threshold but also have unique durations and shapes. Thus, the spikes may have highly variable shapes and amplitudes. The variations make the identification and elimination of spikes challenging, and the template-based despiking methods are inapplicable sometimes. In particular, the long-term SHM systems collect an extremely huge volume of data to process, and manual and supervised despiking among plentiful channels is highly time-consuming and even impossible to perform. Therefore, robust spike-removal methods that are unsupervised and fast are particularly interested.
The main difficulty in removing spikes from large SHM data is the fast identification of spikes. There have been dozens of spike-detection methods, which can be classified into manual and automated, supervised and unsupervised ones. 2 Among the manual methods, the most common one may be the window discriminator. Signals that exceed an amplitude threshold and pass through a subsequent pair of specific boxes are identified as spikes. 3 However, this method is time-consuming when processing multiple signals due to its supervised and manual nature. Moreover, the fixed window may leave out prolonged, wide, or step-like spikes. Another widely used method is the amplitude thresholding, but this method degrades rapidly when the signal-to-noise ratios are relatively low. Other methods such as the matched filtering 4 and principle components 5 require prior modelling of ‘typical’ spike, which make these methods supervised.
After a spike is detected, it is often removed by being suppressed to zero or the level of local mean or median or replaced by a fitting-based interpolation. This method is abrupt and the real signal sources may be removed along with the spikes. For those spikes with frequencies sufficiently high for separation, the spike removal can also be achieved by low-pass filters. Nevertheless, the low-pass filters would fail if frequencies of the spikes overlap those of the underlying signals. It has also been proved that even when spike frequencies are far higher, the low-pass filter may still not be entirely sufficient to isolate the wanted signal because filters may produce ripples at sharp edges. 6
The wavelet transform (WT)7,8 is a powerful tool to analyse the complex time series. It provides the time-frequency and multi-resolution information of signals, so it is effective at detecting and removing transient phenomena like spikes. In the SHM of civil structures, the application of the WT has mainly focused on the damage detection by checking anomalies in wavelet coefficients of the vibration signals.9–15 Some scholars also use the WT in the signal processing such as data reconstruction. 16 However, the application of the WT in processing complex and large SHM data is still in its infancy.
A wavelet method was proposed based on the discrete Haar transform. 17 However, this method used inverse WT (IWT) that may be unnecessarily time-consuming. Other approaches to spike detection using dyadic wavelets.18,19 These methods mainly detect a single spike in the signal, but cannot estimate parameters such as arrival time of spikes. To remove spikes, the wavelet methods do not simply substitute the spikes with zeros, mean values or interpolations, but remove them in the wavelet domain only in their occurrence frequencies, retaining information of unaffected frequencies. Besides, they are able to robustly eliminate both high- and low-frequency spikes owing to the merit of both time-frequency and multi-resolution. The traditional wavelet-based despiking method removes the spikes by cancelling all wavelet coefficients that exceed a threshold. However, it can yield errors, and this approach significantly underestimates the initial amplitude in the case of spike series. 20
Fortunately, combining with other techniques, the weaknesses in using the WT alone are expected to be overcome. On the theoretical cornerstone of WT, an unsupervised and fast despiking algorithm is proposed in this article for the long-term SHM data collected from civil structures. Techniques of hypothesis-testing-based detection, parameter estimation and modulus maxima chain are incorporated into this algorithm. It estimates the occurrence time of the spikes fast and automatically and then removes these spikes focusing on their neighbouring time-domains in different wavelet scales, retaining unaffected information at the instant of the spikes. The spike detection is conducted at the level of wavelet coefficients directly in the hypothesis testing framework, and there is no need for an inverse transformation. This makes the spike detection fast and ideal for long-term SHM data. The despiking does not simply interpolate values at the arrival time of spikes, but removes spikes only from their occurrence frequency bands. The information from other frequencies at the spike instant can be retained.
The proposed algorithm is demonstrated by long-term data obtained from the Tsing Ma Bridge (TMB) in Hong Kong. Three sets of data are used to examine this algorithm: one set with a single spike, another with two adjacent spikes and the last one with three spikes with different shapes and durations. The results are compared with those of a time-domain method, frequency filter and traditional wavelet method. The remainder of this article is organized as follows. The motivation and particularity of the studied problem are illustrated first. The wavelet-based despiking algorithm is proposed subsequently. And then, the proposed algorithm is demonstrated by three sets of real data. Finally, conclusions are given.
Problem statement
Spikes are those signal components whose amplitudes are significantly larger than the immediate surrounding data. They may be produced by anomaly of any link in the signal path, such as the capacitive and inductive noises and communication errors. Figure 1 shows an example of the spikes embedded in the strain signals collected from the TMB. This signal reflects the structural response of the bridge deck under service loads that mainly include the highway and railway traffic. The components induced by the railway and highway traffic, respectively, have also been indicated in Figure 1. The magnitude of the spike is so large that it would significantly affect the conclusions of the data-based structural analysis.

A single spike embedded in the strain signal collected from the TMB.
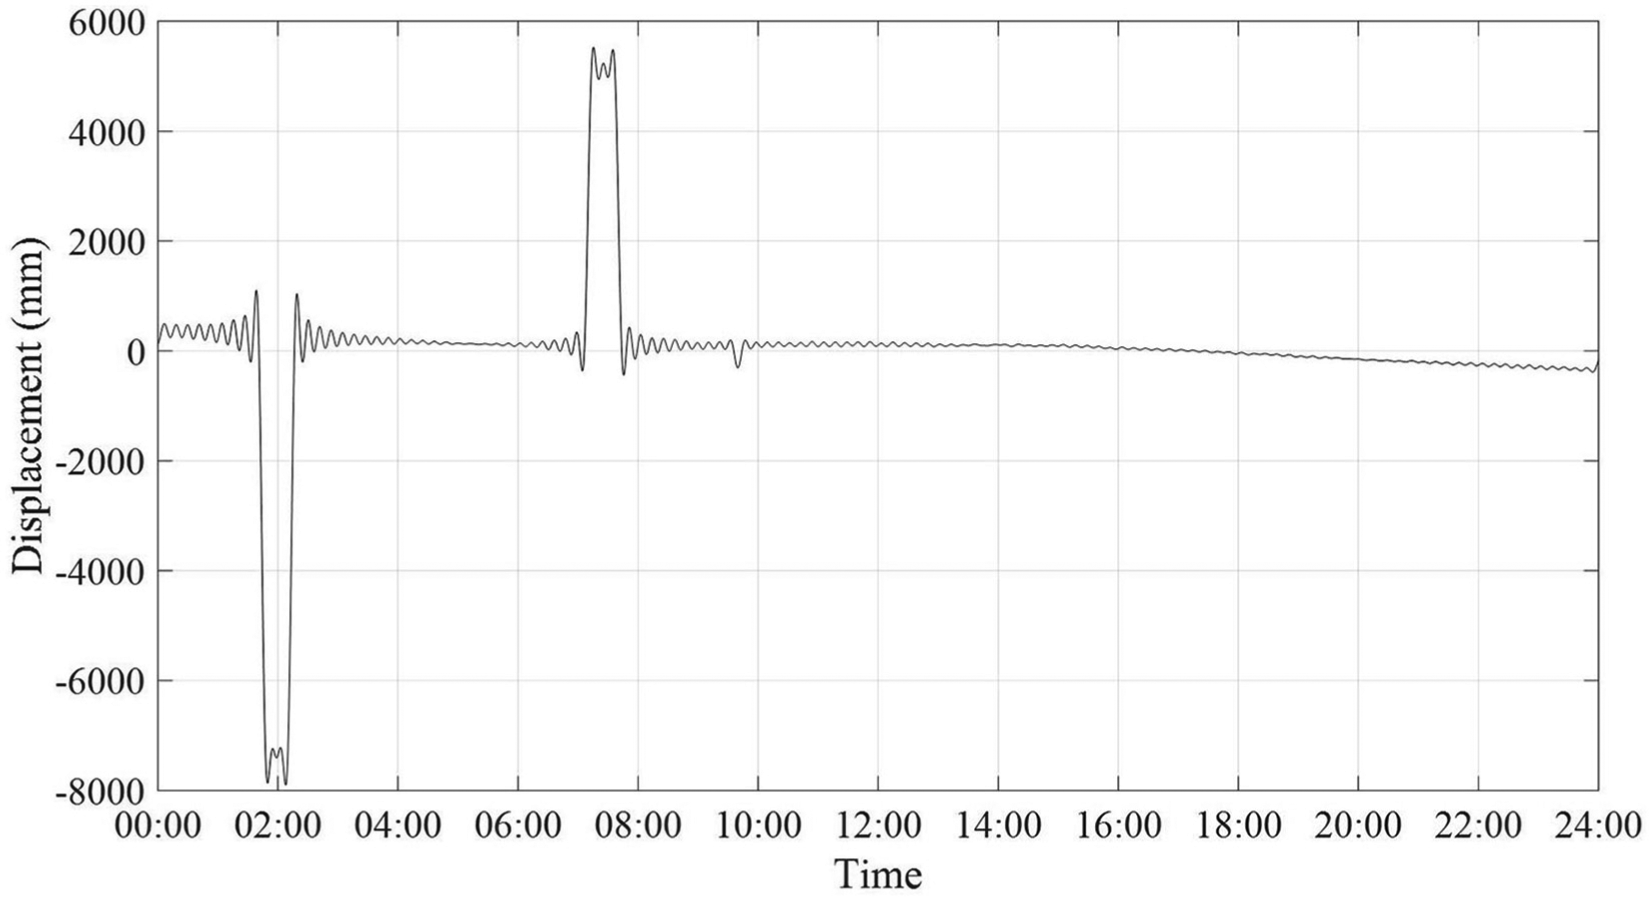
The spike shown in Figure 1 is easy to handle because it is a single spike with salient amplitude. However, the spikes in the long-term SHM data are various and complex. For example, Figure 2 shows displacement of the bridge deck measured in a full day: Figure 2(a) shows two spikes adjacent to each other, and Figure 2(b) shows three spikes with different shapes and durations. Due to the diversity of the spikes’ durations, the window discriminator method is ineffectual because the fixed window may leave out some spikes, and the frequency filters would also fail. In addition, if the spikes are removed by being replaced with zeros or local means or medians, the detailed information as shown in Figure 2(b) (those on the peak edge of the zoomed spike) would be lost. Therefore, to remove the spikes embedded in SHM signals, a multi-resolution and robust method is required, for which the WT is a promising tool.

Variety of spikes: (a) two spikes adjacent to each other and (b) three spikes with different shapes and durations.
The motivation of this study arose from the authors’ experience in evaluating the bridge condition based on long-term SHM data. The statistics of the daily maximum structural responses monitored by the SHM system was conducted to obtain the extreme value distributions and then to extrapolate the long-term return levels. However, the spikes embedded in the data have hindered this study. The data volume to tackle is incredibly tremendous because the SHM system is collecting data continuously with a high sampling rate. For example, the sampling rate for the strain monitoring of the TMB is 51.2 Hz, which implies that 4,423,680 data points would be obtained by each strain gauge in a single day. The data to handle were measured by hundreds of sensors in more than 10 years. To process the massive data, a manual technique is nearly impossible. On the contrary, an automatic and efficient algorithm is desired.
Wavelet-based despiking algorithm
The wavelet-based despiking algorithm for large SHM data involves two successive steps: (1) spike detection (time estimation included) and (2) spike removal. Techniques of statistics, hypothesis testing and wavelet modulus maxima chain are incorporated into this algorithm to complement the WT.
Spike detection
A spike-detection method 2 developed to identify spikes in neural recordings is referred to by modifying some parameters and procedures according to the characteristics of long-term SHM data. The procedure is stated briefly as follows. The multi-scale decomposition of the signal is performed first. And then, the Bayesian hypothesis testing is conducted at each scale to detect the presence of spikes. Finally, the arrival time of individual spikes is estimated by combining the decisions of different scales.
The choice of a suitable wavelet function is important for spike detection. In principle, wavelet coefficients measure the similarity between the signal and the wavelet basis. Thus, to select a spike-like mother wavelet is reasonable. Consequently, the signal will have a sparse representation. To reduce the computational cost, a limit set of scales

are used, where s0 and sJ depend on the sampling rate of the signal and the minimum and maximum durations of the spikes. The intermediate scales {s0, s1, …, sJ-1} are uniformly sampled between s0 and sJ with an arbitrary step.
Wavelet coefficients in multi-scales are obtained by the WT to represent the signal. The coefficients corresponding to the ‘spike plus signal’ are random variables with non-zero means. For unsupervised spike detection, the wavelet coefficients should be separated by estimating the noise level σ. The ideas from Donoho and Johnstone 21 are borrowed to obtain estimates of the noise level. In their method, only those wavelet coefficients that exceed a threshold are accepted, and an IWT is performed subsequently. The thresholding policy at different scales follows the hard thresholding rule

The threshold T is usually chosen as

where N is the number of samples and σ is the variance of the noise coefficients. The variance σ must be estimated from the wavelet coefficients because the noise coefficients are unknown. Assuming that the wavelet coefficients are Gaussian random variables independent on each other, the variance of the noise coefficients at scale sj is
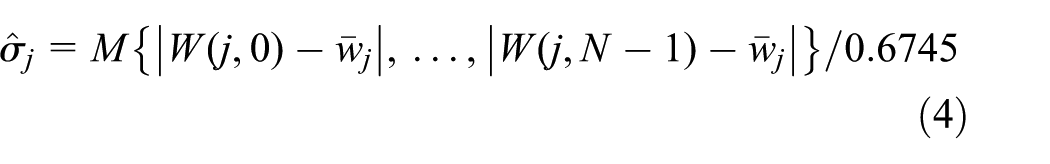
where
In this study, the threshold is estimated by hypothesis testing on the wavelet coefficients. Unlike the method of Donoho and Johnstone, 21 the IWT is not necessary and the computation efficiency can be improved significantly as a result. The spike detection is conducted in the time-scale domain through sequential binary hypothesis tests on the wavelet coefficients. The spike is not present under the hypothesis H0, while both spike and signal are present under H1. The hypothesis testing rule for each wavelet coefficient W(j, k) is 2

where
Because most of the wavelet coefficients do not contain information of spikes,

and

Therefore,
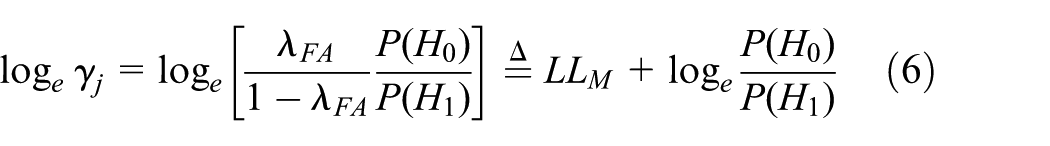
where L is in effect a new parametrization of λFA/λOM and LM = 36.7368 is a chosen scaling factor.
A spike’s wavelet coefficients are neighbours in both time and scale. Combining the sets of acceptance of H1, denoted by

where
To estimate the arrival time of spikes, the acceptance set of H1 is organized into its contiguous constituents 2
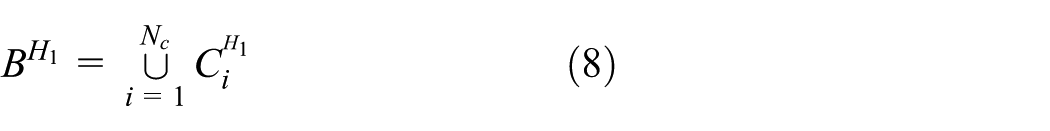
where

And then, the arrival time candidate of the ith spike is estimated by averaging

where

and ‖·‖ is the set size. Post-processing of the spike candidates is needed for those contiguous transients.
Spike removal
To robustly remove the diverse spikes that have a wide range of shapes and durations from the long-term SHM data, a method proposed in the neuroscience to remove spikes in the functional magnetic resonance imaging signals 22 is referred to. For the WT, the maximum overlap discrete wavelet transform (MODWT) 23 is employed. The MODWT has the following advantages over the traditional discrete wavelet transform that uses dyadic scales. 22 First, it is applicable for all sample sizes, so the length of signal to be analysed has no restrictions of ‘power of two’. Moreover, transient detection from coarser scales is easier due to the MODWT. And then, the wavelet coefficients at each scale are temporarily aligned based on the phase delay properties of the wavelet basis. For example, for the db4 basis, at each scale, the circular shift is defined by Ts

Therefore, all wavelet coefficients Ws,t (s represents the scale and t represents time) are redefined as

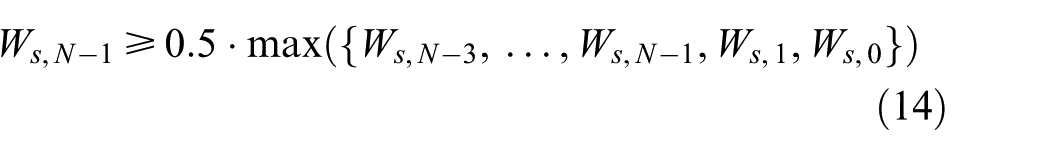
The spikes are represented as chains of maximal and minimal wavelet coefficients at the same time point in multiple scales. After the temporal alignment, the 2 × 2 neighbourhood of each coefficient is searched for maximal or minimal wavelet coefficients. 22 The maximal or minimal coefficients correspond to those with values at least half the size of the local maximum or minimum. That is, for s = {1, …, J} and t ={2, …, N − 3} 22

For t = {0, 1, N − 2, N − 1} and s ={1, …, J}, the coefficient Ws, N − 1 is considered as maximal if
and minimal if

To identify those maximal and minimal wavelet coefficients originated from spikes, a lenient threshold is employed. The survivals are denoted as

After the coefficients corresponding to the spikes have been removed, the signal can be reconstructed by the inverse MODWT (iMODWT).
The flowchart to implement the proposed algorithm is shown in Figure 3, and nine sub-steps that are indicated by the numbers in red are included. Sub-steps 1–3 correspond to the spike detection, and the following steps are used to implement the spike removal. It can be found that the IWT is not performed in the procedure of spike detection, and the spike removal only focuses on the time range corresponding to the spike. As a result, the efficiency of the algorithm has been improved significantly, which is especially important for the processing of large data. In spike removal, only those wavelet coefficients associated with the spikes are eliminated, retaining those signal components at the time of the spikes. It is more reasonable than those methods that compress the spikes to the level of local median.

Flowchart of proposed despiking algorithm.
Application to real data
Three sets of data collected from the TMB in Hong Kong are used to examine the capability of the proposed algorithm. Set 1 is the strain data that were collected at a sampling rate of 51.2 Hz. A single spike is embedded in the signal, as shown in Figure 4. Set 2 and Set 3 are the vertical displacement of the deck. They were collected at a sampling rate of 2.56 Hz. Set 2 is shown in Figure 2(a), which has two spikes adjacent to each other. And Set 3 is shown in Figure 2(b), which is contaminated by three spikes with different shapes and durations.

Time series of data set 1.
The arrival time of the spikes in the three data sets is identified based on the sparse representation of the signals and hypothesis tests on the wavelet coefficients, and the results are shown in Figure 5. The detection of spikes in Set 3 was executed in two steps because the duration of the third spike is much shorter than those of the two previous ones. The magenta lines in Figure 5 indicate the arrival time of the spikes. Focusing on the time domain surrounding the transients, the spikes are eliminated using the spike removal algorithm. The despiked signals are shown in Figure 6. It can be observed that the spikes have been well removed. The computational time is 11.24, 2.15 and 4.47 s for Sets 1 to 3, respectively. Set 1 costs much more time because its sampling rate is 51.2 Hz, much higher than those of the other two sets (2.56 Hz). Set 3 consumes more time than set 2 because it has two more spikes.

Arrival time of spikes: (a) Set 1 (17:23:38), (b) Set 2 (14:15:46 and 14:31:22, respectively), (c) Set 3 (1:44:5 and 7:9:48 for the first and the second spikes, respectively) and (d) Set 3 (9:39:48 for the third spike).

Despiked signals for: (a) Set 1, (b) Set 2 and (c) Set 3.
The proposed method is compared against three other methods: (1) a time-domain method that identifies spikes by a threshold and compresses them to the level of the local median; (2) frequency filter; and (3) a traditional wavelet method without the fast spike-detection algorithm. The time it takes to process the three sets of data using the time-domain method is much less, which is 5.09, 1.97, and 2.34 s, respectively. However, useful signal components in the red circle of Figure 2(b) are eliminated together with the spikes, as shown in Figure 7(a). In contrast, the proposed algorithm retains those signal components well (Figure 7(b)). The long-term SHM data collected from the TMB are stimulated by various loads, and the interactions between the loads and the bridge structure are intricate. Consequently, the signals are composed of multiple components. It is unavoidable that in the frequency domain, the spikes overlap with the useful signal components. Thus, it is found that the frequency filter is not able to extract the spikes as expected. Even when the frequencies of the spikes can be discriminated, a serious Gibbs phenomenon is observed. Figure 8 shows the first two spikes extracted from data set 3 by the frequency filter. The Gibbs phenomenon can be easily observed from Figure 8. The traditional wavelet method is found to be too computationally expensive because it needs to identify the chains of maximum or minimum coefficients representing the spikes from the beginning to the end of the data first. Particularly, when this method is used to process data set 1 that has a large volume, the computer stopped due to out of memory.

Drawback of time-domain method: (a) signal despiked by time-domain method and (b) information-retaining capability of proposed despiking algorithm (the signal segment is the one marked by a red circle in Figure 2(b)).
Gibbs phenomenon due to frequency filter.
The result comparison of the proposed algorithm with other three methods is shown in Table 1. Both the computational time and the effectiveness are evaluated. The consumed time may fluctuate when using different computers or the same computer at different times. It can be found that when there is a single spike that has a salient magnitude and does not contain much useful information, the time-domain method is enough. However, in general, the proposed method outperforms the other three methods. Even though in computation cost it is shaded by the time-domain method, it wins in the effectiveness. Actually, its computational cost is also acceptable, because even when it is used to process the data collected at the highest sampling rate for the bridge, the time to process the test data is only around 10 s. In particular, after thresholds are set for the algorithm based on the knowledge of a certain data type, the despiking can be performed automatically. This is of great significance to process data of large volume. Therefore, to remove the spikes embedded in large SHM data, which have complex spatial and temporal patterns, the proposed wavelet-based despiking algorithm is promising.
Result comparison.

The unit for Time is second.
Conclusion
To remove the diverse and complex spikes embedded in the large SHM data fast and robustly, a wavelet-based algorithm is proposed. Other techniques of hypothesis testing and search of wavelet modulus maxima chain are incorporated. This algorithm detects the spikes first by conducting hypothesis tests on the wavelet coefficients and combining the sets of acceptance in different scales. The arrival time of the spikes is identified in this procedure. And then, the MODWT is performed on the signals surrounding the spikes and removes the transients fast, with unaffected information intact. The performance of this proposed algorithm is demonstrated by three sets of data measured from a real bridge. These data sets are characterized by different spatial and temporal patterns. Through comparing with three other methods, the time-domain method, frequency filter and traditional wavelet method, the performance of this algorithm is demonstrated. The conclusions are as follows:
For signals with a single spike that has salient magnitude and contains little useful information, the time-domain method is enough.
Frequency filters may be incompetent to remove the spikes in long-term SHM data because of the complexity of the signals and the Gibbs phenomenon.
The traditional wavelet method loses in computational cost when processing large data, because it costs too much time in searching the spikes from the beginning of the signals to the end.
The proposed wavelet-based method combining other techniques is promising to realize fast and unsupervised removal of spikes from long-term SHM data.
Footnotes
Handling Editor: Hongyan Ma
Declaration of conflicting interests
The author(s) declared no potential conflicts of interest with respect to the research, authorship, and/or publication of this article.
Funding
The author(s) disclosed receipt of the following financial support for the research, authorship, and/or publication of this article: This work was supported by the grant from the National Natural Science Foundation of China (Grant No. 51708315) and the Provincial Key Research and Development Program of Shandong (2018GSF120017).