
Abstract
The bidimensional empirical mode decomposition algorithm is more suitable to handle image fusion than the traditional multi-scale decomposition methods in the image fusion area. Nevertheless, there are several inherent problems of empirical mode decomposition, such as the mode mixing problem or end effects problem. As an improved empirical mode decomposition method, the ensemble empirical mode decomposition improves the empirical mode decomposition, by averaging the modes of all noise-added signals, in order to improve the mode mixing problem. In this article, an adaptive image fusion algorithm based on the representation of bidimensional ensemble empirical mode decomposition is proposed. This novel algorithm decomposes the source image by the bidimensional ensemble empirical mode decomposition algorithm, and a pixel-level weighting fusion method is then presented based on the entropy of intrinsic mode function; the fusion image can thus be obtained by inversing bidimensional ensemble empirical mode decomposition on the composite representation. Based on the quantitative comparison results, the proposed algorithm provides fusion performance to the Laplacian pyramid and wavelet transform methods. In addition, the proposed algorithm has adaptive capabilities and does not need any predetermined filters or wavelet functions.
Introduction
Image fusion technology is a very important branch of multi-sensor information fusion—visual information fusion, this method has attracted worldwide attention in the past two decades.
Image fusion is the synthesis of multiple images from different sensors in order to obtain a new image and satisfy certain requirements. 1 In the field of digital image processing, image fusion is usually used for image sharpening to improve the accuracy of image collection correction. Therefore, the certain features cannot be represented in any single original image and thus provides a more complete data set for the classification recognition system. Since the new image fusion technology continues to emerge with the development of image processing, data fusion, and wavelet transform, image fusion is now considered to have a number of applications in military and civil technologies. 2 The image fusion technologies can be divided into three levels based on the degree of abstraction of input and output information, namely, pixel-level fusion, feature-level fusion, and decision-level fusion.
Pixel-level fusion is a direct fusion method for the original image data layer. The fusion of human eye color information is a typical pixel-level fusion. Pixel-level image fusion is the lowest level of image fusion. This level of data fusion has the highest accuracy and can thus provide details that are not available at other levels. However, the amount of information needed to be processed is large. Pixel-level fusion is the basis of high-level image fusion and is one of the focuses of the current image fusion research. 3 Currently, several methods that are commonly used for pixel-level image fusion can be found in the literature: weighted average method, based on Laplacian pyramid method,4–8 or gradient pyramid method and image fusion algorithm based on wavelet transform.9,10
With the rise and perfection of wavelet transform theory, wavelet transform has been widely used in the image processing field. 11 The image wavelet decomposition method is also a kind of image multi-scale and multi-resolution decomposition method. It can be regarded as a special image’s tower decomposition; since the wavelet is non-redundant, the total amount of data cannot be increased by wavelet image decomposition. Using this feature, one can simulate the visual characteristics of the human eye in different directions of high-frequency components for different resolutions, in order to obtain better fusion images. 12 From the characteristics of the wavelet transform, it can be seen that the image fusion method based on wavelet transform has greater advantages than the traditional image fusion methods. As an advanced approach, the data fusion technology is presented to combine pieces of information from different sensors, in order to achieve more specific inferences and accuracy. This advanced approach has been widely used in many applications.13–16
The image fusion process based on wavelet decomposition is shown in Figure 1. First, the image fusion method decomposes the images of each source image participating based on wavelet transform, in order to form their own multi-scale description. Second, data fusion is performed on the corresponding sub-images of each wavelet decomposition image based on a certain fusion rule, in order to form a multi-scale description of the fused image. Finally, an inverse wavelet transform is used to reconstruct the fused image. Taking the two image fusions as an example, the main flow of image fusion algorithm based on wavelet transform is shown in Figure 1. The main process is summarized as follows:
Wavelet transform is performed on each source image separately, and the wavelet tower decomposition of the image is established, which is equivalent to using a group of filters to remove high-frequency information from low-frequency information.
Each decomposition layer is then fused, and different frequency components on each decomposition layer are processed by different fusion operators. At this stage, the fused wavelet pyramid can be obtained.
The wavelet pyramid is subjected to wavelet inverse transform (i.e. image reconstruction), and the resulting reconstructed image is a fused image.

Image fusion process based on wavelet decomposition.
However, there are also some problems in the image fusion method related to the wavelet transform. For example, the wavelet transform has no self-adaptive ability for signals and images, and the results of the image fusion algorithm based on different wavelet bases are quite different. In addition, the image fusion based on wavelet transform is developed for the transformation of each pixel or local feature for the small area. The disadvantage of this method is weak correlation characteristics of local features. Therefore, it is necessary to carry out research on the image fusion methods with strong adaptive ability and preservation of local feature correlation, in order to improve the adaptability of the fusion method and the fusion effects.
The one-dimensional (1D) empirical mode decomposition (EMD) algorithm was originally developed by NE Huang et al. 17 proposed in 1998, which is a signal processing method based on the signal itself and is suitable for analyzing non-linear and unstable signals. Different from wavelet decomposition, it has no basis function and can be considered as a complete self-adaptation method. In 2003, JC Nunes et al. 18 extended the EMD algorithm from 1D to two-dimensional (2D) signal processing and proposed a bidimensional empirical mode decomposition (BEMD) algorithm. The BEMD algorithm is basically similar to the 1D one, but when the maximum envelope and minimum envelope are calculated, it is based on the entire bidimensional surface. First, the local maximum point (local minimum point) of the entire surface is found, and then the surface of the entire maximum (or minimum) is fitted or interpolated, as well as the mean surface, and finally the intrinsic mode functions (IMFs) and the residue can be found. In view of the advantage of the EMD method in the signal processing, the BEMD method has been applied into the field of image fusion now and has achieved several good results.19–22
Due to the limited real image resources in imaging tracking research, there are many problems that need to be solved, such as high cost, few samples, and constrained test conditions. In this article, an image fusion method based on bidimensional ensemble empirical mode decomposition (BEEMD) is proposed based on the pixel-level fusion strategy, in order to reduce the inherent defects of the EMD method, improve the adaptability of the fusion method and fusion effects, and further preserve the local correlation. Moreover, the limited real-shot or simulated multi-source images are used to generate fused images in specific application scenarios, in order to achieve the expansion of image resources and further provide a large number of image resources for more efficient imaging tracking research.
The BEEMD image decomposition method
Since the BEMD algorithm is calculated using the classical EMD algorithm, the inherent mode mixing problem of EMD still exists. 23 For this reason, based on the idea of the 1D EEMD method,23–25 this article extends the EEMD method to 2D and designs a BEEMD image decomposition method.
The BEEMD method
For a 2D
During external initialization, adding a group of zero mean and equal variance random white noise matrix to the original image
BEMD decomposition of the images in the image collection obtained after adding noise is performed. The specific decomposition process is as follows: i. External initialization. The image to be decomposed is ii. The jth IMF is extracted as follows: (a) Internal initialization. (b) Morphological algorithms or eight-neighborhood pixels are used to find maxima and minima points in (c) Perform envelope fitting on maxima and minima, respectively, to form a 2D image envelope surface (d) Calculate the average of the maxima and minima envelopes
(e) Subtract the mean from the image
(f) Judging whether the IMF condition is satisfied,
17
if the IMF condition is satisfied, the current calculation is terminated. The jth IMF can be expressed as
Otherwise make iii. The residue calculation is iv. The BEMD decomposition result is
where


Repeat the above steps for each image
Calculate the mean of the m group IMF components
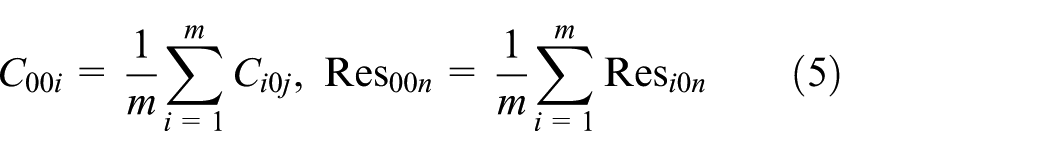
Then the inverse transformed image can be represe-nted as
In the process of BEEMD decomposition, since the white noise has a stochastic property with zero mean and equal variance, the overall average of all BEMD decompositions is used as the final decomposition result of the IMF component, and the white noise impact can then be eliminated. Compared with the traditional BEMD method, the BEEMD method based on the EEMD method can reduce the mode mixing problem, the end effect and the phantom modal component, thus retaining the advantages of the BEMD method. The IMFs’ decomposition is a process that decomposes the minimum scale to the maximum. It extracts the detailed edge information of the image and then filters the smooth region from the image. This is similar to the wavelet decomposition process. However, if wavelets are selected from different wavelet basis functions, the decomposition results are totally different. This is the reason why we use the EMD-based method: there are no basis functions in the EMD method. In addition, the EMD decomposition process has the advantage of retaining the correlation of local features and thus can capture the relevance of local features.
The BEEMD method validation
In order to verify the feasibility of the BEEMD method, a Gaussian noise reduction test was first performed. For the original source picture shown in Figure 2(a), Gaussian noise with zero mean and variance of 0.1 is superimposed, as shown in Figure 2(b).

(a) Original image and (b) noise image to be processed.
By performing the BEMD decomposition process for the image in Figure 2(b), the number of decomposition IMFs is selected as 4, and the results of BEMD decomposition IMF and reconstruction are shown in Figure 3.

Results of BEMD decomposition and reconstruction: (a) first IMF image; (b) second IMF image; (c) third IMF image; (d) fourth IMF image; (e) residue image; and (f) BEMD inverse transform image.
From the above decomposition results, it can be seen that after BEMD decomposition the noise is mainly contained in the first and second IMF images. Thus, in order to filter noise, three methods can be used.
One is to directly mean filtering the noise image (the size of the mean filter is 5). The second method is to perform BEMD decomposition on the noise image and mean filtering the first and second IMFs; the final image can be reconstructed by BEMD inverse transform. The third method is to use the BEEMD decomposition method proposed in this article to perform EMD decomposition on multiple noisy pictures with superimposed white noise. The first and second IMF images are mean filtered and then reconstructed. Finally, weighted fusion is performed based on the entropy of each reconstructed image in order to obtain the final image. The noise reduction effect of each method is quantitatively compared with the peak signal-to-noise ratio (PSNR) index, which is an objective evaluation index of image quality. The image processing results of the above three methods are shown in Figure 4. The influence of the number of image sets in the BEEMD method on the processing result is analyzed. The number of the noise image sets for BEEMD is, respectively, set at

Comparison of processing results of the three noise reduction methods: (a) mean filter noise reduction image; (b) using BEMD decomposition and mean filter noise reduction image; (c) BEEMD parameter m = 5; (d) BEEMD parameter m = 10; (e) BEEMD parameter m = 20; and (f) BEEMD parameter m = 50.
The comparison of the PSNR index is shown in Table 1 and the processing results are shown in Figure 4. It can be seen that the noise can be filtered more specifically, and the original image information is then retained as much as possible to improve the image processing quality. By comparing the index in Figure 4(b) with those in Figure 4(c)–(f), it can be seen that the BEEMD decomposition avoids the inherent problems of BEMD, improves the decomposition of different frequency signals, increases the accuracy of the mean filter in the processing of high-frequency signals, and further improves the noise reduction effects.
PSNR index for different methods.

PSNR: peak signal-to-noise ratio; BEMD: bidimensional empirical mode decomposition; BEEMD: bidimensional ensemble empirical mode decomposition.
As can be seen from Table 1, with the increase in the image set number in the BEEMD decomposition method, the advantages of the BEEMD decomposition appear, the signal decomposition capability increases, the details become more prominent, and the noise blurring effects become more obvious.
The BEEMD image fusion method
Based on the above BEMD method, an image fusion algorithm is proposed. First, the layered fusion process based on pixel-level image fusion is adopted. After the BEEMD decomposition, the pixel-level fusion is performed on the different frequency IMF component segments. Since the image components in different frequency segments are directly separated by BEEMD, the fusion rules are different from the wavelet-based fusion method. In this case, the fusion rule is linear weighted fusion and the weight ratios of IMF components are used in different frequency bands on the same scale space.
The fusion process is shown in Figure 5, and the specific fusion algorithm steps are as follows:
According to the aforementioned BEEMD algorithm, the images A and B to be fused are, respectively, subjected to BEEMD, and the same noise-added image number of image sets is used, which is
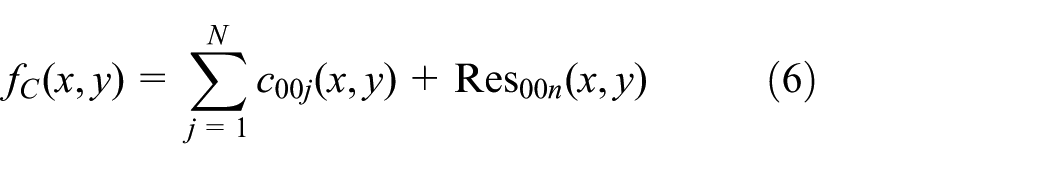
The IMF components


where

where

where

where

where
The inverse transform is used to obtain the fused image
Finally, all the fused images are averaged in order to obtain the final fused image

From the above steps of the algorithm, we can see that, when the number of image sets is one and the mean value of random noise is zero, this method becomes an entropy-weighted image fusion algorithm based on BEMD.

Image fusion process based on BEEMD.
Image fusion evaluation
The quality of the fused image includes three meanings: detectability, resolution, and scalability. How to evaluate the quality of the fused images is an important issue for image fusion. At present, methods for evaluating the effects of image fusion include evaluation of information volume, statistical characteristics, signal-to-noise ratio, and wavelet energy. In order to quantitatively analyze the quality of fused images, 26 the commonly used evaluation indices including standard deviations, 27 mutual information (MI), 28 and entropy are used.
Standard deviation
The standard deviation reflects the dispersion of an image grayscale with respect to the grayscale average value. 27 The standard deviation is defined as follows

where

To some extent, the standard deviation can also be used to evaluate the image contrast. If the standard deviation is large, the grayscale distribution of the image is dispersed and the contrast of the image is high; thus, more information can be observed. If the standard deviation value is low, the tone is single and uniform, and thus too much information cannot be found.
Entropy
Based on Shannon’s information theory, information entropy can be used to reflect the amount of information. If the entropy of the fused image increases, the fused information is increased, and thus a better fusion quality. The information entropy of an image is defined as

where L is the total number of gray levels for the image and

where
MI
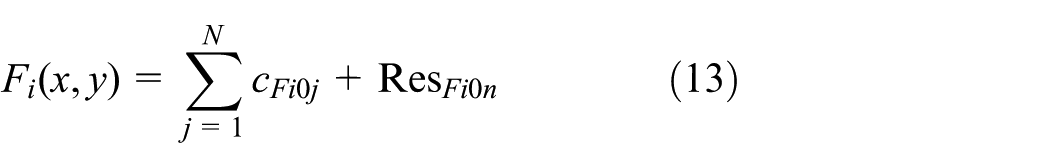
MI is an important concept in information theory and describes the correlation between two systems. 28 In image registration, the MI of two graphs reflects their mutual inclusion degree through their joint entropy. For two images A and F, the MI can be represented as

where
The digital image joint probability distribution
Thus, the fusion MI can be expressed as

where
Based on the above three commonly used evaluation indices, the evaluation criteria for fused image quality are given as follows:
A large standard deviation value means a great image contrast, and thus more information and better fusion effects can be achieved;
The entropy reflects the amount of information contained in a fused image; the larger the entropy value, the better the fusion effects.
If the MI value
Image fusion effect analysis
In order to validate the feasibility of the proposed fusion algorithm, three typical fusion applications, such as (1) visible light fusion, (2) infrared image fusion, and (3) visible light and infrared image fusion are taken as the study cases. The Laplacian pyramid fusion algorithm,6,7 the discrete wavelet (Haar wavelet is used as wavelet basis function) fusion algorithm, 12 and the BEMD fusion method based on entropy weight 29 are performed for quantitative comparison of image fusion quality.
The study case of visible light image fusion
The purpose of this visible light image fusion case is to fuse high-resolution pictures (Figure 6(a)) with low-resolution color images (Figure 6(b)) of the same location, in order to obtain a higher resolution color visible light image.
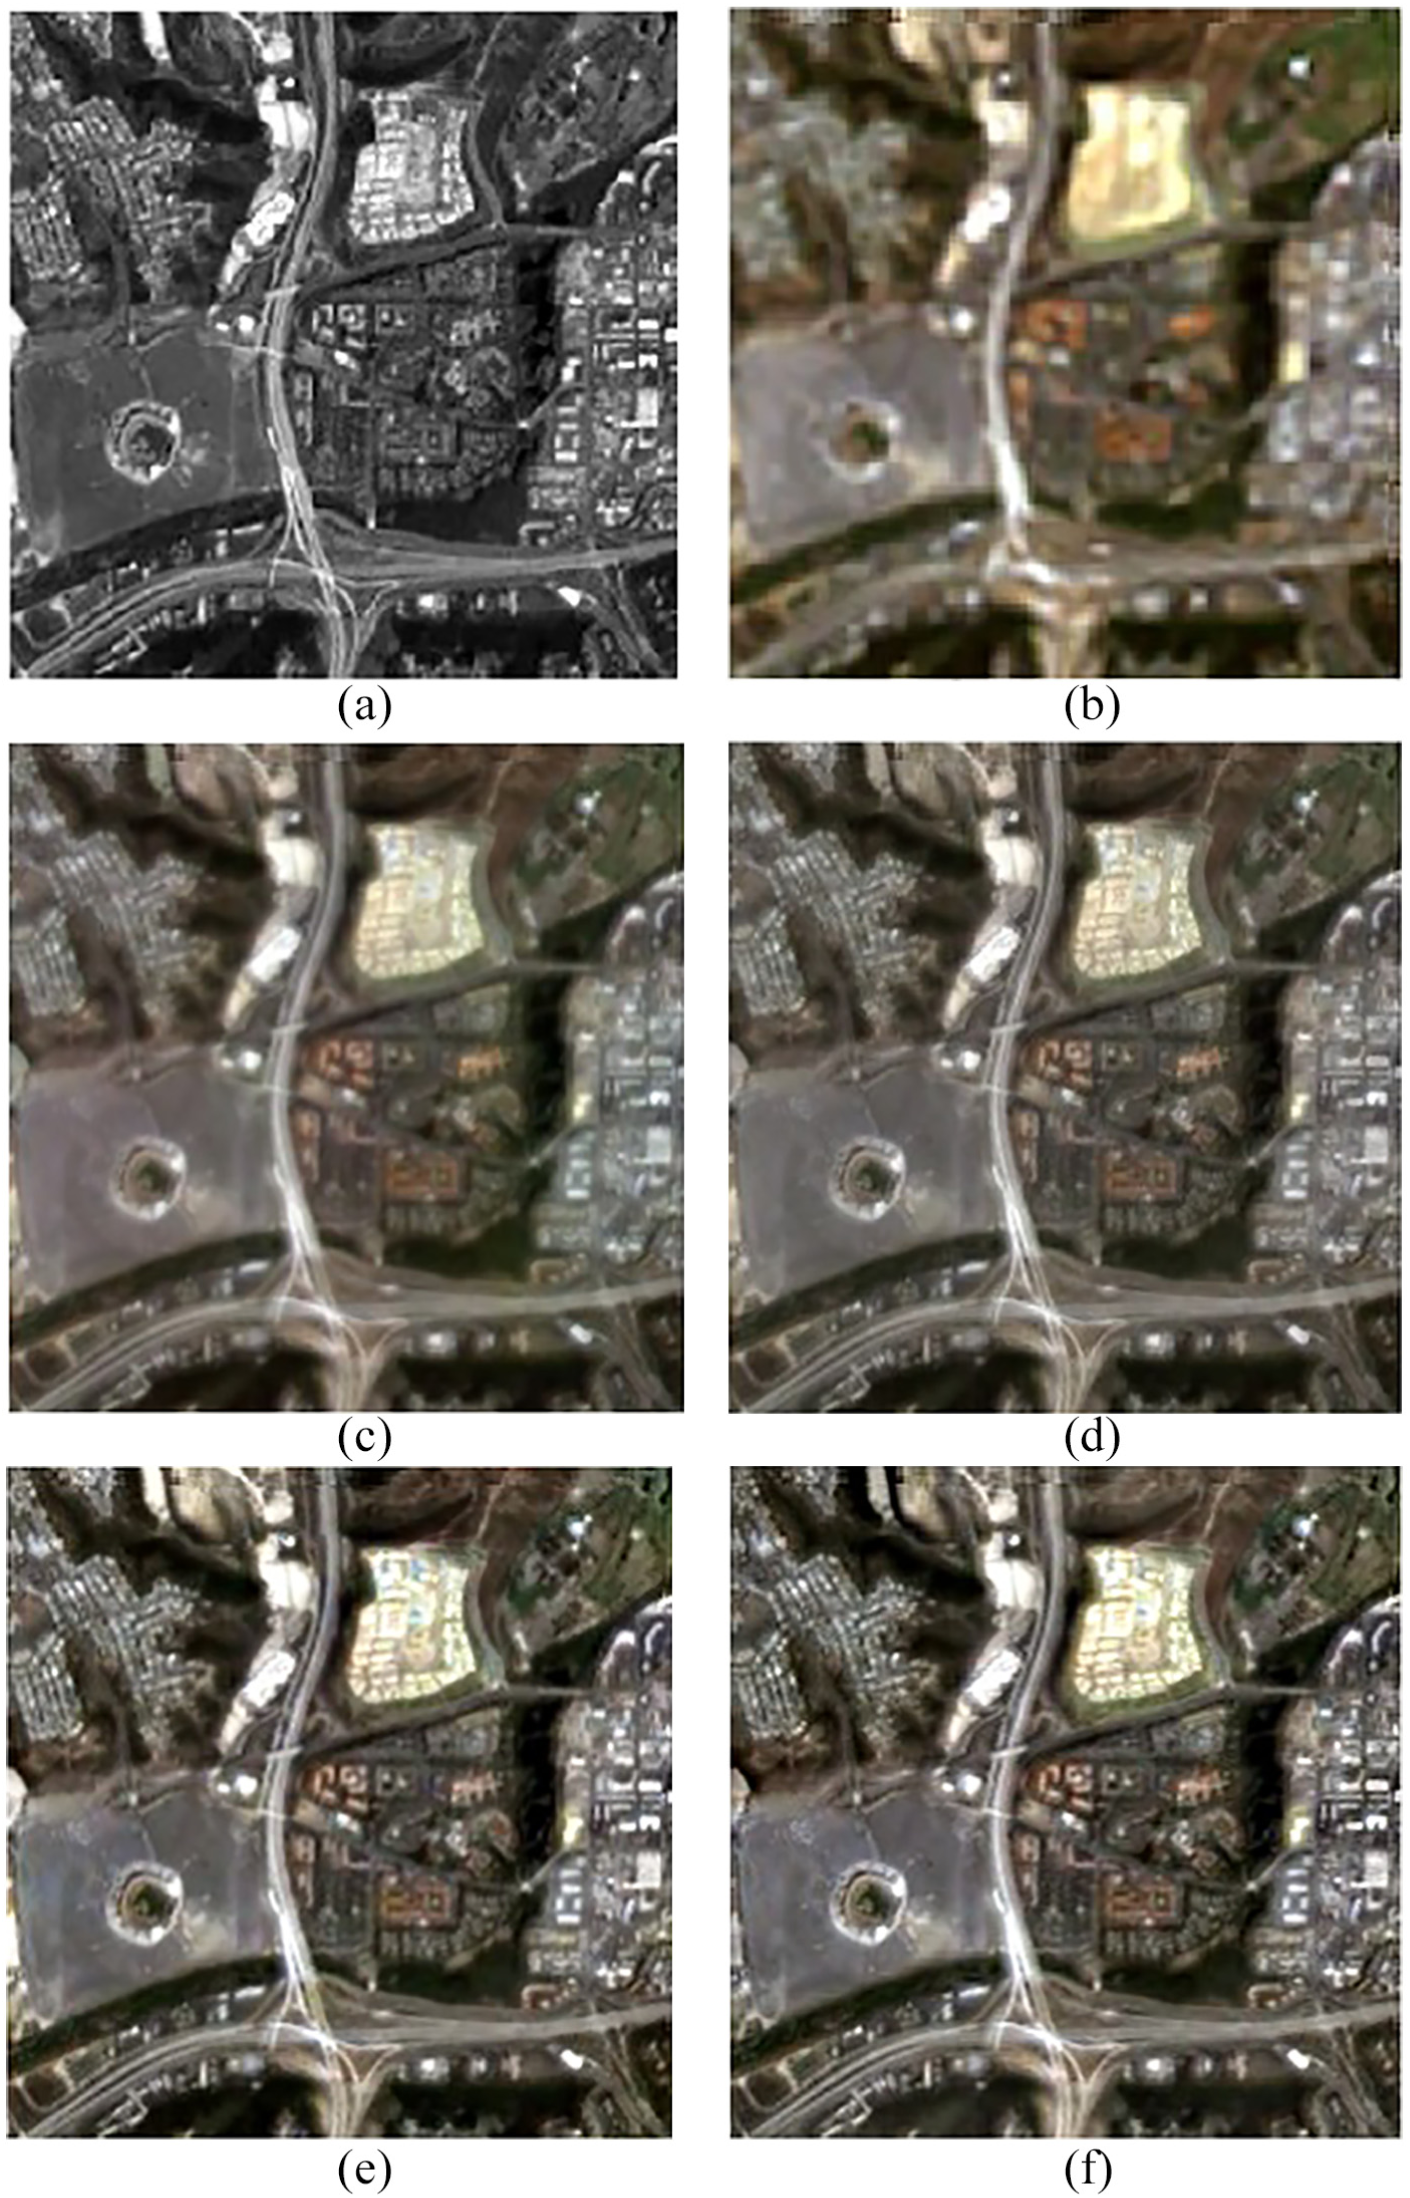
Visible light image fusion results: (a) high-resolution grayscale source image; (b) low-resolution color source image; (c) Laplacian pyramid fusion; (d) discrete wavelet fusion; (e) BEMD–entropy-weighted fusion algorithm; and (f) BEEMD–entropy-weighted fusion algorithm.
Evaluation of the fusion effect based on the Laplacian pyramid algorithm
Selecting the Laplacian pyramid decomposition layer number from 2 to 5, the evaluation of the image fusion quality under different decomposition layer numbers is calculated, as shown in Table 2. From Table 2, the best fusion effect can be observed when the number of decomposition layers is 5, and the standard deviation and entropy are the maximum.
Visible light fusion quality based on the Laplacian pyramid and discrete wavelet fusion algorithms.

Bold values indicate the optimal value for each column or different methods.
Fusion effect evaluation based on the discrete wavelet fusion algorithm
The number of decomposition layers for discrete wavelet transform ranges from 2 to 5, and the image fusion quality under each decomposition layer number is evaluated, as shown in Table 2. From Table 2, the best fusion effect can be observed when the number of levels is 5, where the standard deviation and MI are in the middle level, and the fusion effect is relatively balanced.
Evaluation of the fusion effect based on the BEMD and entropy-weighted fusion algorithm
The IMF number of the BEMD method ranges from 2 to 5, and the fused image quality at different IMF numbers is evaluated. The calculation results are shown in Table 3.
Visible light fusion quality based on the BEMD–entropy-weighted fusion algorithm.

BEMD: bidimensional empirical mode decomposition; IMF: intrinsic mode function.
Bold values indicate the optimal value for each column or different methods.
From Table 3, the fusion effect is better when the IMF number is 5, where the largest value of MI can be observed, while the standard deviation and the entropy index are not sensitive to the IMF number.
Evaluation of the fusion effect based on the BEEMD and entropy-weighted fusion algorithm
In the BEEMD algorithm, the IMF number is set to 4, the number of the image sets is set to be 5, 10, 20, and 50, respectively, and the fusion quality of fusion images under different numbers of image sets is evaluated, as shown in Table 4.
Visible light fusion quality of the algorithm proposed in this article.

Bold values indicate the optimal value for each column or different methods.
From Table 4, with the increase of the image number of image sets, the initial fusion effect is improved, and the later fusion effect is slowed down by the image number of image sets. When the number of images is 20, the standard deviation and MI are the maximum, and entropy is not sensitive to changes in the image number.
Comparison of the fusion effects
The optimal results of the above algorithm cases are summarized in Table 5, and the fusion effect of each algorithm is shown in Figure 6(c)–(f).
Optimal visible light fusion image fusion quality for each algorithm case.

BEMD: bidimensional empirical mode decomposition; BEEMD: bidimensional ensemble empirical mode decomposition.
Bold values indicate the optimal value for each column or different methods.
From the comparison of the above optimal fusion results, we can see that the proposed BEEMD fusion method achieves the best fusion effect. In terms of standard deviation and MI, the proposed method works best, that is, 4.6% and 2% higher than the second best results. In terms of entropy index, the difference between the proposed method and the best effect is only 0.6%. Thus, the standard deviation and MI are the optimal results, while the entropy is almost the same.
The study case of infrared image fusion
The purpose of this fusion case is to fuse the infrared images to obtain a specific infrared scene image. Since the two images are obtained using different methods, the two images are not of the same size, as shown in Figure 7(a) and (b), and the infrared object needs to be expanded before fusion. When entropy weights are used, the local picture entropy containing the object region is used as a source of fusion weights.

Infrared image fusion results: (a) infrared background image; (b) infrared object image; (c) Laplacian pyramid fusion;(d) discrete wavelet fusion; (e) BEMD–entropy-weighted fusion algorithm; and (f) BEEMD–entropy-weighted fusion algorithm.
Evaluation of the fusion effect based on the Laplacian pyramid algorithm
Selecting the Laplacian pyramid decomposition layer number from 2 to 5, the evaluation of the image fusion quality under different decomposition layer numbers is calculated. The calculation results are shown in Table 6.
Infrared fusion quality based on the Laplacian pyramid and discrete wavelet fusion algorithms.
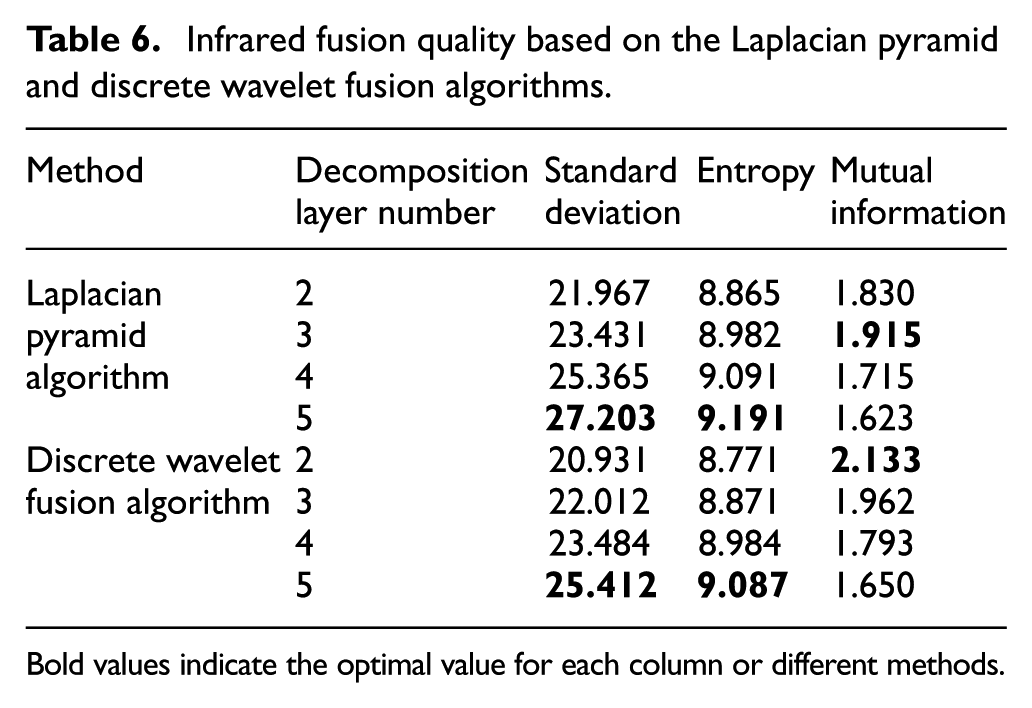
Bold values indicate the optimal value for each column or different methods.
As can be seen from Table 6, when the number of decomposition layers is greater than 4, MI decreases and the fusion effect of the four layers’ decomposition is selected.
Fusion effect evaluation based on the discrete wavelet fusion algorithm
The number of decomposition layers for discrete wavelet transform ranges from 2 to 5, and the image fusion quality under each decomposition layer number is evaluated. The calculation results are shown in Table 6. From Table 6, it can be seen that, with the increase of the number of decomposition layers, the trend of each index is different. Thus, the number of decomposition layers of 5 is considered as the ideal result of this method.
Evaluation of the fusion effect based on BEMD–entropy-weighted fusion algorithm
The IMF number of the BEMD method in this algorithm ranges from 2 to 5, and the fused image quality at different IMF numbers is evaluated. The calculation results are shown in Table 7.
Infrared fusion quality based on BEMD–entropy-weighted fusion algorithm.

BEMD: bidimensional empirical mode decomposition; IMF: intrinsic mode function.
Bold values indicate the optimal value for each column or different methods.
From Table 7, it can be seen that the three indices are close to the maximum index when the decomposition IMF number is 5.
Evaluation of the fusion effect based on the BEEMD and entropy-weighted fusion algorithm
In BEEMD, the IMF number is set to 4 and the image number in the image set is set to be 5, 10, 20, and 50, respectively. The fusion quality of fusion images under different numbers of image sets is evaluated, as shown in Table 8.
Infrared fusion quality of the proposed BEEMD algorithm.

BEEMD: bidimensional ensemble empirical mode decomposition.
Bold values indicate the optimal value for each column or different methods.
From Table 8, for a fixed decomposition IMF number, the change of each index value is not obvious with the increase of the image number. Thus, the best effect of this method is selected when the number of image sets is 10.
Comparison of the fusion effects
The optimal results of the above algorithms are summarized in Table 9, and the fusion effect of each algorithm is shown in Figure 7(c)–(f).
Optimal infrared fusion image fusion quality for each algorithm.

BEMD: bidimensional empirical mode decomposition; BEEMD: bidimensional ensemble empirical mode decomposition.
Bold values indicate the optimal value for each column or different methods.
From the above comparison, it can be seen that the BEMD fusion method has obvious advantages in the MI index. However, it is not dominant in the other two indicators. Compared with the BEMD method, there is a certain degree of improvement in the three indicators when using the BEEMD method. This can be seen from the visual effect of the fused image. In terms of standard deviation and MI indices, the proposed method works best, specifically, 4.5% and 3% higher than the second best result. In terms of entropy index, the index value of the proposed algorithm is slightly lower than the Laplace pyramid algorithm, while the other two indices are much higher (4.6% and 65% for standard deviation and MI, respectively). Thus, the integrated fusion effect of the proposed BEEMD algorithm can be considered as the best one.
The study case of visible light and infrared image fusion
The purpose of this fusion case is to fuse the visible light image and the infrared image at the same location to obtain a fused image that reflects more details. The original image is shown in Figure 8(a) and (b).

Visible and infrared image fusion results: (a) visible light gray source image; (b) infrared source image; (c) Laplacian pyramid fusion; (d) discrete wavelet fusion; (e) BEMD–entropy-weighted fusion algorithm; and (f) BEEMD–entropy-weighted fusion algorithm.
Evaluation of the fusion effect based on the Laplacian pyramid algorithm
Selecting the Laplacian pyramid decomposition layer number from 2 to 5, the evaluation of the image fusion quality under different decomposition layer numbers is calculated. The calculation results are shown in Table 10.
Visible light and infrared fusion quality based on the Laplacian pyramid and discrete wavelet fusion algorithms.

Bold values indicate the optimal value for each column or different methods.
It can be seen from Table 10 that when the number of layers is 5, the two indexes are the maximum and the ideal fusion result of this method can thus be selected as the number of layers 5.
Fusion effect evaluation based on the discrete wavelet fusion algorithm
The selected number of decomposition layers for discrete wavelet transform in this algorithm ranges from 2 to 5, and the image fusion quality under each decomposition layer number is evaluated. The calculation results are shown in Table 10. From Table 10, it can be seen that, as the number of decomposition layers increases, the index changes gradually, and the ideal fusion result of this method is selected when the number of layers is 5.
Evaluation of the fusion effect based on the BEMD–entropy-weighted fusion algorithm
The selected IMF number for the BEMD method ranges from 2 to 5, and the fused image quality at different IMF numbers is evaluated. The calculation results are shown in Table 11.
Visible light and infrared fusion quality based on the BEMD–entropy-weighted fusion algorithm.

BEMD: bidimensional empirical mode decomposition; IMF: intrinsic mode function.
Bold values indicate the optimal value for each column or different methods.
From Table 11, the fusion effect is better when the number of IMFs is 4 and the three parameters are close to the maximum values.
Evaluation of the fusion effect based on the BEEMD and entropy-weighted fusion algorithm
In this algorithm, the IMF number for BEEMD is set to 4 and the image number in the image set is set to be 5, 10, 20, and 50, respectively, and the fusion quality of fusion images under different numbers of image sets is evaluated. The calculation results are shown in Table 12.
Visible light and infrared fusion quality of the algorithm proposed in this article.

Bold values indicate the optimal value for each column or different methods.
From the three indices, with the increase of the image number, the initial fusion effect is improved and the later fusion effect is slowed down by the image number. When the image number of image sets is 10, the standard deviation and entropy index are the maximum values.
Comparison of the fusion effects
The optimal results of the above algorithms are summarized in Table 13, and the fusion effect of each algorithm is shown in Figure 8(c)–(f).
Optimal visible light and infrared fusion image fusion quality for each algorithm.

BEMD: bidimensional empirical mode decomposition; BEEMD: bidimensional ensemble empirical mode decomposition.
Bold values indicate the optimal value for each column or different methods.
From the comparison of the above optimal fusion results, it can be seen that the proposed method has advantages regarding standard deviation and entropy. In terms of the standard deviation and entropy indicators, the proposed method works best, specifically 4.7% higher than the second best standard deviation result. In terms of entropy index, the index value of the proposed algorithm is the second best which is only slightly lower than that in the BEMD algorithm. Thus, the integrated fusion effect of the proposed BEEMD algorithm can be considered as the best one. In addition, the BEEMD method also improves the horizontal stripes in the BEMD fusion image due to the mode mixing problem. It can be easily understood that horizontal stripes can be further suppressed by increasing the image number.
From the above three fusion analysis cases, the proposed method can achieve the best among the two indices in every case, and the remaining index is basically the second best value, which is very close to the optimal value. It has obvious advantages in image grayscale distribution and information richness.
Conclusion
This article extends the EEMD method in 2D images. Compared with the BEMD method, it has a certain degree of improvement in image decomposition. Then, a new adaptive pixel-level image fusion algorithm based on information entropy and BEEMD decomposition is proposed. Three types of image fusion study cases are performed. From the fusion results, BEEMD decomposition has advantages in terms of standard deviation and entropy and has the best ability to capture features of the background and objects. In addition, the BEEMD method also improves the horizontal stripes in the BEMD fusion image due to mode mixing problem.
It should be noted that BEEMD increases the image noise set compared with BEMD, and it is necessary to perform decomposition calculation on the noise image set. Compared with the other three algorithms, the calculation time is also increased. In addition, the parameters of the BEEMD algorithm are composed of IMF component number and the number of images in the noise image set. The composition is more complicated than the other three algorithms in finding the optimal fusion effect parameters. As a future work, it is interesting to further improve the efficiency of the proposed method.
Footnotes
Handling Editor: Daming Zhou
Declaration of conflicting interests
The author(s) declared no potential conflicts of interest with respect to the research, authorship, and/or publication of this article.
Funding
The author(s) disclosed receipt of the following financial support for the research, authorship, and/or publication of this article: This work was supported by the Joint Fund for Advanced Equipment Research and Aerospace Science and Technology of China (Grant No. 6141B06220220301).