
Abstract
In this article, we propose a more accurate method to achieve noninvasive and continuous blood pressure monitoring with the aid of pulse arrival time and peak delay. Theoretical analysis shows that peak delay is positively correlated with the viscoelastic delay. Analysis of 12 subjects indicates that pulse arrival time with the compensation of peak delay (PATC) is much steadier and more robust than traditional pulse arrival time. Three common models (linear, inverse linear, and inverse quadratic) are employed to study the relationship between pulse arrival time/PATC and blood pressure. From pulse arrival time to PATC, the average promotions of correlation coefficient for systolic blood pressure are 0.065, 0.060, and 0.058 for the three models, respectively, accounting for 8.59%, 7.68%, and 7.43% improvement; for diastolic blood pressure are 0.070, 0.067, and 0.064, respectively, accounting for 12.73%, 12.05%, and 11.48% improvement. Finally, we find that peak delay is efficacious against the negative effects of the terminal reflection and the viscoelastic delay on the peripheral pulse wave. Our method is promising in developing novel applications on portable and wearable device for real-time blood pressure monitoring.
Keywords
Introduction
Recently, noninvasive and continuous blood pressure (NCBP) monitoring has attracted more and more attention.1–3 The beat-to-beat blood pressure (BP) and BP variation reveal a great deal of information about the dynamic features of cardiovascular control mechanisms, which is significant for both disease prevention and clinical diagnosis.4–7 Pulse transit time (PTT), defined as the time delay between the proximal pulse wave and the distal pulse wave,8–10 is a promising means to monitor NCBP. Owing to the complexity of the measurement, electrocardiograph (ECG) is usually served as a surrogate of proximal pulse wave.11–19 And photoplethysmograph (PPG) is the most common distal pulse wave.11–15,20,21 Different from PTT, the nomenclature of pulse arrival time (PAT) is used for the time delay between the R peak of ECG and the feature point of PPG. 11 PAT is widely adopted in the study of NCBP monitoring due to the ease of measurement and the robustness to artifact.
In this article, we propose a more accurate method to achieve NCBP monitoring with peak delay (PD) of two different distal pulse waves at peripheral position. We summarize our contribution as follows:
For the first time, we propose the relation between PD and the viscosity with the analytical solution of Womersley Theory.
We redefined the relation between PTT and PWV with the presence of PD, which notably increases their correlation.
The rest of this article is organized as follows. In section “Related works,” we present the state of the art of relevant topics. In section “Analysis of PD and its relationship with elastic modulus,” the influence of PD is demonstrated with theoretical analysis, giving an approximate relation between PD and the viscoelasticity of arterial wall. We further performed some experiments to testify the validity of the theory and compare the correlation between PAT and BP with and without the compensation of PD in section “Experiment and discussion.” By introducing PD, we obtain a more reliable method to monitor NCBP and conclude the work in section “Conclusion.”
Related works
In the common PAT-based method, three unfavorable factors lead to a decline in the correlation between PAT and BP. First, PAT contains the pre-ejection period (PEP), which is determined by the ventricular electromechanical delay (VEMD) and isovolumic contraction period.22–24 Second, the effect of smooth muscle (SM) contraction cannot be ignored in peripheral arteries.25,26 Finally, since the PPG signal is obtained near the terminal of the artery, the reflection is noticeable and the measured wave is the superposition of the forward wave and the reflected wave.27–29
Researchers focus more on the first factor to mitigate the influence of PEP, but less on the other two factors. The presentation of SM state has two major effects on BP estimation. On one hand, it varies the elasticity of artery with the regulation of its contraction and relaxation; on the other hand, the propagation model of pulse wave changes from elastic to viscoelastic.30,31
Elasticity of the artery plays a crucial role in the determination of PTT (or PAT).18,32 The artery is composed of endothelium, elastin, collagen, and SM. 30 Endothelium is a single cell layer that contributes little to elasticity. Elastin is extensible, elastic, and predominant at low BP. Compared with elastin, collagen is much stiffer and predominant at high BP. SM is influenced by physiologic control and shows viscoelastic characteristics. Elastin is more abundant in the central arteries, whereas SM is most prevalent in the peripheral. 1
Pulse wave velocity (PWV) is inversely proportional to PTT at the central arteries. There are many models that describe the relationship between elasticity and PWV, for example, the Bramwell–Hill equation, the Moens–Korteweg equation, and some improved ones.1,2,18,27,32,33 We take the well-known Moens-Korteweg for instance as shown in equation (1)

where
Note that equation (1) is based on the assumption that the arterial wall is purely elastic and the elasticity E is a constant. However, for central arteries, E is not constant but rather increases with pressure P and is related to P in equation (2) 32

where
Furthermore, for peripheral artery, E is also prone to SM contraction. 34 Apart from elasticity, viscosity becomes noticeable at peripherals and will affect the shape of the signal. 35 One effect of viscosity is the delay between stress and strain; therefore, the elastic modulus E is no longer a real number. To describe the viscous effect, complex E is invoked as equation (3)

where
In the relaxed and contracted states of the SM, behaviors of the central artery are quite similar as shown in Figure 1(a). 25 In contrast, a peripheral artery shows a huge gap between the two states in Figure 1(b). Therefore, equations (1) and (2) are not tenable for the peripheral. When acquiring PAT with ECG and finger PPG, part of the pulse wave propagates along the peripheral, which leads to the decline in the correlation between PAT and BP.

Pressure–diameter relationship of (a) central artery and (b) peripheral artery during SM changes. 25
Some research invoke covariates (e.g. heart rate (HR), short-term variability of PTT) and use a population average value in the calibration to reduce the impact of SM contraction.13,16,17 Nevertheless, the correlation between SM contraction and these parameters has not been well reported. To bridge this gap, we should take SM states into consideration. SM contraction has two major influences: the change of elasticity and the noteworthy viscosity. One of the effects of viscosity is the delay between stress and strain, yet hardly can it be obtained because most of the arteries are buried deep in the body and it is hard to reach them noninvasively. Instead, we find that the phase delay of two different pulse waves at the same position has a high correlation with viscosity, which can be regarded as the indicator of the SM state. For the convenience of measurement, the PD is served as the replacement of pulse wave delay in practice. In the following section, the expressions of the two adopted pulse waves are deduced based on Womersley theory to show the relationship between PD and
Analysis of PD and its relationship with elastic modulus
Womersley theory and the analytical solution
Womersley36–38 theory describes a simplified model for the study of hemodynamics. The blood is considered to flow under the drive of pressure gradient as shown in equation (4)
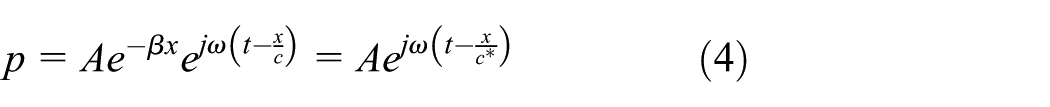
where x and t are the axial dimension and time; c and
The expressions for the motion of arterial wall in radial direction

where
In addition

where

Relationship between PD and ΔE
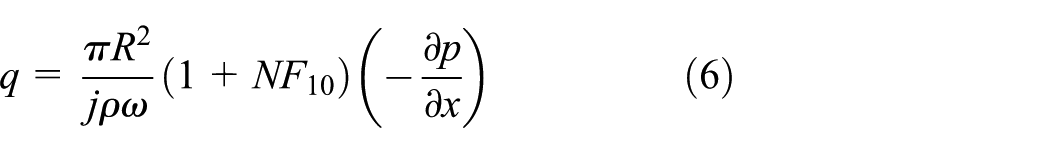
The commonly used pulse waves are pressure pulse wave (PPW) inside the artery, radial displacement pulse wave (RDPW) on the skin surface, and flow quantity pulse wave (QPW). The measurement of PPW is complicated with cannulation, whereas RDPW and QPW can be easily acquired with piezoelectric thin films (polyvinylidene fluoride, PVDF) and PPG.
In Womersley theory, PPW, RDPW, and QPW are corresponding to p,
At the same peripheral position, the PD between pressure and pressure gradient does not vary with time. Therefore, as shown in equations (5) and (6), the change in PD between

Section “Womersley theory and the analytical solution” provides a solution to the fluid–structure interaction problem in the Womersley theory, ignoring the viscosity. Viscosity is hard to describe and will increase the complexity of solving the problem. However, in order to take the time delay phenomenon into account, elastic modulus can be redefined as the complex form in equation (3).

Since

Then,

Obviously, the change of


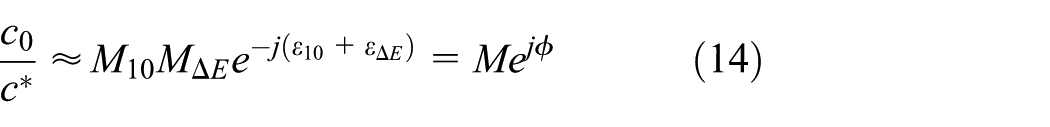
where
If PD is represented as

We have

Equation (16) denotes the relationship between
We know from equation (16) that if the cardiac cycle
Experiment and discussion
Two experiments are conducted in this section. The first one is to verify the feasibility of PD and the correctness of theory in section “Relationship between PD and ΔE.” The second is to testify the improvement of the correlation between PAT and BP with the compensation of PD.
Experiment setup
In total, 12 subjects (aged from 19 to 25, 6 males and 6 females) are involved in the experiments. The experiment collects three channels of signal as shown in Table 1 and Figure 2. The subjects should sit still during the measurement. All the experiments get the BP perturbation by taking some exercise with an indoor running machine. The fluctuation of systolic blood pressure (SBP) and diastolic blood pressure (DBP) should reach 40 and 20 mmHg, respectively.
Signals collected in the experiment.

ECG: electrocardiograph; RPW: radial pulse wave; VPW: volumetric pulse wave; PPG: photoplethysmograph.

The acquisition of three signals.
The signals are amplified and filtered before recorded by an analog-digital convertor with sample rate of 500 Hz. The MATLAB program is used to detect the peak and suppress noise in the signal processing progress. The definitions of PAT and PD are displayed in Figure 3.

Collected signals and the illustration of PAT and PD.
Experiment 1: relationship between PAT and PD at relax state and recovery state
We define two measurement states in the experiments: relax state and recovery state. In the relax state, the subject has just relaxed for 10–20 min. Therefore, the HR and BP almost remain stable. In the recovery state, the subject has just finished taking exercise. Therefore, HR and BP changes dramatically and will gradually return to the normal values. During the continuous measurement, we record 20-s data each time and take a 1-min break before the next measurement. And for each group, the subject measures 10 times in relax state and 20 times in recovery state. The subjects are suggested to perform more than three groups to verify the agreement of results.
Discussion of the first experiment
During a short period of time, PD is negatively correlated with PAT
As displayed in Figure 4(a) and (b) (20 s data), the short-time correlation between PD and PAT is high. Table 2 shows the correlation coefficient (r) of four subjects before and after exercise. For all the 12 subjects, the average correlation coefficient is −0.7323 before exercise in Figure 4(a) and rises a bit to −0.7519 after exercise in Figure 4(b), but the difference is subtle.

One group of data: PAT and PD at (a) rest and (b) recovery states. Both BP are around 120/75 mmHg. Each point represents a cardiac cycle (PATC: PAT with PD compensation).
Correlation coefficient between PAT and PD before and after exercise within 20 s.

STD: standard deviation; PAT: pulse arrival time; PD: peak delay; PATC: pulse arrival time with the compensation of peak delay.
During a long period of time, the correlation between PD and PAT decreases greatly
As shown in Figure 5, depicting seven successive measurements, the long-time correlation between PD and PAT is low. In relax state, the correlation coefficient decreases to −0.6329 in Figure 5(a) and the plot of PAT versus PD is much scattered. At recovery state, the correlation coefficient even reverses to positive 0.1597 in Figure 5(b). In relax state, all the points cluster together and the dashed line shows the linear trend between PAT and PD; whereas at recovery state, the points disperse into several clusters.

Long-time (seven successive groups of data) relationship between PAT and PD of subject no. 1 (r: correlation coefficient): (a) rest state (r: −0.6329; SBP: 110–117 mmHg; DBP: 64–70 mmHg) and (b) recovery state (r: 0.1597; SBP: 100–140 mmHg; DBP: 55–81 mmHg).
Relationship between PAT and PD
The results in Figure 4 show that in both relax and recovery states, the linear correlation between PAT and PD is quite high during short period of time. This phenomenon can be well explained with equations (1), (11), and (16) after several deductions.
If

Substituting equation (16) into equation (17), we get

where

and

The value of
The parameter k relies on T and
Equation (18) depicts a more complicated but accurate relationship between PTT and
where
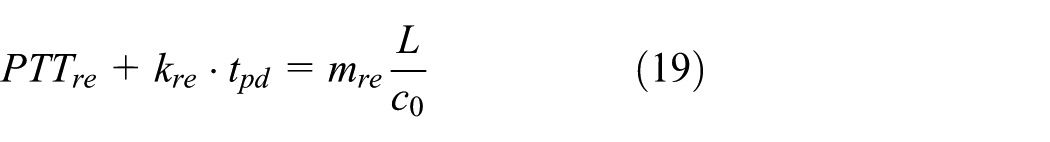
The fluctuation of PAT and the aid of PD
In Figure 4, the curve of PAT fluctuates severely, especially at the recovery state, as shown in equation (19); this is because we do not invoke PD. By ignoring PD in Figure 5(b), if we focus on the Y-axis, PAT varies drastically and the data clusters overlap with neighbors. Although the average trend is clear, the variation adds to the errors when we solve for BP. Compared with equation (1), equation (19) adds a term

to distinguish from PAT.
In Figure 4, pulse arrival time with the compensation of peak delay (PATC) becomes far steadier than traditional PAT during short-time measurement. In Figure 5, PATC can be viewed as the Y-intercept of the linear regression result for each cluster of data. Obviously, the Y-intercept is better oriented compared with Y-data. In Table 2, the standard deviation (STD) of PATC is quite smaller than that of PAT, only accounting for 65.40% in relax state and 59.45% in recovery state, which implies PATC is much more robust with lower short-time variability.
In Figure 5(a), in relax state, the linear relationship between PAT and PD is relatively steady; in Figure 5(b), in recovery state, the relationship between PAT and PD varies over time. This is because after exercise, the SM contraction is regulated by physical process to enhance local blood circulation.
30
These results are in agreement with equation (19); since the long-time measurement leads to the change of
In relax state, BP and HR almost remain stable (more exactly, follow respiratory rhythm). Meanwhile, PATC also stays constant, resulting in PAT being inversely proportional to PD. In recovery state, PATC changes greatly, therefore the linear relationship between PAT and PD no longer exists. However, during a short time of recovery state, PATC can be viewed as unchanged, and the inverse proportion still holds.
Physiologically, if PEP is ignored temporarily, PAT is likely to fluctuate with both BP variation and SM contraction. PD plays a role in compensating the interference of SM contraction, providing better accuracy in BP estimation. The experimental results and the discussion above have verified the correctness of equation (19) and have shown the steadiness of PATC. In the next experiment, the traditional PAT is replaced with PATC to estimate BP.
Experiment 2: comparison between PAT and PATC for BP estimation
In the second experiment, SBP and DBP are measured with cuff-based automatic electronic sphygmomanometer (HEM-1020, Omron) every 90 s when we collect three channels of continuous signals. Corresponding to each BP value, the nearby 20-s data is employed to calculate PAT and PD. There are 15–40 cardiac cycles in the 20-s data. After extracting characteristic points for each cycle, the average of all the values is recorded for BP estimation.
The determination of the parameter k is essential in PATC. For the 20-s data, PAT is linearly fit with PD as

Then, the parameter b is recorded as PATC for BP estimation.
Currently, there are a variety of models to describe the relationship between PAT and BP. We adopt three common models to testify the effect of the compensation of PD.
Linear model 39

Inverse linear model 40
Inverse quadratic model 41

For linear model, PAT/PATC is negatively correlated with SBP/DBP, whereas for inverse linear and inverse quadratic model, the correlation is positive. To weigh the gain fairly, the increment of correlation coefficient and its percentage for each pair is calculated, as shown in Table 3. For most of the subjects, PATC is better than PAT for all the models and for both SBP and DBP. The absolute change of correlation coefficient ranges from −0.0275 to 0.360, and the relative change ranges from −3.49% to 133.54%, showing a bit of individual differences. For SBP under different models, the average promotions of correlation coefficient are 0.0648 (8.59%), 0.0592 (7.68%), and 0.0577 (7.43%), respectively; and for DBP 0.0695 (12.73%), 0.0667 (12.05%), and 0.0636 (11.48%), respectively. The results convince us that PATC performs better than PAT in the estimation of BP. The enhancement of PATC is mainly due to the fact that PATC contains the information of SM contraction.
The correlation coefficient and its increment between PAT/PATC and SBP/DBP for different models.

PAT: pulse arrival time; SBP: systolic blood pressure; DBP: diastolic blood pressure.
SBP_inc: the increment of correlation coefficient from PAT to PATC. The same goes for DBP_inc.
Bold values represents the adverse data.
Discussion of the second experiment
The effectiveness of PD varies considerably for different individuals. For Subject No. 1, the effect is positive and obvious for both SBP and DBP, whereas for Subject No. 2, PATC only works well on DBP and has little influence on SBP. But for Subject No. 3, the effect is remarkable and PD compensation is indispensable. The difference may lie in the individual physiological conditions. As discussed, the state of SM is influenced by nervous-humoral regulation. For different subjects, the body conditions vary considerably, leading to the difference in effect of PD compensation. For an athlete, the regulation is much active and the recovery period is far shorter than an ordinary person.
Seven out of 72 pairs in Table 3 show adverse results with the compensation of PD, for example, Subject No. 4 and Subject No. 12. We extract them in Table 4. These may be due to two reasons we ignored in the experiment. First, the RDPW signal sensed by piezoelectric thin film reflects the displacement of the surface skin, not the real pulse wave inside the artery. The skin serves as a buffer between the artery and the sensor. The same goes for PPG signal. And the signals are affected by applied contact force as well. 42 Second, the piezoelectric and photoelectric sensor is not placed at the same place in practice as shown in Figure 2. The distance between them is about 1 cm. However, in Table 4, the average of decrement (–0.0089 and −1.09%) is quite small compared to the increment. In addition, for these cases, the initial correlation between PAT and BP is high enough (average correlation coefficient is 0.815353) which means the influence of SM contraction and terminal reflection is negligible and it does not need the favor of PD. Furthermore, the improvement of DBP is a bit better than that of SBP. Actually, the absolute gain does not differ a lot. But the initial correlation coefficient between PAT and DBP is lower, contributing to the higher gain in the relative value. Still, PATC has a higher correlation with SBP. Besides, there is no obvious distinction among the three models in our experiments. In this article, model, gender, age, and disease are not the targets we focus on although these may play essential roles in NCBP monitoring. In practice, the most imperative demand is to monitor BP of the seniors with cardiovascular disease. Future research should verify whether PATC is compatible for these people.
Summary of the adverse data in Table 3.

PAT: pulse arrival time; SBP: systolic blood pressure; DBP: diastolic blood pressure.
r_dec: the decrement of correlation coefficient from PAT to PATC, both absolute and relative values are calculated.
Conclusion
In summary, combining PAT and PD as PATC has the potential to provide better accuracy and robustness for the estimation of BP. As depicted in Figure 6, PD helps to mitigate the effect of SM contraction and the viscoelastic delay in the peripheral arteries. The first experiment studied the relationship between PAT and PD of short-term and long-term measurement, verifying the steadiness and robustness of PATC. The second experiment studied the correlation between PAT/PATC and SBP/DBP, convincing that PATC performed better than PAT in NCBP monitoring. In addition, the cost of PD acquisition is tiny, since all it acquires is a piezoelectric thin film sensor placed next to PPG sensor. Therefore, PATC is far more promising in the automated and cuff-less NCBP monitoring.
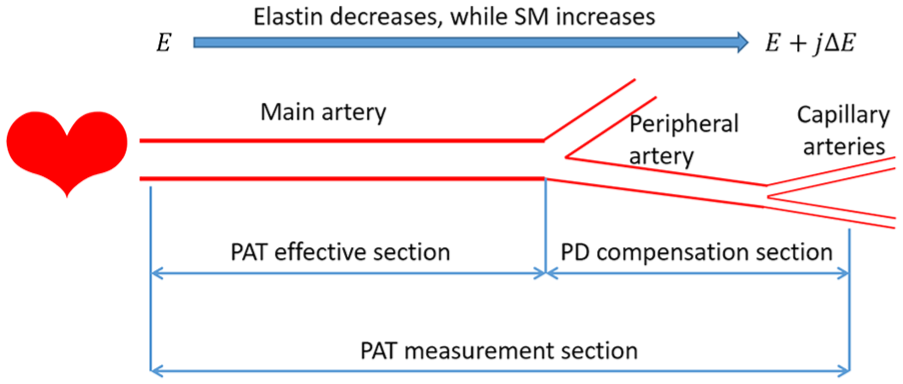
The schematic diagram of the principle of PD compensation.
In addition,43–49 the utilization of PD could provide much more perspective for further study. First, RDPW and PPG signals are both collected at the periphery; hence, PD there has the potential to offset terminal reflection. The peripheral arteries (at fingertips) are full of branches, which taper and terminate with microcirculation. Great effort is required to study and model the impact of reflections at these positions. Another perspective is to estimate BP with PD independently. The calculation of PTT/PAT needs to acquire signals at two distant positions, which is unexpected for wearable and portable device. A more desirable way is to pick two peripheral pulse waves at closed sites to calculate the PTT. However, the terminal reflection and the viscoelastic delay of peripheral pulse wave tremendously damage the precision of PTT. It will be of great value to study whether or not PD can be used to cancel both the terminal reflection and the viscoelastic delay. If it did, the compact devices to monitor NCBP are not in the distant future.
Footnotes
Acknowledgements
During revision of the paper, Bin Shao, an experienced clinical doctor, gave us some advice from physiological perspective to better explain the experimental results with the physiological activities. Xiao Yang, specialized in Computer Science, offered help to improve the data processing.
Handling Editor: Arun Sangaiah
Declaration of conflicting interests
The author(s) declared no potential conflicts of interest with respect to the research, authorship, and/or publication of this article.
Funding
The author(s) received no financial support for the research, authorship, and/or publication of this article.