
Abstract
With resource constraint’s distributed architecture and dynamic topology, network issues such as congestion, latency, power awareness, mobility, and other quality of service issues need to be addressed by optimizing the routing protocols. As a result, a number of routing protocols have been proposed. Routing protocols have trade-offs in performance parameters and their performance varies with the underlying mobility model. For designing an improved vehicular ad hoc network, three components of the network are to be focused: routing protocols, mobility models, and performance metrics. This article describes the relationship of these components, trade-offs in performance, and proposes a supervisory protocol, which monitors the scenario and detects the realistic mobility model through analysis of the microscopic features of the mobility model. An analytical model is used to determine the best protocol for a particular mobility model. The supervisory protocol then selects the best routing protocol for the mobility model of the current operational environment. For this, EstiNet 8.1 Simulator is used to validate the proposed scheme and compare its performance with existing schemes. Simulation results of the proposed scheme show the consistency in the performance of network throughout its operation.
Introduction
Vehicular ad hoc network (VANET) is characterized by high mobility, high network traffic, and real-time applications. It has an important role in integrated transportation system (ITS). ITS provides navigation, road safety, traffic control, and electronic tolling services. 1 These applications are mostly real time and none delay tolerant. Although there are no battery power constraints in VANET due to on-board units (OBUs) installed on vehicles, latency is an issue for its real-time applications.
Being a subclass of mobile ad hoc network (MANET), VANET also does not depend over fixed infrastructure, but here the node’s mobility is very high. The high speed and changing topology make it challenging for the network to successfully deliver packets to the destination.2–4 However, there are certain characteristics, such as computational power, no battery power constraints, network size, predictive mobility, and frequent disconnection in topology, which make VANET routing requirements different from MANET routing. 5
A number of protocols have been proposed for VANETs. Most of these protocols are based either on simulation or theory.6,7 Literature categorizes routing protocols as proactive, reactive, or hybrid. 8 Another classification is topology-based or position-based for efficient routing with low latency and no congestion. Predictive mobility protocols are designed to efficiently manage the topological change and improve service quality. Cluster-based routing protocols are being developed for central control. Why are these protocols needed? The answer is, in ad hoc network routing is responsible for initiating routes and route maintenance with functions to support mobility, bandwidth restrictions, and power limitations. 9 Second, these protocols are designed for different scenarios, but VANET has a dynamic topology and the network can meet any type of scenario at runtime. Dynamic topology contradicts the consistent performance of routing protocol in ad hoc networks. 10
The research articles9,10 on the performance of routing protocols show that one routing protocol outperforms the others in a given mobility model and for a given performance metric. Similarly, another specific routing protocol may outperform others for a different performance metric in a different mobility model. The mobility model plays an important role in the performance study of VANETs. 11 It is concluded that the operational mobility model and the desired performance metrics must be properly analyzed for the selection of a suitable routing protocol.
The rapidly changing topology has therefore drawn researcher’s focus to the design of efficient routing protocols. The role of routing protocols in the stated scenario is very crucial in support of the ITS. 12 In the modern era, the communication is done through real-time multimedia applications. It is required to establish a stable link between the nodes to ensure efficient and real-time communication, and this can be achieved with efficient routing. Efficient routing can control congestion in the network, and congestion-free network can ensure quality of service for real-time applications. The routing protocols must have the ability to cope the challenge of dynamic topology along with other routing challenges such as quality of service insurance in a rapidly changing scenario. Furthermore, it must have flexibility to adjust with the changing requirements. Scope and requirement of different routing protocols vary significantly. 13 It is very significant to select the appropriate routing protocol automatically for different kinds of operational environment.
This article presents a supervisory protocol, which monitors the scenario and detects the realistic mobility model through analysis of the microscopic features of the mobility model. An analytical model is used to determine the best protocol for a particular mobility model. The supervisory protocol then selects the best routing protocol for the mobility model of the current operational environment.
This article is organized as follows. The details of the existing works are presented in the “Related work” section. The working of the proposed protocol is presented in the “Supervisory Protocol for Automatic Routing protocol Selection” section, while the “Simulation results and analysis” section presents the results, discussion, and analysis. Finally, the article is concluded in the “Conclusion” section.
Related work
Sections “Mobility models,”“Performance metrics,” and “Trade-offs in VANET routing” of this section describe mobility models and performance metrics for the better understanding of the existing work done. Furthermore, “Contemporary work” section portrays the contemporary work done in the pertinent area.
Mobility models
The most important characteristic of the mobile node is its movement; it affects the performance of ad hoc network protocols. 14 In designing ad hoc networks, mobility models and performance metrics are to be treated in detail. 15 Accurate representation of mobile nodes is key to determine whether a protocol is useful or not in a particular scenario. Mobility models are divided into seven different groups based on their basic mobility characteristics, namely, individual mobility, group mobility, autoregressive mobility, flocking mobility, virtual game-driven mobility, non-recurrent mobility, and time-variant community mobility.
Further variations and mobility patterns in these mobility groups influence performance characteristics. Mobility models use two different approaches, traces and syntactic. Traces of mobility is a more realistic modeling approach. However, there are no traces for people who walk or drive in cities. There are traces for buses of the public local transport, 16 which, however, do not necessarily coincide with the mobility of walkers or vehicles. Traces produce patterns that are observed in real-life systems. Here, everything is deterministic. It needs a high number of participants and a lengthy period of observation. No real-vehicle traces are available. A traffic simulation tool can be used to produce vehicle traces. The behavior of the individual/driver, however, is influenced by the environment, changing road conditions, traffic jams, timetables, individual’s own behavior, weather, and other environmental factors. 7 The traces are therefore generated by the traffic simulator. The Multiagent Microscopic Traffic Simulator (MMTS) took hours of cluster simulation to generate traces. 17 Uses a progressively more advanced model that takes into account the decisions of drivers in the mobility model. A syntactic model represents the movements of mobile nodes realistically. Syntactic mobility is based on randomness, constrained, and statistical models. In constrained topology-based mobility models, mobile nodes have partial randomness, and movement of nodes is restricted by obstacles, pathways, speed limits, and others. A model that is based on total randomness is defined as statistical mobility models. Syntactic mobility is classified into individual mobility and group mobility.
Mobility model’s formulation is based on the stochastic process. Movement of nodes consists of sequences of random length intervals called an epoch. During one epoch, node moves in a constant direction with a constant speed, where the direction and speed vary for different mobility models.
Performance metrics
Performance metrics capture characteristics of different mobility models and analyze the performance of communication protocols. 15 Mobility performance metrics are grouped into seven major categories: direct mobility metrics, mobility measure metrics, link- and path-based metrics, network connectivity metrics, quality of service metrics, energy performance metrics, and mobility prediction metrics. The categorization is based on the parameter they considered in each group. Quality of service metrics has parameters related to the service quality of the network.
Trade-offs in VANET routing
In an ad hoc network routing, the focus on a single performance metrics cannot ensure the overall quality of service improvement. The optimization of a parameter in a routing protocol leads to the deterioration of another important parameter. This problem mostly occurs among quality of service parameters. The two main categories of routing protocols are the table driven, also called proactive (such as Destination-Sequenced Distance-Vector Routing (DSDV), Cluster Switch Gateway Routing (CSGR), Global State Routing (GSR), Fisheye State Routing Protocol (FSR), Hierarchical state routing (HSR), and Wireless Routing Protocol (WRP)), and source initiating on demand routing, also called reactive routing (such as Speed based On Demand Vector routing (SODV), Dynamic Source Routing (DSR), Temporally Ordered Routing Algorithm (TORA), Associativity-based routing (ABR), and Scalable Source Routing (SSR)). 9 Proactive protocols reduce latency by finding an updated efficient route to the destination on the cost of the continuous bandwidth utilization for updating the routing tables. Reactive routing protocols save the bandwidth by reducing traffic signaling on the cost of delay in finding an updated route to the destination which causes latency. Second, at the interchange, the vehicle changes direction, and the movement pattern is not deterministic. In such a scenario, the protocols developed for a junction-based scenario such as “Efficient VANET routing based on junctions” 18 will only work excellently at junctions, the highway-based protocols such as “Evolving graph-reliable ad hoc on-demand distance vector (EG-RAODV)” 19 will work well on highways, and protocols that consider the restricted scenario such as “Reliable inter-vehicular routing (RIVER)” 20 will work better in sector roads.
Over the past 10 years, there have been many proposed routing protocols for VANETs considering their particular attributes. The vehicle position–based protocols, known as geographic routing (GR) protocols or position-based routing (PBR) protocols, proved to be the most suitable for VANETs because of their robustness to dynamic change of environment and vehicles’ high mobility. In place of the use of IP addresses, as in MANET protocols, PBR protocols rely on the geographic position of the vehicles to select the optimal route for forwarding the data. In addition, they neither exchange link status messages nor maintain established routes like those in MANET routing protocols. Thus, the protocols are more robust against frequent topology transitions and high vehicle mobility. Geographical-based routing is an improved solution, but individual/driver behavior is, however, influenced by the environment, changing road conditions, congestion, driving plans, individual own behavior, weather, and other environmental factors. 7 A dynamic protocol is required in order to address trade-off problems arising from frequently changing environment.
Contemporary work
Nearly all previous approaches in literature are based on analysis and comparison with each other, But in Jun and Julien, 21 a tool-based approach has been used to analyze different parameters of the target environment and application requirements. The tool automates the process using analytical procedures for routing protocol in selecting the finest choice for a literal topology. The tool also influences the application requirement process for the protocol selection process.
In Jun and Julien, 21 the authors suggest to create a tool for ad hoc network based on the characteristics of the environment and application requirements that will choose a specific protocol for the deployed network. The network deployment considers some physical features such as mobility, degree, density, and error rate, and is based on how the network deploys an application. The rate of traffic generated, the number of communication endpoints, application goals, and requirements for application are some of the dominant characteristics related to an application. First, the software designer sets the defining parameters for a specific environment and application requirements, then the tool analyzes these parameters and decides on a protocol to choose from, based on various conditions.
Based on real-world experiments and simulation results, new models are constructed. The same tools provide an option for updating existing models or feed new protocol. It provides an environment where designer input is analyzed for best protocol based on given parameters. The environmental information and application requirements are two inputs for the protocol selection process. It helps in the selection of protocol that is best suited for given conditions.
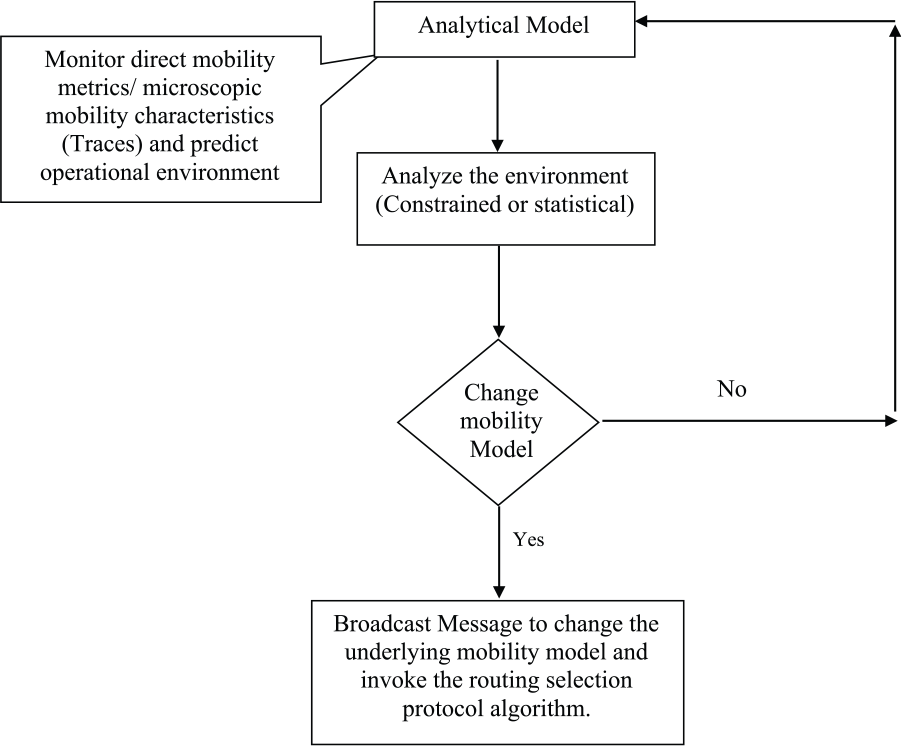
In Jun and Julien, 21 an algorithm has been described that evaluates the operational environment and application requirements against the protocol behavior model. After the behavior extraction process, the protocol behavior model is built based on simulated values or real-world calculations. To reduce the time of acquisition for information gathering from the model, the model works as input for the process. Then, the process uses the protocol behavior to approve it as an appropriate routing scheme. The algorithm decides an appropriate routing protocol for a particular situation. The main outcome of this work is to finalize such a model, which has the facility to adjust the routing protocol for on-the-fly changes in application as well as in network conditions. The algorithm that judges the performance of the routing protocol is given in Figure 1.

Flowchart for automatic selection of routing protocol. 21
Agarwal 13 suggests a novel routing technique for delay tolerant VANETs. An analytical model was developed to analyze the performance of messages. The advantages of the proposed scheme are discussed in terms of an analytical model that concludes the parameters for routing protocol.
There are two types of data in typical VANETs: delay sensitive and delay tolerant. The delay sensitive data need to be transmitted and propagated within some time limits. An example of such data is the safety-related message and road accidents. While in delay tolerant data, there is room for delay. Examples are data about engine statistics, speed limit warnings, and banner advertisement. VANET is in fact a multi-hop network and constructed on both sides of the road with a high correlation between both types of data. Now for real- and on-time propagation of safety-related data, a scheme is always needed to distribute the traffic and data. Previous schemes are based on location information for route discovery and transmission. While here they gave a new idea based on time to live (TTL) parameter, TTL is a function of time and space known as Space-Time-TTL (STTL).
In the context of time and/or space, changes in the network topology can be exploited with the parameters that enable propagation of data. Accordingly, the nodes in the network will make independent decisions for routing, which are not only based on the information embedded in the message which is labeled with location information and STTL but also based on its own attributes. So the messages are forwarded without route information, which creates a connectionless messaging paradigm.
In Silva’s study, 6 it is concluded that to validate the proposal for VANETs, simulation is the essential tool for the evaluation of scenarios as test beds for large-scale VANETs are not available. The reliability of simulation results depends on the mobility model adopted. A realistic mobility model ensures the accurate results. The non-realistic mobility model may lead to overestimated performance of VANET algorithms in protocols.
Mobility models can be divided into microscopic and macroscopic characteristics. A microscopic characteristic consists of acceleration, speed, and position. The macroscopic characteristics deal with trip origin and destination. Realistic results need both macroscopic and microscopic characteristics to be defined accurately.
This research work aims to improve evaluation scenarios by proposing realistic macroscopic characteristics of mobility models. The origin-destination behavior is focused by this model to make it more realistic. This model is validated by comparing its results with other mobility traces. This research work gives clear directions for future improvements in mobility models to make them more realistic.
Lots of protocols have been showcased in the literature for VANETs so far; most of these protocols are based on either simulation or theory as the test beds are not financially feasible. 7 In the simulation, the performance results obtained depend on the underlying mobility models used. An unrealistic mobility model may compromise the performance results of the protocols analyzed. This research work simulates ad hoc on-demand distance vector (AODV) and Greedy Perimeter Stateless Routing (GPSR) protocols for performance. The mobility models used for this simulation are random way point, the vehicular traffic simulator, and vectorized street maps. The result of the simulation concludes the fact that realistic mobility models show lower performance as compared to simple mobility models. This further concludes that mobility models have impact over the performance of the routing protocols. Mobility models should be chosen carefully to extract accurate results for performance evaluation of routing protocols.
Table 1 shows the fact sheet of recently designed protocols, obtained from literature. It is clear from the table that each protocol is designed for specific scenario and parameters. The realistic scenario may have these entire scenarios in integration.
Fact sheet of the recently designed protocols.

Supervisory Protocol for Automatic Routing protocol Selection
Ad hoc networks require good routing protocols to keep the connection established between the nodes. The mobile nodes change their position very frequently and it is challenging to maintain the quality of service throughout the operation. In the VANET, mobility is very high and the scenario changes frequently. The literature shows that one particular routing protocol cannot give optimal performance in all the scenarios or mobility models; rather another protocol can outperform in the new topology and mobility model. The dynamicity in topology, mobility models, and performance metrics of the network demand for a dynamic routing protocol.
Network model
In disaster recovery, the vehicles operate in urban and rural areas. In urban areas, streets and roads make the mobility of nodes partially random called constrained mobility. As the vehicles enter into rural areas, the mobility is changed to totally random called statistical mobility. Now the mobility model and routing protocol should be according to the operational environment for better performance and quality of service. This process is also supposed to be automatic in all respects. Figure 2 represents the above-described scenario.

VANET operational scenario A.
Figure 2 represents two distinct syntactic mobility models for group mobility having a vehicle-to-vehicle communication. Here, the mobility of the vehicles is supposed to change with a change in the environment, and if the mobility model of the VANET remains the same, the performance might be degraded. Second, if we change the mobility model with a change in the environment and the routing protocol remains the same, then again the quality of service might be compromised.
Figure 3 shows the Google map imaginary of Islamabad sector G-9, Kashmir highway, and a junction between the Kashmir highway and 9th avenue. The Kashmir highway is an eight-lane highway, where the vehicle can move at high-speed and in low-traffic congestion. The street in G-9 sector represents a constrained mobility with low speed, and vehicles have obstacles in between. In the highway junction, the vehicles change their directions, and the movement pattern is not deterministic. In such a scenario, the protocols that have been developed for junction-based scenario such as “Efficient VANET routing based on junctions” 18 will perform outstanding at junctions only, the highway scenario-based protocols such as “Evolving graph-reliable ad hoc on-demand distance vector (EG-RAODV)” 19 performance will be good at highways, and protocols that have considered the constrained scenario such as “Reliable inter-vehicular routing (RIVER)” 20 will perform better in sector streets. The issue is, the vehicle may go through all these scenarios, what kind of protocol has to be deployed in such operational environment.

VANET operational scenario B.
Proposed scheme
Since the introduction of VANETs, a more detailed understanding of traffic behavior has become increasingly important. 31 With low traffic, a long transmission range is required to ensure a high connection probability and a sufficiently long connection duration. But in congested traffic conditions, a lower range might be needed to minimize interference. 32 In the interim phase, the scenario is more convoluted. 33 It is therefore essential for vehicles’ communication to clearly identify different phases of traffic and the points of transit between them. Road traffic models often assume a functional relationship between traffic flow and traffic density. There is an apparent division between free-flowing and overloaded traffic when it comes to traffic density. If the density of the cars is high enough, the system can be overloaded. Kerner 34 examined the empirical traffic data and inferred the theory of three-phase traffic. According to this theory, congested traffic is divided into two phases: “synchronized flow” and “broad congestion.” Wide traffic jams are caused by stationary or slow-moving vehicles in the pinched area, which dilate and move at 15 to 20 km/h in the opposite direction to the vehicles’ direction of travel. In contrast to this, the downstream front of synchronized traffics is usually located near a congested pass and the flow of traffic is higher than in congested traffic—even close to the values observed in free traffic. A sudden drop in speed of a leading vehicle can trigger a transition from a metastable state into the phase of traffic jams. The latest analysis 35 clearly indicates that the transition from free movement to congested traffic is an infrequent one.
This article categorizes the urban and motorway scenarios into three different scenarios based on density, traffic flow and traffic behavior, which are street scenario in which traffic flow is restricted, junction scenario in which the traffic is jammed with high density and highways in which traffic density is uniform and traffic flow is free.
Methodology
The proposed protocol is a reactive supervisor protocol that works on top of the routine routing protocol in V2V and V2I operational environment. With the help of an analytical model discussed earlier, the supervisor protocol analyzes the network performance for different routing protocols in a particular scenario or mobility model. The model uses microscopic mobility characteristics to detect the operational environment and mobility model. The microscopic mobility characteristics consider each vehicle as a distinct element and deal with its specific details such as speed, position, and acceleration. 6 Microscopic characteristics are used to develop traces for modeling the mobility model. Traces provide patterns observed in real-life systems. Here everything is deterministic. It requires a large number of participants and a long observation period. There are no real vehicular traces available. To generate vehicles movement, traffic simulator can be used. Individual/driver behavior is, however, influenced by the environment, changing road conditions, congestion, driving plans, individual own behavior, weather, and other environmental factors. 7 The traces are thus developed through traffic simulator. The MMTS required hours of simulation through clusters to generate traces.
Here, we pursue a trace-based approach in which an available mobility trace is analyzed and important characteristics are derived. The trace-based approach uses existing validated traces to create mobility models for other scenarios. The proposed trace-based model is created taking into account the public accessible mobility trace of the city of Cologne. The used trace represents a set of raw data that describe the position of each vehicle at a certain point in time with a second granularity. Therefore, they needed to be preprocessed to convert the raw data to measures that represent the mobility model. Then a random variable X and its sample data
Step 1: First step is the statistical analysis of data. Following this analysis, a hypothesis on the most suitable probability distribution functions f(X, h) for describing the data can be formulated. The objective is to map the data samples to distributions that are common and are implementable. For hypothesis generation, the statistical summary includes the minimum, median, mean, first quartile (Q1) and third (Q3) quartile, maximum, variation, and skewness.
Step 2: In the second step, the maximum likelihood estimation (MLE) technique 7 is used for the estimation of the h-parameter values of the candidate probability functions f(X, h) hypothesized in the first step. It is a familiar and reliable tool for the estimation of statistical model parameters.
Step 3: To conclude, the ability of all candidate probability functions f(X, h) to represent the sampling data is evaluated. Depending on the results, two approaches are pursued. First is the quantile–quantile plot (Q-Q plot), 7 which plots the quantiles of first data sets versus quantiles of the second one to compare the two distributions. It also draws a 45-degree line; if the quantiles come closer to this line, it is more likely that the two data sets are from the same distribution. In certain situations, it may not be practical to choose the best suited distribution by just look up on the Q-Q plot, as they look very similar. For such situations, the chi-square (χ2) goodness-of-fit test 7 is used, a test to determine whether the sampling data are in line with a theoretical distribution.
The proposed model predicts the environment using the publicly available traces for realistic mobility models. This protocol is equipped with environmental awareness through the traces. The traces indicate a change in the environment, and the proposed algorithm broadcasts a code to the network. The code is associated with a routing protocol that was found best by an analytical model for the new adoptable mobility model/scenario earlier. The network then starts communication with new routing protocol. This enables the VANET to select routing protocol that is declared as best for the detected mobility model on the basis of the performance history of routing protocol. In result, the VANET remains consistent in different changing scenarios with the optimized performance. At the boundary of two different scenarios, if the neighboring vehicle’s protocols are contradictory, then the supervisor protocol will use tunneling to maintain the communication among the vehicles. Here, the border’s node wrap the packets according to the destination protocol requirements that are received from the node working with different protocols. The tunneling work procedure is the same as MIPv6 does when an IPv6 network communicates with IPv4 network. Second, if a vehicle is not part of the ad hoc network, the proposed scheme can adopt the mechanism to mark its messages with a specific tag to specify its communication for the member vehicles only.
Figure 4 shows the proposed algorithm for the described problem. It monitors direct mobility metrics/microscopic mobility characteristics (traces) and predicts operational environment.
The proposed algorithm for automatic selection of mobility model and routing protocol.
Simulation results and analysis
Simulation in EstiNet 8.1 validates the scheme proposed in this article. The efficiency of Link Reliability-Based Greedy Perimeter Stateless Routing (GPSR-R), 29 Road Aware Geographical Routing (RAGR), 27 and Guaranteed Geocast Routing (GGR) 30 protocols are measured for different network size, mobility speed, and mobility models. The configurations are kept similar throughout the simulation. In each individual scenario, the protocols are executed with the same mobility model, environment, and traffic condition.
Table 2 describes the simulation parameters’ configuration in detail. In the table, multiple values in a field show that the simulation is carried out for all these values one by one keeping all the other parameters constant.
Simulation parameters’ configurations.

3d: three-dimensional.
The simulation is tested for different network size with 10 and 50 nodes. Mobility speed of the nodes is kept 10 and 20 m/s (for vehicle). The group mobility with 10 and 50 nodes’ network is simulated. The simulator and computer/system configuration allow us to scale the network up to 200 nodes at the maximum. Increasing the number of nodes will increase the size of topology proportionally. The space between nodes is 100 m in the initial deployment of the nodes over the simulation region, which later move on to random trajectories. The Request to Send (RTS) threshold is set to 3000 bytes. The packet size is 1400 bytes. The nodes are spread in 3000 m × 3000 m along x-axis andy-axis area. The simulation is performed for 80 min for all these scenarios.
Performance parameters
The simulation evaluates GGR, RAGR, and GPSR-R ad hoc routing protocols for two different underlying mobility models, that is,. constrained mobility model and statistical mobility model. This simulation evaluates throughput, collision, and packet drops during communication.
Packet loss
Packet loss represents the ratio of packets lost to the number of originated packets. 36
Mathematically

where nReceivedPackets = number of received packets, and nSentPackets = number of sent packets.
Throughput
The per-node throughput is the time average of the number of bits transmitted to its destination by each source node; per-node throughput is denoted by λ(n). Throughput of the network is the sum of per-node throughput in a network. Feasible Throughput is per-node throughput when it is ensured by the existence of a scheduling scheme producing per-node throughput of λ(n) bits per second. 37 For a deterministic constant 0 < c <+∞, per-node throughput capacity is of order O(f(n)) bits per second in the network 38

If the deterministic constants are 0 < c < c <+∞, then throughput capacity is of order Θ(f(n)) bits per second such that


Collision
Collision of packets occurs when simultaneous transmission of data from several nodes to a destination causes the arrival of packets at the same time.39,40 At the destination, the decoding of multiple simultaneous transmissions is difficult. During an ongoing reception when another message arrives, one says collision has occurred. As a result, incoming colliding packets may be lost or this collision results in delay at the medium access control layer known as a broadcast storm problem. A collision occurs in high vehicular density where the number of hops is high. 41 In this article, these performance metrics are compared for the protocols under consideration.
Simulation results
The overall simulation consists of three phases. The first phase simulates routing protocols for performance in the constrained and statistical mobility environment separately. The result of this simulation measures the performance of protocol and shows which protocol outperforms others in a particular environment. In the second phase, the routing protocols are tested for performance in an environment which is constrained for the first 30 min and then changed to statistical afterward. The outcome of this simulation is that the protocol performance is not consistent due to change in the environment. The third phase represents the proposed scheme. The supervisor protocol detects the change in the environment from traces and changes the protocol when the environment is changed to statistical during movement. As a result, we get consistent performance from routing protocols. The performance is not degraded with the change in an operational environment. In this way, simulation-based analysis evaluates scalability and efficiency. Simulation results are presented in the form of graphs. Simulation scenarios’ snapshots of free random mobility and restricted mobility are shown in Figures 5 and 6, respectively.

Fifty nodes’ network with total random mobility.
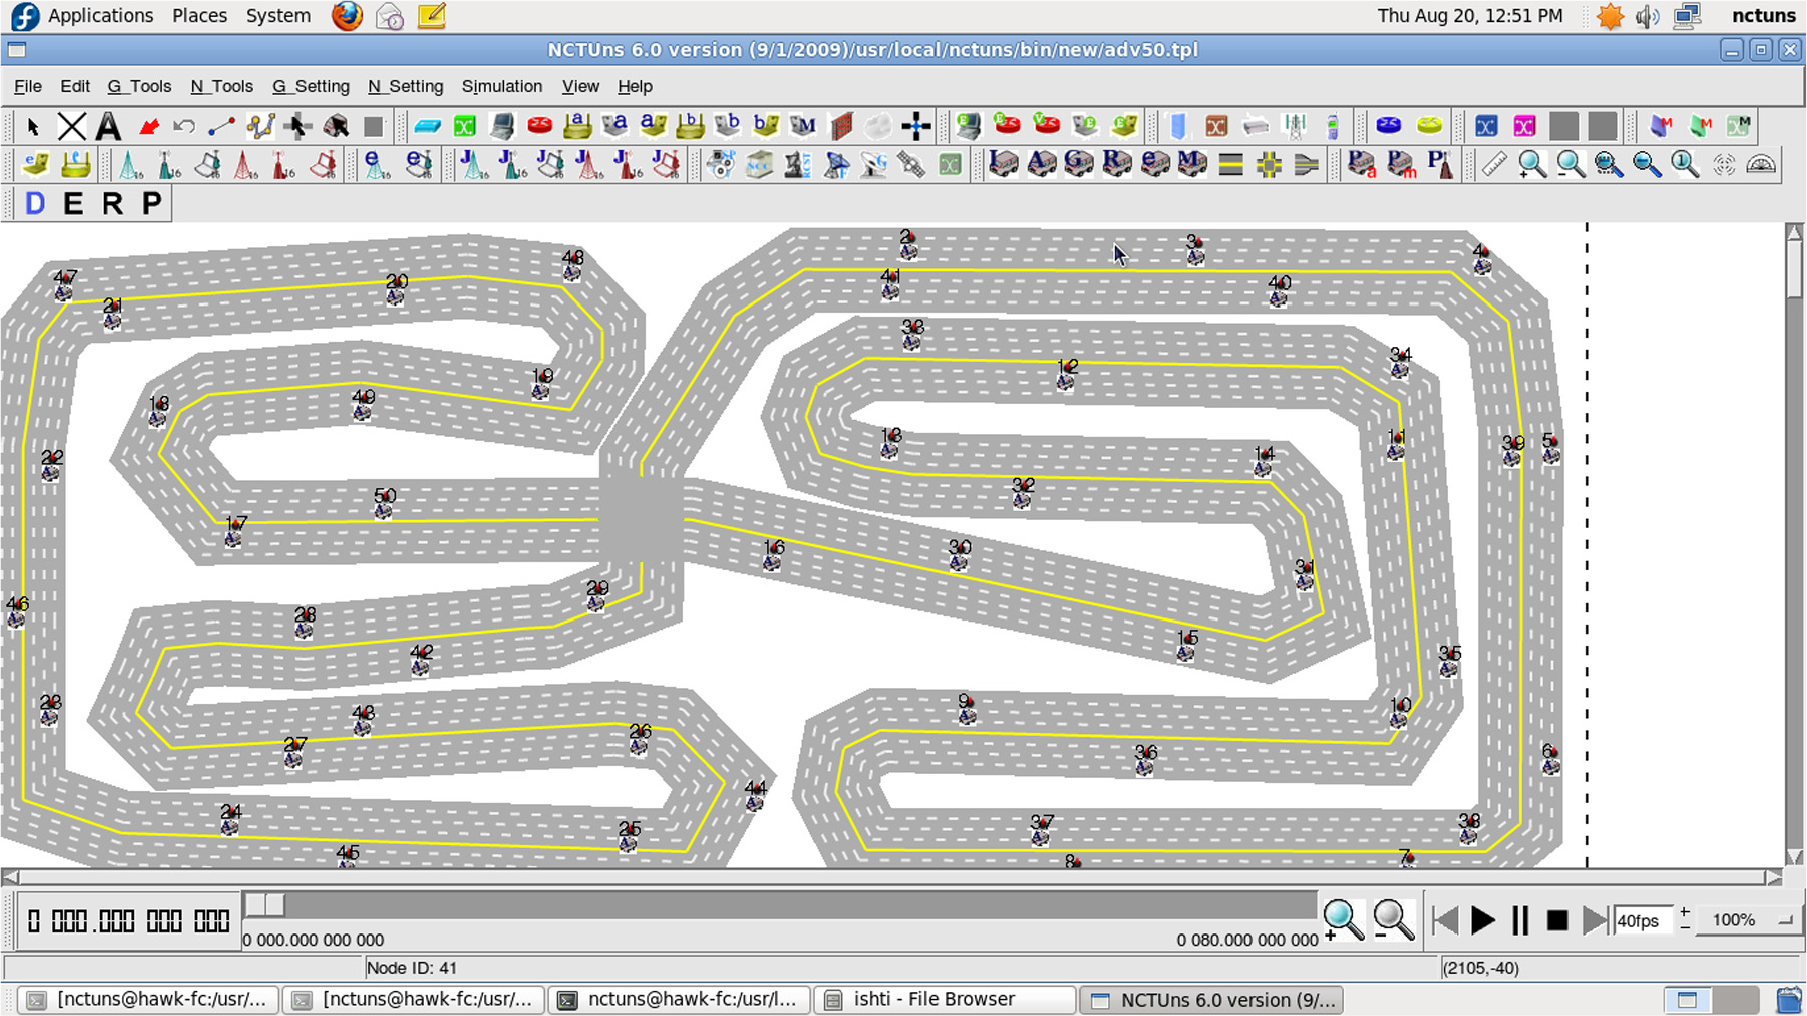
Fifty nodes’ network with constrained mobility.
The simulation results are presented in the subsections for three different scenarios. The first two scenarios validate the claim that one particular protocol outperforms others, but its performance varies with the underlying mobility models. In other words, in the changing operational environment, the performance of routing protocols is not consistent. The third scenario validates the proposed scheme. The reactive supervisory protocol senses the mobility from the traces it has and invokes the best routing protocol for further communication. The best routing protocol is chosen based on its previous performance history in the adopted mobility.
Scenario 1
A network with 10 and 50 nodes moving with different speed is tested for routing protocol performance under the random way point mobility model. The nodes are deployed randomly in a 3000 m × 3000 m area. The nodes are free to move in any direction. The maximum speed of node movement is 20 m/s. The y-axis represents the number of packets that reach the destination, and the x-axis shows the time intervals. Total time of the simulation is 80 min. Three protocols—namely, GGR, RAGR, and GPSR-R—are compared for performance. The graph results clearly show that regardless of the scalability, the performance of GPSR-R is better among the three in the random mobility model.
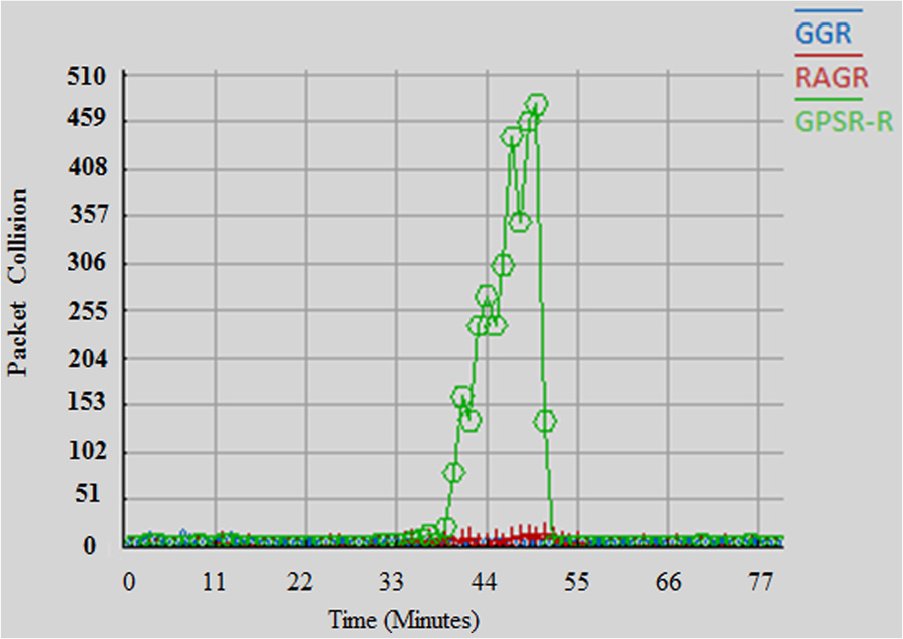
The GGR protocol was proposed for intermittent networks. Here, the data are cashed and are transmitted upon availability of route. The packet collision is high because multiple nodes find contact opportunity simultaneously. As shown in Figure 7, the collision is not consistent and sometimes very high in GGR.

Collision timeline for GGR, RAGR, and GPSR-R in random mobility.
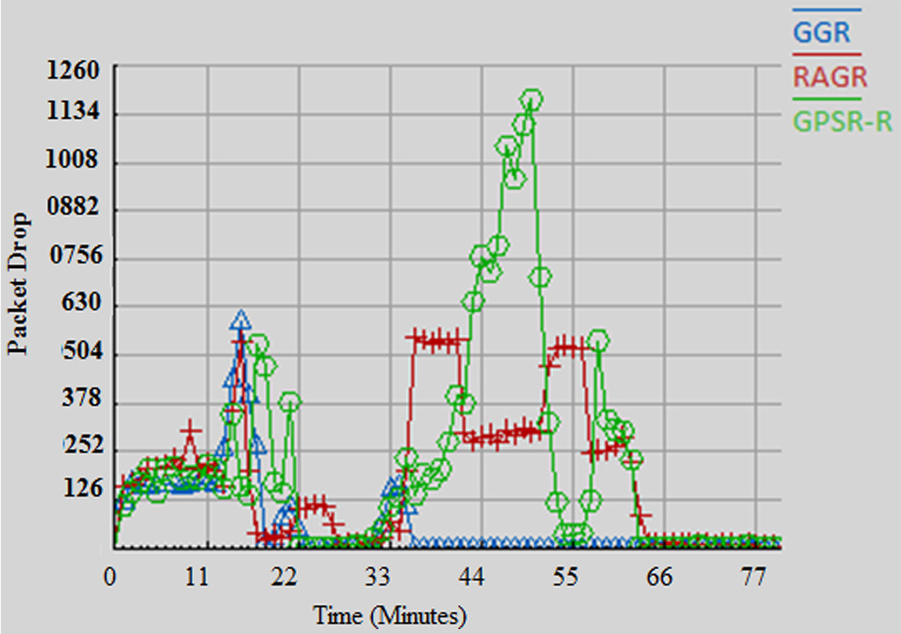
As discussed earlier, the collision factor may be high in GGR; hence, the packet drop ratio will also be high. The packets will be dropped when packets overwhelm a particular node. The packet drop ratio is high, as shown in Figure 8, when a node did not find a route in a specific time.

Packet drop timeline for GGR, RAGR, and GPSR-R for random mobility.
As shown in Figure 9, the throughput of GPSR-R is high, because the packet drop ratio and collision are low in this protocol when the mobility is random. The packets are forwarded to the relay nodes (the nodes near to the destination), and hence, the throughput is high.

Throughput timeline for GGR, RAGR, and GPSR-R for random mobility.
Scenario 2
In this scenario again, a network with 10 and 50 nodes moving with different speed is tested for routing protocol performance, but this time the underlying mobility scheme is constrained. All other simulation and performance parameters remain the same as in scenario 1. Unlike the first scenario, the results of this simulation, shown in Figures 10 to 12, verify RAGR as the best instead of GPSR-R.
Packet drop timeline for GGR, RAGR, and GPSR-R for constrained mobility.
Collision timeline for GGR, RAGR, and GPSR-R for constrained mobility.
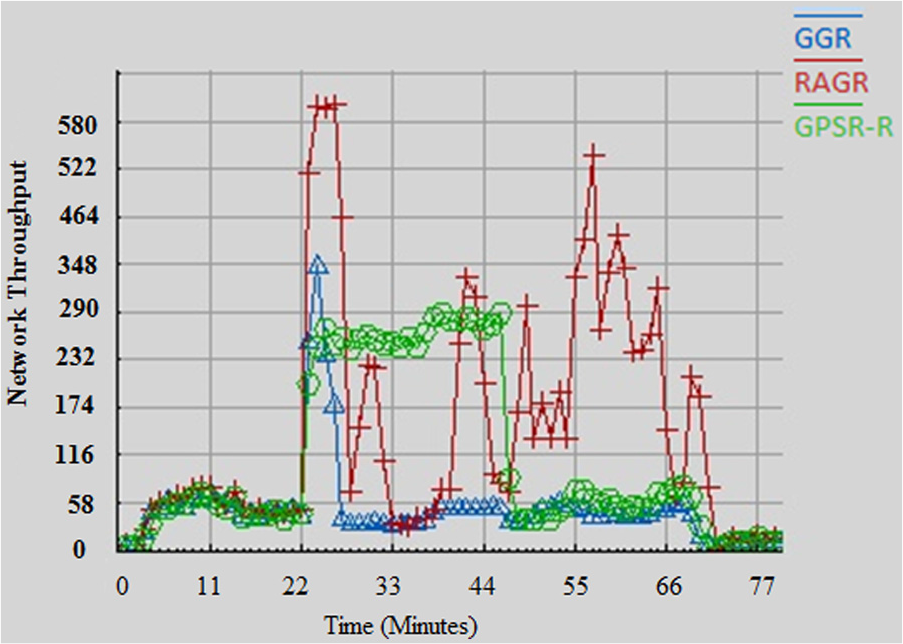
Throughput timeline for GGR, RAGR, and GPSR-R for constrained mobility.
The packet drop ratio is high in GPSR-R when the mobility model is constrained and is depicted in Figure 10. Here, the drop ratio is high due to obstacles in the route. A node shown near Global Positioning System (GPS) may not be accessible due to an obstacle in the route. The local maxima may also cause the packet drop in GPSR-R in constrained environment. As shown in Figure 11, the collision rate is high in GPSR-R due to the factors discussed earlier.
The throughput of RAGR is high as shown in Figure 12, because it is designed to forward data packets in urban areas. RAGR is based on direction, traffic density, and distance to overcome delay and packet drop issues in urban areas.
Scenario 3
In this scenario, in a total 60-min simulation, the operational environment is constrained for the first 30 min and random for the last 30 min keeping all other parameters of the previous scenarios intact. Here along with the three considered routing protocols, the proposed scheme is compared for performance. In this scheme, the nodes communicate with RAGR (in the constrained operational environment, that is, the first 30 min) and GPSR-R (in the random operational environment, that is, the last 30 min). In Figure 13, it can be seen that the performance of the RAGR is good for the first 30 min and degraded afterward. Similarly, the GPSR-R overcomes the performance of RAGR in the final 30 min. In total, the protocols failed to show consistency in performance. The results show that this inconsistency of performance is removed in the proposed scheme. The proposed scheme selects RAGR and GPSR-R in an environment where their performance is optimal. The graph of the proposed scheme is marked with the name Supervisory Protocol for Automatic Routing protocol Selection (SPARS).

Comparison of the proposed scheme with GGR, RAGR, and GPSR-R for dynamic mobility.
Conclusion
The literature shows that routing protocol performance in the ad hoc network depends heavily on the chosen mobility model. The performance of protocols varies with the change in an operational environment. In the VANET, this variation is higher as the speed of nodes is high. During an operation, the ad hoc network has to operate in either area that is urban or rural, constrained or statistical. The environment in urban areas is constrained due to buildings, and the vehicle during operation passes through different streets or link roads. Unlikely in rural areas, the environment is mostly random for mobility. The proposed scheme reduces the fluctuation in the performance graph of protocol due to change in the environment. This enables the ad hoc network to work in different scenarios with the same optimized performance. Simulation has been performed for different scenarios having different mobility models and size of the network. The reactive supervisory routing protocol gives maximum throughput with either mobility model, a random way point or constrained. The SPARS results are best when the speed of the nodes is high.
Footnotes
Handling Editor: Juan Cano
Declaration of conflicting interests
The author(s) declared no potential conflicts of interest with respect to the research, authorship, and/or publication of this article.
Funding
The author(s) received no financial support for the research, authorship, and/or publication of this article.