
Abstract
The goal of this study is to develop a vibration-based electromagnetic energy harvesting prototype that provides power to rail-side monitoring equipment and sensors by collecting wheel-rail vibration energy when the train travels. This technology helps power rail–side equipment in off-grid and remote areas. This article introduces the principle, modeling, and experimental test of the system, including (1) an electromagnetic energy harvesting prototype with DC-DC boost converter and lithium battery charge management function, (2) wireless sensor nodes integrated with accelerometer and temperature/humidity sensor, and (3) a vehicle-track interaction model that considers wheel out-of-roundness. Field test results, power consumption, Littlewood–Paley wavelet transform method, and feasibility analysis are reported. An application case of the technology is introduced: the sensor nodes of the wireless sensor network are powered by the electromagnetic energy harvester and lithium battery with DC-DC boost converter, thereby continuously monitoring the railway track state; based on the Littlewood–Paley wavelet analysis of measured railway track acceleration data, the abnormal signal caused by the wheel out-of-roundness can be detected.
Introduction
Motivation
As a means of passenger and freight transport, rail transport plays an important role in our daily lives. Over the past decade, the construction of railway infrastructure has experienced sustainable growth, especially in some developing countries. For example, as of 2018, China has 27,000 km of high-speed railway lines. 1 However, in remote and off-grid areas, it is still difficult to ensure the supply of monitoring equipment along the railway. Therefore, it is necessary to develop a new energy strategy (i.e. renewable energy). Intelligent railway track with renewable energy technology has thus been a research hotspot in recent years.2–5
Review of the state of the art
The investigation of intelligent railway track is divided into two parts: (1) smart material and structure of the energy harvester and calculation of its electrical power generation capability; (2) integration and application of the smart material and structure to build up a self-sustaining railway monitoring system. Studies of part one—smart material and structures of energy harvesters in the railway industry are abound in literature and the smart structure can be categorized into two approaches—piezoelectric and electromagnetic device.
For energy harvesters used in the field of transportation, the piezoelectric energy harvesting technology is widely investigated. For example, the application of piezoelectric pavement in highway traffic monitoring has been reported. 6 In addition, in the field of rail transit, Nelson et al. 7 developed an inductive voice coil mounted next to the track and a piezoelectric device attached under the rail for the collection of rail vibration energy. Wang et al. 8 designed a mechanical energy harvesting device with racks, gears, flywheels, and rotating electromagnetic generators. Yuan et al. 9 conducted a comprehensive study of piezoelectric drum transducers for urban rail transit. The 1/10 indoor model experiment results showed that the rms output power under full load conditions was 0.081 mW. In addition to the rail energy harvester, Pasquale et al. 10 designed a bogie energy harvester with a magnetic levitation device. An instrument in a 150 × 125 × 95 mm package was tested on a vibrating table to provide power output of 100 mW. The test conditions simulated a freight train load with a speed of 80 km/h.
Piezoelectric energy harvesters are very sensitive and can collect energy at very small vibration amplitudes; however, they have very large internal resistance (i.e. low output current), 11 which limits their electrical load capacity. For the electromagnetic energy harvesters, the resonant harvester works only when the excitation frequency is equal to the natural frequency of the system; however, the rail vibration frequency always varies, depending on the type and speed of the rolling stock. Mechanical energy harvesters require relatively large displacement amplitudes (6.4–19 mm for Wang et al. 12 and Pourghodrat et al. 13 and 6 mm for Zhang et al. 14 ), while the actual amplitude of vertical rail displacement is typically less than 3 mm. According to the field test data of Zhai, 15 for continuous welding ballastless tracks, the vertical displacement amplitude is less than 2 mm. Therefore, in a previous study, 16 we proposed a broadband electromagnetic-induction energy harvester through magnetic levitation, which is more suitable for capturing wheel-track interaction energy.
With regard to the integration and application of smart materials and structures to establish a self-sustaining railway monitoring system, Bischoff et al. 17 established a wireless sensor network (WSN) to provide strain monitoring of the truss railway bridge using solar energy to power the sensors. Sekula and Kolakowski 18 proposed a dynamic weighing (WIM) system using a piezoelectric strain sensor powered by a photovoltaic module. Solar energy is highly dependent on weather conditions, and solar panels need to be cleaned frequently to maintain optimum performance. 19 However, there is no sunlight available for rail transport in tunnels and subway rail transit. 20
In a summary, although numerous energy harvesters have been proposed and manufactured, only a few studies have discussed their integration and application in self-sustaining railway monitoring systems.
Scope of article
Based on the previous discussion, the authors use a vibration-based energy harvester to power the railway-side sensor nodes and establish an intelligent monitoring system for urban rail transit. The system consists of several autonomous sensor nodes with a ZigBee protocol stack and an energy harvester for railway condition monitoring. The new contributions and features of this research are (1) compared with the solar-powered WSN system, the proposed solution has nothing to do with weather conditions and can be used for tunnel railway transportation and urban rail transit; (2) the vehicle-track interaction model can predict the rail vibration response under the traveling loads of train with or without wheel out-of-roundness (OOR); (3) in addition, by measuring the original acceleration signal and conducting wavelet transformation, the track defect can be directly identified, which brings great convenience to the engineering community.
Figure 1 shows the technical approach for intelligent monitoring of urban rail transit proposed in this article. It includes (1) an electromagnetic energy generator with a lithium battery charge management circuit and a DC-DC boost converter; (2) a track wireless sensor node with embedded accelerometer and temperature sensor. The track-side sensor is connected to the ZigBee terminal device and is powered by the energy harvester. Data can be transferred to the ZigBee coordinator and accessed using web computing technology via web pages on the Internet.
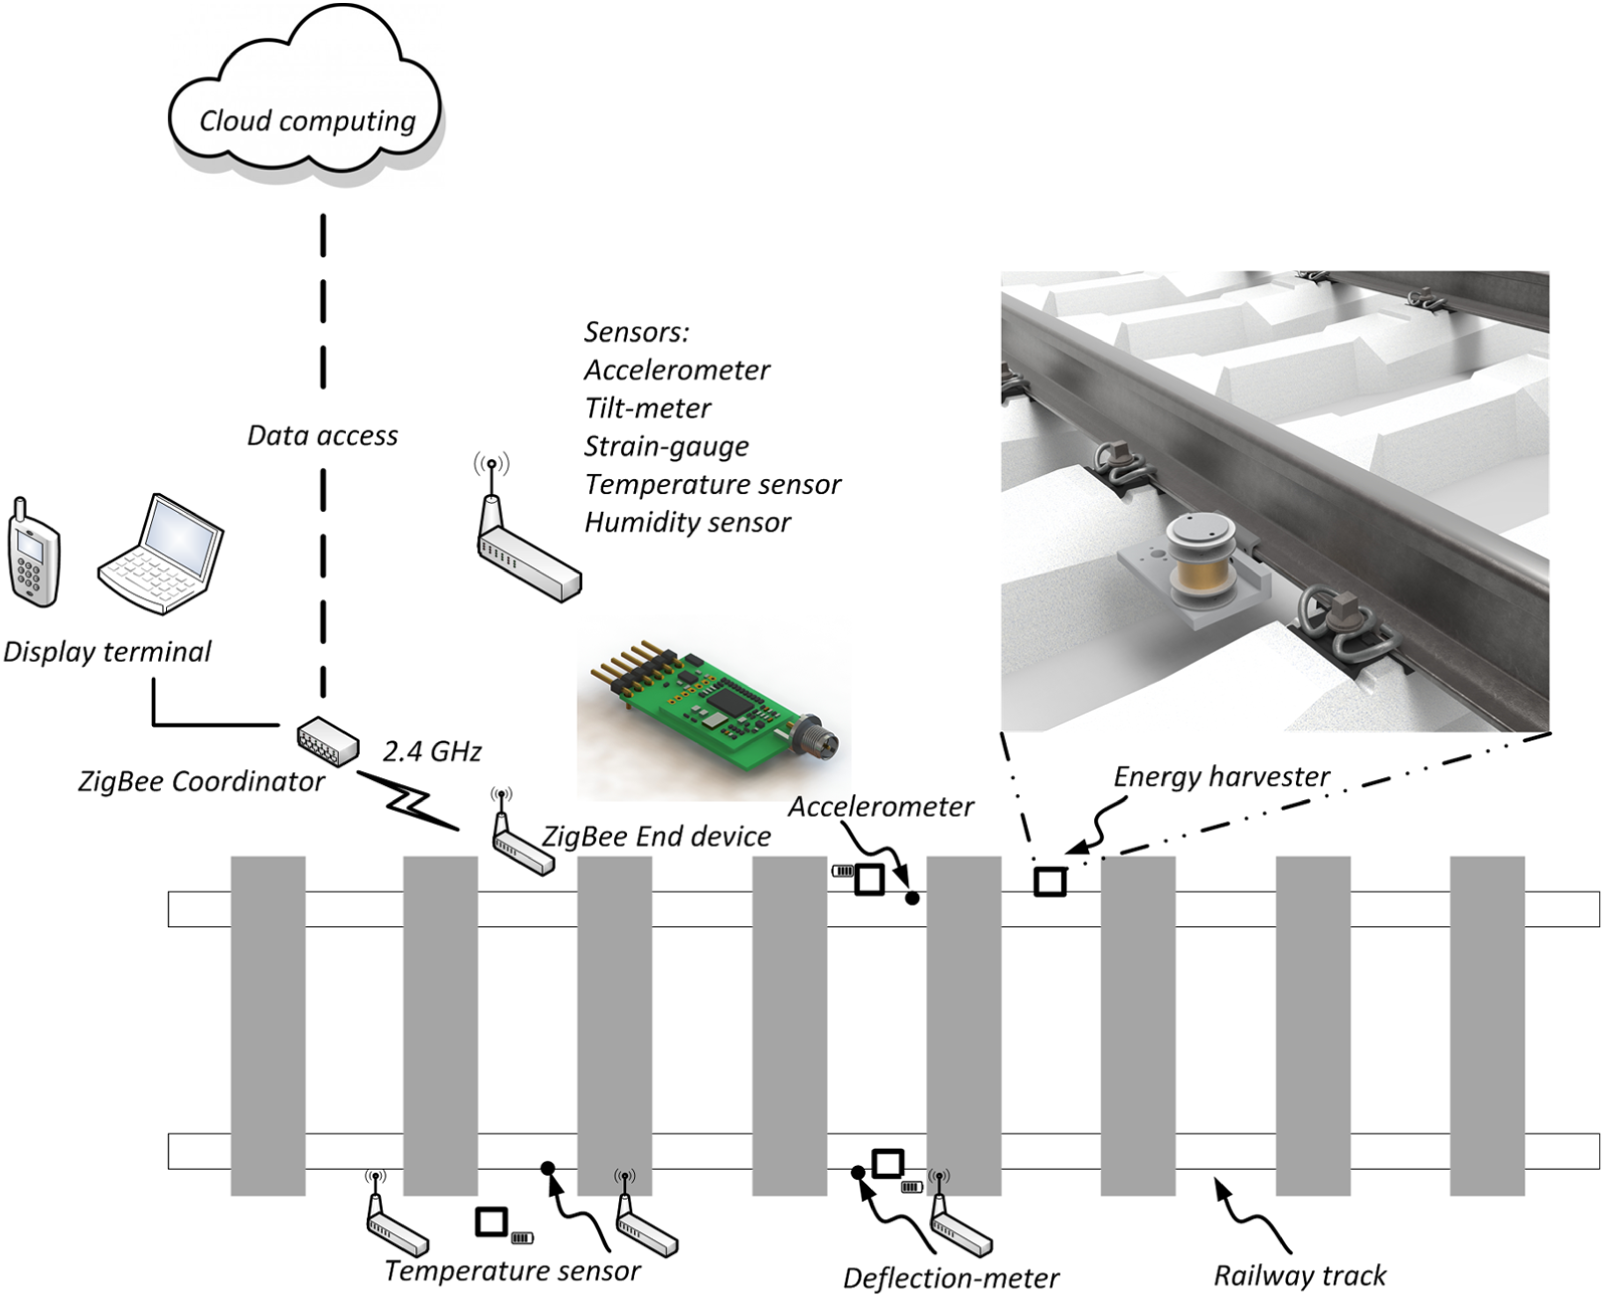
Illustration of proposed solution for intelligent monitoring of underground railway.
The remaining chapters of this article are organized as follows. Section “Theory and modeling” introduces the theory and modeling of electromagnetic induction energy harvesting; describes the equations for wheel OOR and the modified Littlewood–Paley (L-P) wavelet formula. The construction of autonomous sensor nodes and DC-DC boost converters is shown in section “Materials and methods.” Section “Application scenario” presents a detailed application study of intelligent monitoring of urban rail transit. The non-circular wheel is identified based on the original acceleration signal and the L-P wavelet analysis. Section “Conclusion” highlights future research priorities and draws conclusions.
Theory and modeling
Electromagnetic energy harvesting by magnetic levitation
In this study, we use an electromagnetic induction energy harvester to generate electricity. The device is fixed at the bottom of the rail and is subjected to dynamic loads as the rail vehicle passes. The energy harvester captures the rail vibration energy of the vehicle as it passes and charges the lithium battery.
Figure 2 shows the physical model of the electromagnetic induction energy harvesting system. The shaded rectangle represents the moving magnet suspended within the frame; the coil is attached to the aluminum frame and the aluminum frame is clamped to the rail bottom.

Electromagnetic energy harvester by magnetic levitation: (a) physical model, (b) representative mechanical schematic, and (c) equivalent circuit.
The governing equations of the monostable electromagnetic-induction energy harvesting system can be written as


where
The energy harvester can be connected to the rail in two ways. For serial connection, the energy harvester is typically located between the track and the sleeper, or between the sleeper and the slab track; therefore, the presence of the transducer will change the track stiffness. For parallel connection, the energy harvester is rigidly connected to the rail bottom; it is neither connected to the wheelset nor to the sleeper, so we consider the parallel connection as an additional mass of the rail and calculate the resultant change of the rail mass and rail moment of inertia.
The Maxwell–Ampere’s law and Faraday’s law can be written as


where
When specifying an induced voltage Vind, the component of the power to the resistive load RL is defined as

The total resistance of the coil is calculated by
where N is the number of turns, L is the perimeter of the coils’ cross section, A is the total cross-section area, σcoil is the wire bulk conductivity, and acoil is the wire cross-section area of the coil.
According to Lenz law, the direction of the induced current is always against the change that produces it. This explains the electrical damping in the electromagnetic energy harvester. Assuming an harmonic excitation, the damping force that can be calculated by
where
The energy generated during a given time period (also energy dissipated by damping) can be calculated by
where
The electromagnetic coupling equation (3) and (4) represents the method of calculating the induced voltage and the magnetic flux density, and equations (5) and (7) describe the relationship between the damping force and the electromagnetic energy parameter. Equation (8) is the final representative equation of the theory, and the energy produced by the vibration transducer is equal to the work done by the damping force.
Dynamics modeling of vehicle-track interaction with wheel OOR
Vehicle model
We built the vehicle model as a multi-body system with 10 degree of freedoms (DOFs) as shown in Figure 3. The rail transit vehicle moves on the rail track at a constant speed of v, and the vehicle mass is

Vehicle-track interaction model.
Dynamics parameters of metro vehicle.

Railway track model
The track structure consists of three layers (rails, sleepers, and slab track), which is assumed to be infinitely long Euler–Bernoulli beams supported on discrete continuous elastic foundations (as shown in Figure 3). The fasteners are DT-III common fasteners, which is widely used in the railway lines of the Chinese subway. The parameters of the track model are listed in Table 2.
Parameters of track model.

Vehicle-track interactions
The governing equation of the vehicle-track system can be written as 15

where
By applying the Hertz theory of nonlinear elastic contact, the wheelset/rail vertical interaction force can be written as

where
Wheel OOR
The term “out-of-round” refers to any imperfect roundness in the wheel, in other words, the wheel radius is inconsistent from the midpoint of the wheel to any point on the wheel tread. The OOR of the wheel causes vertical vibration, which means that the wheel will jump vertically when it rotates, and its predominant vibration frequency is about 500 Hz. Non-circular wheels can cause bumpy operation of the vehicle, damage to the spring fasteners, and even derailment.
The OOR of the wheel herein is the radial dimensional deviation of the wheel tread due to uneven wheel wear. If the main contribution is due to the harmonic component, we can classify the wheel’s OOR as periodic OOR. If the contribution comes from the superposition of multi-frequency harmonic components, we can classify the wheel’s OOR as random OOR. Usually we represent the OOR of the wheel as a displacement formula by the Fourier series with 1 to Nth harmonic components as

where
In this article, based on the field test data of the non-circular wheel, 21 we use the cubic spline interpolation and periodic expansion method to obtain the time history of the wheel tread irregularity. The position is obtained by multiplying the speed of the vehicle. Figure 4 shows the field test data of the non-circular wheel. Figure 4(a) is the polar diagram of the non-circular wheel, and Figure 4(b) is the magnitude of all harmonic components. The maximum radial runout is 0.1013 mm, and the first-order harmonic component dominates.

Field test data of non-circular wheels of vehicle: (a) radial deviation and (b) distribution of harmonic components.
For track irregularities, the German track Power Spectral Density (PSD) is applied to the vehicle-track interaction model. The German PSD spectrum is based on a large number of field tests and is a good representation of realistic track geometry. The wavelength ranges from 1 to 200 meters and the vehicle travels at a speed of 250 km/h. Track irregularities are shown in Figure 5(a). Figure 5(b) shows wheel tread irregularities made by cubic spline interpolation and periodic extension. It is observed that the irregularity of the track is characterized by random fluctuations, while the tread of the wheel is characterized by periodic fluctuations.
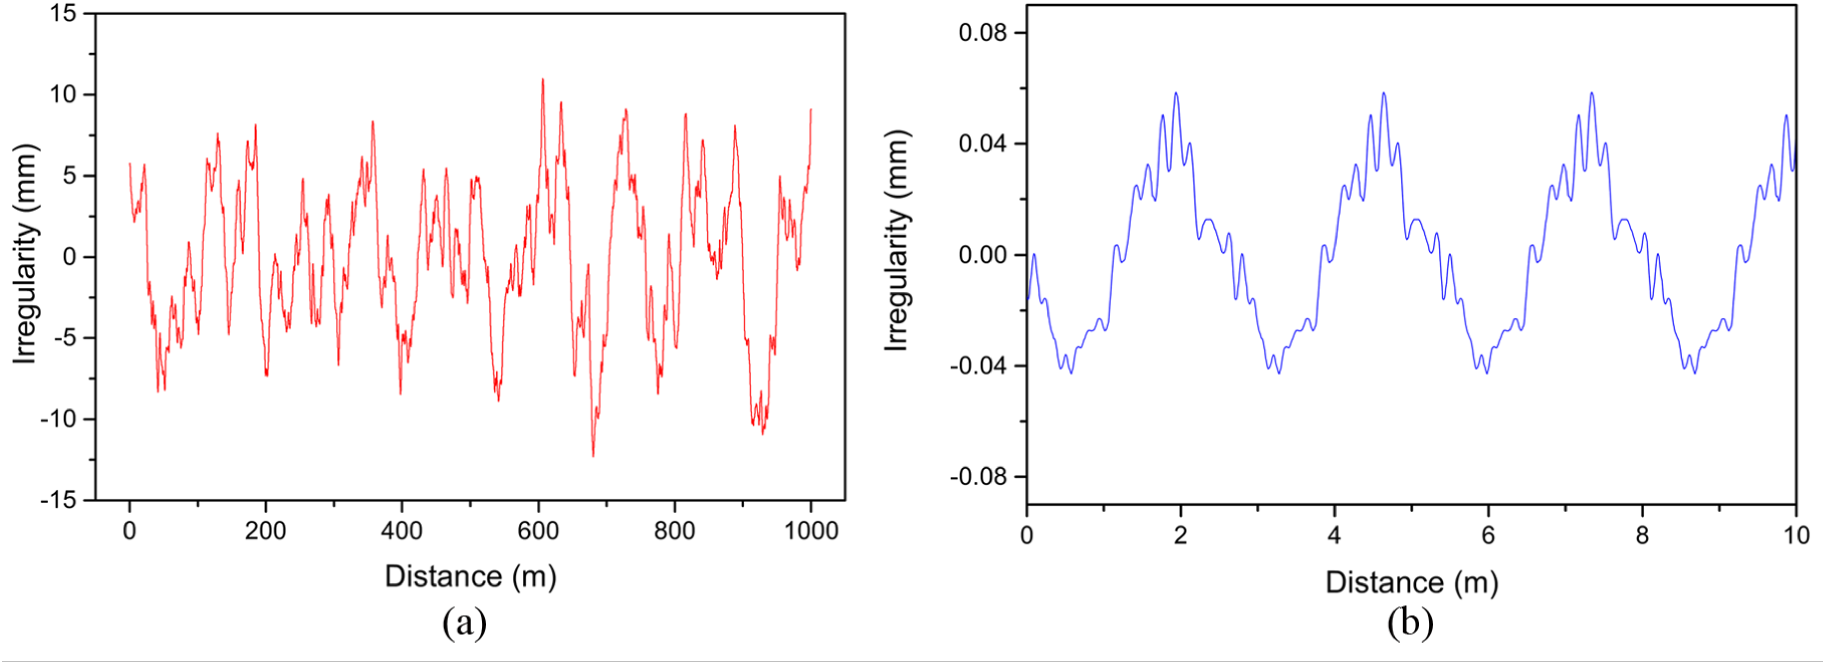
(a) Railway track irregularities and (b) wheel tread irregularities used in the calculation model.
Detection of out-of-round wheel by modified L-P wavelet transform
Continuous wavelet transform (CWT) is used to divide the continuous time function into wavelets. In this article, we perform CWT of the rail acceleration signal. It has the ability to provide good time and frequency positioning of wheel-to-rail interaction energy when the train passes. Therefore, it is used to construct a time-frequency representation of the position of the non-circular wheel.
Function


Then the continuous wavelet transform is defined as
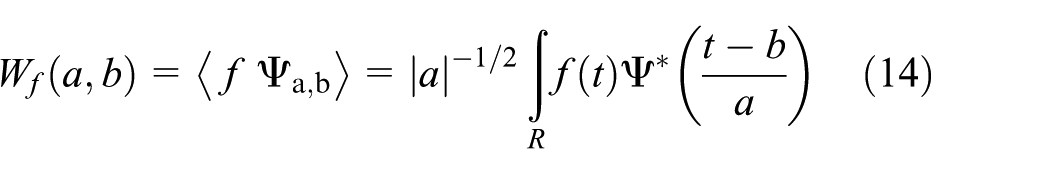
The wavelet transform coefficients represent the local similarity between the wavelet function and the signal. The larger the coefficient, the higher the similarity, so it is important to select the mother wavelet with similar characteristics to the target signal. We use the modified L-P wavelet with good precision positioning. 22
The improved L-P mother wavelet function is

The frequency domain expression can be written as

where
Materials and methods
Sensor nodes of WSN
The proposed prototype includes a ZigBee full-function coordinator on the roadside and a series of sensors (accelerometers, temperature sensors, and humidity sensors) connected to the track-side ZigBee sensor nodes. The ZigBee hardware prototype is developed based on the TI (Texas Instruments) platform and the CC2530 chipset. The ZigBee sensor node is powered by the lithium battery and energy harvester. It includes a sub-miniature type-A connector with an external RF antenna and communicates wirelessly with the ZigBee Coordinator. The hardware prototype is shown in Figure 6.

Illustration of hardware prototype of self-sustaining sensor nodes for urban rail transit.
We use the ADXL series of MEMS accelerometers and the DHT11 temperature/humidity sensor. Digital output data can be accessed via SPI (3-wire or 4-wire) or I2 C digital interface. Many suitable sensors (such as inclinometers and accelerometers from Colibrys, strain gauges, temperature sensors, and pressure transmitters from HBM) are available on the market and can be selected based on the specific requirements of the system. At 4.5 dbm TxPower, the average power consumption of a ZigBee device is approximately 144.6 mW. During field test, we set the TxPower value to 4.5 dbm to get a higher RSSI. The wake-up period is approximately 0.1 to 0.5 ms, depending on the specific wake-up mode (e.g. power mode → valid: 0.1 ms; active → TX or RX: 0.5 ms).
DC-DC boost converter with battery management function
The ZigBee sensor node is powered by the lithium battery that is charged by the energy harvester when the railway vehicle passes. The induced voltage of the energy harvester varies with time and has the characteristics of the alternating voltage waveforms; therefore, a DC-DC boost converter and a bridge rectifier are required to convert the alternating voltage input into the stable DC output.
The requirements for the DC-DC booster circuit are (1) the startup voltage is as low as possible. Because the generated voltage by renewable technologies such as photovoltaic power generation, vibration power harvesting, and wind power generation is affected by the environment. Taking electromagnetic vibration power harvesting technology as an example, when the vibration amplitude is low, the induced voltage is small, thus requiring that the DC-DC circuit can start work at lower input voltage. (2) High conversion efficiency. Due to the instability of the renewable energy source itself, it is required that the DC-DC circuit can work even when the input power is small (less than 50 mW). Therefore, the DC-DC circuit needs to have high energy conversion efficiency, so the conventional series regulator circuit cannot be used. Switch mode regulator circuit is required. (3) Battery management. The renewable energy generating device does not directly supply power to the load but supplies power to the rechargeable battery (or super capacitor) through the DC-DC circuit. Therefore, in addition to the functions of rectification, filtering, and voltage regulation, the DC-DC circuit also needs a battery management module to continuously supply power to the load (sensor node, etc.) by the rechargeable battery.
Performance test of energy harvester
The design of the magnetic floating vibration transducer is shown in Figure 6. Two stationary magnets are fixed to the upper and lower aluminum bushings. The upper and lower aluminum bushings are mechanically connected to the polymethyl methacrylate tube. Between the two static magnets, a floating magnet is placed at the center of the tube, and the magnetic pole direction of the magnet is set to repel the central floating magnet, so that the central magnet is suspended in the tube. The distance between the floating magnet and the stationary magnet can be adjusted. The tube is fixed to the support base with the support ring. Rail holder consists of two independent U-shaped clamping blocks. When installing, the clamping blocks are placed on both sides of the rail bottom. The two clamping blocks are connected together by bolts and clamped to the bottom of the rail. The vibration acceleration of the rail is transmitted to the fixed support, and the excitation of the vibration harvester further stimulates the dynamic response of the suspended magnet.
The vibration sweeping test of the magnetic floating vibration energy harvester is shown in Figure 7. The purpose of this test is to evaluate the effective operating frequency band of the vibration energy harvester. According to the international standard, 23 the frequency range is selected from 5 to 500 Hz, and the acceleration amplitude is set to 4g. A constant displacement amplitude excitation below the crossover frequency and a constant acceleration amplitude excitation above the crossover frequency are specified. The crossover frequency is determined by the excitation mechanism of the exciter itself. Ideally, the constant acceleration excitation should always be used. However, in the initial sweep, maintaining the constant acceleration requires a large vibration displacement; therefore, it is necessary to set the crossover frequency value to realize transition from the constant displacement excitation to the constant acceleration excitation. Integrated electronic piezoelectric accelerometers are used to control the vibration excitation of the vibration table.

Frequency-sweeping vibration test setup: (1) monitoring IEPE, (2) suspended magnets, (3) coils, (4) control IEPE, (5) power cabinet, (6) IPC with control software, (7) vibration controller, (8) energy harvester, (9) vibration table, (10) oscilloscope, and (11) laptop with LabVIEW interface: (a) electromagnetic energy harvester, (b) power cabinet and control interface, and (c) experimental setup.
Application scenario
Condition monitoring of the underground railway by self-sustaining sensor nodes with electromagnetic energy harvesters
The proposed hardware prototype includes a ZigBee full-function coordinator on the roadside and a series of sensors connected to the ZigBee sensor node on the track side. The ZigBee sensor node is powered by the energy harvester and communicates wirelessly with the ZigBee coordinator. Table 3 summarizes the typical power consumption of the proposed ZigBee node and power generation capabilities of the energy harvester.
Summary of power flow of sensor nodes.

Field tests were conducted in the tunnels of the Wuhan–Guangzhou high-speed railway line. The track consists of continuously welded tracks that are fastened by spring fasteners and supported on concrete double block sleepers by rubber pads. The vehicle consists of 2 motor cars and 14 trailer cars. Each cabin is supported by two bogies with a bogie spacing of 2.5 meters and a vehicle spacing of 18 meters. The length of the motor car is 25.7 meters and the length of the trailer car is 25 meters. The total length of the train is 401 meters (Figure 8).

Field test of self-sustaining sensor nodes with local energy harvesting.
The excitation mechanism of the wheelset/track system can be divided into three types: 16 moving load (quasi-static) excitation, excitation caused by wheel/rail roughness, and parameter excitation (discrete track support and intra-/inner axle spacing). The operating frequency range of the energy harvester is selected to cover low-frequency excitation sources (e.g. parameter excitation) and high-frequency excitation sources (e.g. wheel/rail roughness).
Table 4 lists the calculated average power and maximum power of the energy harvester. The total damping c is determined by laboratory tests. We found two main frequency bands of the rail acceleration PSD, one at 10–30 Hz and the other at 400–440 Hz. X01 and T01 are the displacement amplitude and duration, mainly caused by the vehicle axle spacing, while X02 and T02 are mainly caused by the bogie axle spacing. The calculated average power (P01) is 33.8 mW, and the calculated maximum power (P02) is 547.7 mW. Compared with the field test, Error01 and Error02 are 14.7% and 0.42%, respectively. The cause of this deviation is very complicated and may be caused by the self-inductance of the coil. Further investigations are currently underway.
Average and maximum power of the energy harvester.

There are two approaches to get the parameters such as non-linear restoring force and damping of energy harvesting systems: (1) parameter identification by experimental data. The representative works include a non-parametric identification method based on the Hilbert transform24,25 and parameter identification through the Genetic Algorithm; 26 (2) theoretical calculation based on verified general methods, such as analytical expressions for the magneto-elastic potential and non-linear restoring forces27,28 based on the magnetic field theory. In this article, the experimental parameters have been justified by using the Maxwell stress tensor method, which has been described in detail in our previous research work. 11
The frequency-sweeping vibration test result of the energy harvester is shown in Figure 9. The red line represents the measured amplitude of the excitation displacement, the blue line represents the magnitude of the measured excitation velocity, and the black line represents the magnitude of the measured excitation acceleration, which has a constant value above the crossover frequency. The green line indicates the induced voltage of the electromagnetic energy harvester by the magnetic levitation. Since the energy harvester mounted on the track is excited by the rail acceleration, it is important to specify the constant acceleration amplitude above the crossover frequency to evaluate the power generation capability of the device over the frequency range of interest.

Frequency-sweeping vibration test results of electromagnetic energy harvester by magnetic levitation: (a) displacement in relation to frequency, (b) acceleration in relation to frequency, and (c) voltage in relation to frequency.
Above the crossover frequency, the displacement excitation amplitude decreases as the frequency increases. The maximum amplitude of the excitation velocity is at the crossover frequency, and the measured amplitude of the excitation acceleration has the constant value above the crossover frequency. The vibration energy harvester mounted on the railway track is excited by the acceleration of the rail vibration, so the constant acceleration excitation is required to evaluate the effective operating frequency band of the magnetic floating energy harvesting system. The effective voltage value is obtained over a wide frequency range. We use the DC-DC booster that operates from an input voltage range of 0.9–5 V. The maximum output voltage is 6.96 V and the effective frequency band is 7–500 Hz.
Figure 10 shows the energy harvester input voltage associated with the DC-DC output voltage. The red line indicates the output voltage of the DC-DC, and the black line indicates the current delivered to the lithium battery. The output voltage of the DC-DC booster is 4.23 V at an input voltage amplitude of 0.32 V; however, the charging current is very small (i.e. 1.38 mA). At the input voltage of 0.9 V, the DC-DC booster has an output voltage of 4.5 V and chargeable current of 50 mA. Therefore, the DC-DC booster has a startup voltage of 0.9 V and corresponding charging current of 50 mA. In this configuration, the charging rate of the battery is as shown in Figure 11. The working voltage of the lithium battery is about 3.7 V, and the charging of the lithium battery takes at least 4 h. Figure 12 shows the energy conversion efficiency of the system with DC-DC booster and lithium battery management circuit. At input voltages of 1–4 V, the conversion efficiency of the system is greater than 60%.

Energy harvester input voltage in relation to DC-DC output voltage.
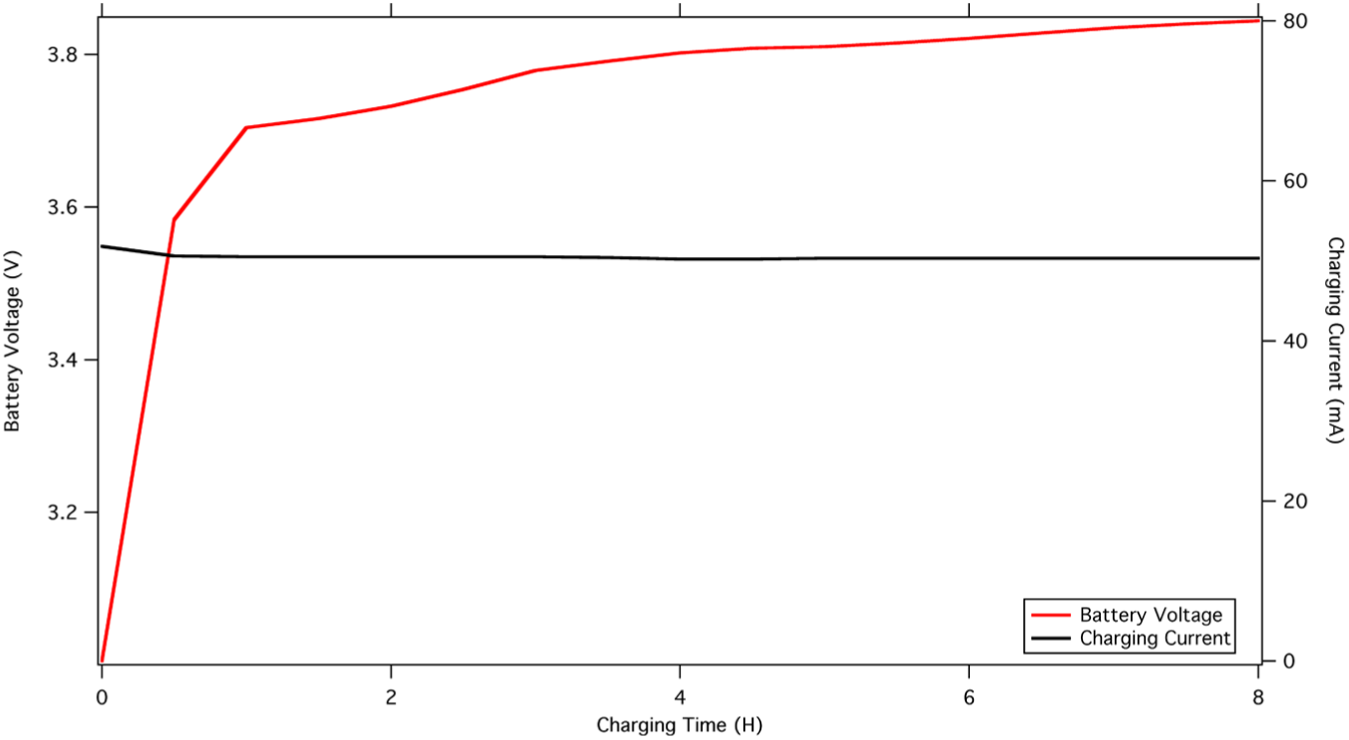
Charging rate of the battery at startup voltage of 0.9 V.

Energy conversion efficiency of the system.
The vehicle model has four wheelsets supported on two bogies. The first wheelset is set to have OOR, while the other three wheelsets are perfectly rounded. Figure 13 shows the theoretical prediction of rail acceleration time history when one vehicle cabin passes. The wheel OOR will significantly increase the rail vibration. The amplitude of the rail acceleration and high-frequency vibration are increased.

Theoretical prediction of rail acceleration responses in time domain: (a) without and (b) with OOR wheels.
The L-P wavelet transform of the original signal is shown in Figure 14. The abscissa indicates the time position of the signal, and the ordinate indicates the designated frequency of the wavelet. Coef represents a matrix whose number of rows is equal to the scale length and the number of columns is equal to the length of the input signal. The kth line coefs correspond to the CWT coefficients of the kth element in the scale vector. The results compare the signals with and without OOR. The color bars represent the energy of the wheel-rail interaction; the red color indicates a high energy distribution, and the blue one indicates a low energy distribution.

Theoretical prediction of rail acceleration spectrogram by CWT: (a) without and (b) with OOR wheels.
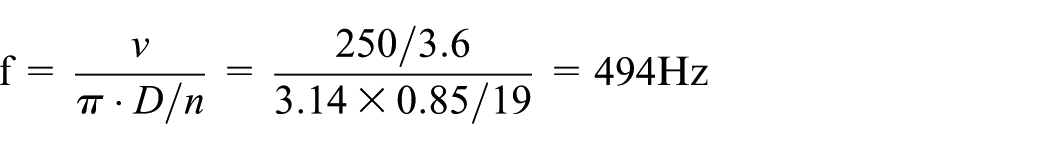
The calculation model specifies a vehicle speed of 250 km/h and wheel diameter of 850 mm. As shown in Figure 4(b), the measured OOR has harmonic components up to the 19th order, so the excitation frequency caused by OOR can be calculated as follows
As shown in Figure 14(a), for the case without OOR excitation, the main contribution of the vibration acceleration comes from the track irregularity (i.e. the vibration excitation component below 100 Hz). The passing time of the vehicle is approximately 0.3 and 0.5 s. However, if the OOR excitation is input into the calculation model, both the track irregularity and the OOR of the wheels contribute to the rail vibration, so there are two predominant vibration frequencies. The one below 100 Hz is caused by the irregularity of the track, and the other ranging from 400 to 500 Hz is caused by the OOR. The calculation results are well comparable to the analytical derivation; therefore, the proposed computational model is proven to be a suitable method for analyzing the rail vibration response excited by OOR.
The field test was conducted at one tunnel section on one running line of China high-speed railway. The railway was the CRTS-I ballastless track with bi-block sleepers embedded in a monolithic cast concrete. The bi-block sleepers and cast concrete were integrated via lattice truss reinforcement, and track concrete layer was installed on tunnel-floor fill.
Figure 15(a) records the time history of the rail acceleration signal when the vehicle passes. The test lasted for 2 days and the acceleration signals of the vehicle were similar during several rounds of trial runs. It has been observed that the rail acceleration has an abnormal signal when certain wheelsets pass. The recorded time history data are then analyzed based on the CWT, as shown in Figure 15(b). An abnormal high energy distribution was also found on the CWT map, indicating that CWS coefs have a higher value at 3.8 s with a frequency range of 400–550 Hz. The field test results are in good agreement with the theoretical calculations. We also checked the suspicious wheel pairs after the test run and found a certain degree of OOR of these wheelsets. Therefore, the rail acceleration signal and the improved L-P wavelet analysis method help identify OOR wheels, which contributes to the regular maintenance of rail vehicles.

Time-frequency analysis of the measured rail acceleration: (a) time history of rail acceleration when the vehicle passes; (b) CWT of rail acceleration.
Table 5 summarizes the harvester type, DC-DC, batteries, monitoring object, wireless communication protocol, electrical, and power capability of the proposed device and makes a comparison with the existing strategy for self-sustaining railway condition monitoring. For the sake of fairness, the comparison object is limited to the approaches in the field of railway industry. All of these approaches have prototype and the data are from the experimental measurement. The proposed technique in this article is not dependent on weather conditions and can be used for tunnel railway transportation and urban rail transit.
Comparison with published approaches of self-sustaining railway condition monitoring.

Calculated value with resistive load of 7.5 Ω.
Calculated value with resistive load of 24 Ω.
Finite element analysis (FEA) calculated power value with acceleration excitation of 20g and excitation frequency of 100 Hz.
Conclusion
Powering the sensor nodes through vibration energy harvesting provides a sustainable and convenient method for condition monitoring of underground rail transit. For urban railway tracks, this local energy harvesting can be used as a supplemental energy source, and more importantly, it can provide energy to the sensor nodes, thereby minimizing the maintenance costs of the railway wireless monitoring system and is also environmentally friendly. This article draws the following conclusions:
The proposed intelligent railway monitoring approach includes autonomous sensor nodes, DC-DC booster with lithium battery management function, and electromagnetic energy harvester. The startup voltage of DC-DC booster is 0.9 V and the corresponding charging current is 50 mA. At input voltages of 1–4 V, the conversion efficiency of the system is greater than 60%.
The experimental test on the electromagnetic energy harvester by magnetic levitation is carried out. The results show that the magnetic floating energy harvester can effectively capture the rail vibration energy in a wide frequency band. The maximum output voltage is 6.96 V and the effective frequency band is 7–500 Hz.
The vehicle-track interaction model considering wheels OOR is proven to be suitable for predicting the rail vibration responses with OOR wheels. Modified L-P wavelet analysis can be used to make a time-frequency localization of the two predominant vibration frequencies induced by the track irregularity (below 100 Hz) and the OOR of the wheels (ranging from 400 to 500 Hz).
Footnotes
Acknowledgements
The authors would like to thank Linda from University of Rutgers, USA, for language modification.
Handling Editor: Giovanni Pau
Declaration of conflicting interests
The author(s) declared no potential conflicts of interest with respect to the research, authorship, and/or publication of this article.
Funding
The author(s) disclosed receipt of the following financial support for the research, authorship, and/or publication of this article: This work was supported by the National Science Fund of China under Contract 51425804.