
Abstract
Accurate detection of the lining contours is important for the evaluation of working condition and service life of the underground structures. A 1:1 test model was constructed to elucidate the accuracy of the non-contact detection of the lining profile with a ground-coupled antenna. In addition, the accuracy at various detection distances was qualitatively and quantitatively analyzed. At detection distances below 80 mm, it was found that a radar scanning map with well-defined lining contours could be obtained when gain processing techniques were applied to the measurement signal. As the detection distance is above 160 mm, the measured signal must be processed with horizontal background removal and vertical filter gain processing. In addition, when the detected values with large errors were corrected using the functional relationship between the contact and non-contact detection values, this effectively improved the detection accuracy to 92.05% at a detection distance of 160 mm. Based on the results of this study, the detection precision and non-contact detection distance were sufficient to satisfy the requirements for typical engineering applications. Considering the high accuracy and easy operability, the non-contact coupled antenna detection method is likely to be the best option to evaluate the lining contours in underground engineering.
Keywords
Introduction
In recent years, there has been increasing interest directed toward both the development and use of underground space as a means to resolve resource-related and environmental crises in various countries. Some experts have even gone so far as to predict that a third of the global population will live and work in underground spaces by the end of the 21st century. 1 To this end, ensuring the safety and stability of existing underground structures has become the concern of researchers in academic, public, and engineering fields.2,3
The lining of an underground structure is a key element in ensuring the stability of the structure and provides load bearing, corrosion, and seepage prevention functions. If the lining has not been sized appropriately in terms of its thickness or if internal defects exist in the lining itself, these will directly affect the safety and durability of underground structures. 4 Therefore, it is essential that methods be developed to accurately detect the integrity of the lining contour of underground structures.
To this end, geological radar, hereinafter referred to as ground penetrating radar (GPR), is a non-destructive detection technology that is well-suited to detecting the contour information of linings and determining the position and size of any existing defects without impairing either the integrity or bearing capacity of buildings.5,6 The detection principle of GPR is depicted in Figure 1. As shown, high-frequency electromagnetic pulse waves are emitted from the antenna into the media, and a certain portion of these waves is reflected when the waves encounter the interfaces of different media (e.g. concrete, cavities) during propagation. The reflected electromagnetic waves are then received by the receive antenna and recorded by the host. By measuring the elapsed time, the total travel time from the transmit antenna to the receive antenna through the internal media can be calculated and various related parameters, such as the depth of the dielectric layer and the internal structure of the detected object, can be deduced based on the travel time, amplitude, frequency, and waveform variation attributes.7,8
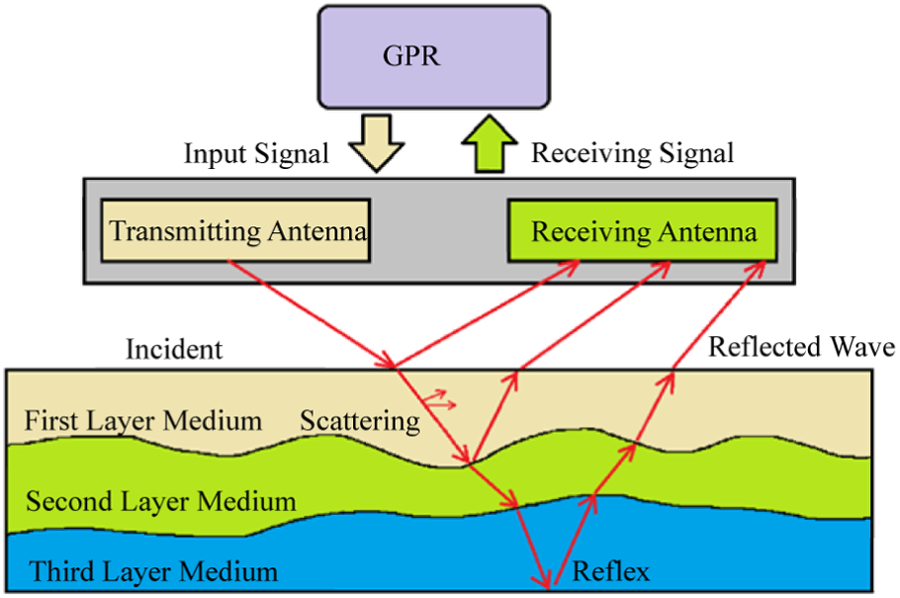
Detection principle of the GPR detection.
The transmit and receive antennas are key components in a GPR system. Existing GPR detection technology primarily evaluates building structures using an air-launched antenna.9,10 For example, the Global Sustainable Seafood Initiative (GSSI) Corporation developed 500 MHz, 1 GHz, and 2 GHz SIR horn air-launched antennas for GPR systems in conjunction with the Texas Transportation Research Institute in the United States, 11 the Ingegneria Dei Sistemi (IDS) Group, an Italian company, invented a multi-channel RIS-2K GPR system that can be equipped with a coupling antenna with multiple frequencies, 12 and the Geotech Company from Russia developed the OKO-2 air-launched antenna detection system with a frequency of 400 MHz. 13 Air-launched antenna GPR systems have been widely used in a large number of projects related to the health diagnosis of structures in the field of construction engineering. 14 However, air-launched antenna GPR systems are difficult to use for the detection of lining contours in underground engineering due to the incompatibility between the large equipment size and the small underground spaces. 15
A ground-coupled antenna is essentially a small dipole antenna that is suitable for use in a portable radar detection system. 16 Anbazhagan et al. 17 applied a ground-coupled antenna in a railway track ballast detection study to obtain a well-defined radar scanning map. As has been demonstrated in research findings in the literature, ground-coupled antennas offer the benefits of high signal energy, deep penetration capability, and high detection accuracy. However, as the lining surface in many underground structures is commonly interrupted by protrusions, such as pipelines and built-in fittings, this reduces the efficiency and increases the difficulty of contact-based detection methods. In non-contact detection applications, a ground-coupled antenna can be fixed to a small device in order to conduct detection at a specific distance and thereby avoid the interference of the lining surface and improve the detection speed.
The objective of the current study is to investigate the feasibility of using non-contact ground-coupled antenna GPR to detect the lining contour of underground structures. As per the results published by Kurtz et al., 18 due to geometric diffusion, the coupling loss, and electromagnetic scattering, a ground-coupled antenna is expected to partially lose the received signals in non-contact detection applications, which will decrease the detection accuracy. Since the signal attenuation is related to the detection distance, it is important to determine the detection distance when using the non-contact detection technique to ensure the signal attenuation is tolerable. Thus, a critical topic in the current study is to investigate the effect of the detection distance on the accuracy of the lining contour detection. At present, the transient surface wave method, 5 ultrasonic method, 6 and core drilling method 7 are used to detect lining. But these three methods have different degrees of malpractice, and it is difficult to truly reflect the quality of tunnel construction. The steady-state surface wave method and the ultrasonic method are inefficient and cannot be continuously measured. The core drilling method has a large workload and is easy to damage the lining.
To this end, a 1:1 test model was constructed to evaluate the impact of the detection distance on the lining, uncompacted backfill, and back cavity thicknesses. In addition, the detection accuracy corresponding to each detection distance was assessed. The results of this research are expected to provide an important reference for the application of non-contact ground-coupled antennas in assessing the health of underground structures.
The test model
Test design
A 1:1 local test model platform was constructed in a section of the lining in an underground project and uncompacted backfill and cavities were created behind the lining to simulate lining contours with different health conditions. The layout and photos of the test model are presented in Figure 2.

Layout and photos of the field test model: (a) design drawings of the field test model (mm), (b) ground-coupled antenna, (c) uncompacted backfill behind the lining, and (d) cavity behind the lining.
The test model platform was 9000 mm long, 450 mm wide, and 750 mm high, and the thickness of the lining was 450 mm. An open space with the thickness of 150 mm was set behind the lining to simulate a cavity and the open space was partially filled with C20 sprayed concrete to simulate uncompacted backfill. Furthermore, for the purpose of studying the impact of rebar in the lining on the detection accuracy of the non-contact ground-coupled antenna, part of the test model used C20 plain concrete while the rest of the model consisted of a C20 reinforced concrete structure. The diameter of the steel bar was 22 mm, the steel bar was model HRB335, and the bar spacing was 160 mm.
The construction process of the test model platform was as follows:
Level the site and construct the surrounding rock structure and enclosing brick wall. Coat the enclosing brick wall with cement mortar.
Mark the lining, open spaces, and the position of the formwork.
Bind the steel bars, establish the formwork, and pour the C20 concrete.
Mark the open space behind the lining and measure the value of the cavity behind the lining.
Fill the partial open space using sprayed concrete rebound materials and measure the actual thickness of the uncompacted backfill behind the lining.
Set four detection distances of 0, 80, 160, and 240 mm, respectively, followed by marking the corresponding positions of the ground-coupled antenna. Ensure the detection distance of the fixed devices can be adjusted via steel plates and angled steel.
Detection equipment
GSSI, which was founded in 1970, is regarded as the first enterprise specializing in the development of GPR, 19 and its predecessor was the National Aeronautics and Space Administration (NASA) in the United States. The detection equipment employed in the test model in the current study was provided by GSSI, the primary radar control engine used was the SIR-20, and a ground-coupled antenna with a frequency of 400 MHz was adopted for transmitting and receiving the electromagnetic waves (Figure 3) at a scanning frequency of 80 scans/s.

Ground-coupled antenna and GPR used in the test model.
Data processing methods
In order to obtain a clear radar scanning map and waveform images with high accuracy, each measurement was taken twice.
Processing the radar scanning map
The radar scanning map was processed by Radan, which is the post-processing software for geological radar data developed by the GSSI Company. The non-contact ground-coupled antenna was found to be more affected by the air medium as the detection distance increased, which cause the signal radiation intensity to weaken accordingly. To counter this, image processing techniques, such as digital filtering and adjusting the gain coefficient, were applied during image processing to obtain the clearest image. 20 A flowchart depicting the process used to analyze the radar scanning map is shown in Figure 4.

Processing the radar scanning map in the test model.
The position of the lining contour can be determined based on the amplitude attenuation attributes in the electromagnetic wave image of the GPR and the phase change caused by the positive and negative reflection coefficients of each of the interfaces. 21 For detection distances of 0 or 80 mm, clear images were obtained by gain processing only the radar signal. In contrast, for detection distances of 160 or 240 mm, it was necessary to process the radar signal by removing the horizontal background and applying a vertical filter gain to obtain a recognizable radar map. When the detection distance was 240 mm, the radar signal was found to be weak and hard to identify, which negatively impacted the detection results. The techniques used to improve the quality of the radar scanning map are listed in Table 1.
Optimal post-processing measures of the radar scanning map.

Method used to calculate the detection values
The detected thickness of the lining was calculated by analyzing the relationship between the relative dielectric constant (εr) of the dielectric layer and the travel time (Δ t ) of the electromagnetic wave in the dielectric layer. 22 As the value of the relative dielectric constant is proportional to the accuracy of the detection value, it was quite straightforward to accurately measure the lining thickness in the test model. The relative dielectric constant was determined with inversion method based on the average value of the multipoint measurement of the lining thickness, as follows

where εr represents the relative dielectric constant of the dielectric layer; c is the speed of light, which is 0.3 m/ns; Δ
t
represents the emission-receiving travel time of the electromagnetic waves in the dielectric layer in nanoseconds; and
After the relative dielectric constant of the dielectric layer was determined, the measured thickness of the dielectric layer was calculated as follows

where D represents the measured thickness of the dielectric layer in meters and
It was not possible to obtain the travel time of the electromagnetic wave in the cavity behind the lining from the radar waveform itself. Instead, curve fitting was applied to elucidate the ratio

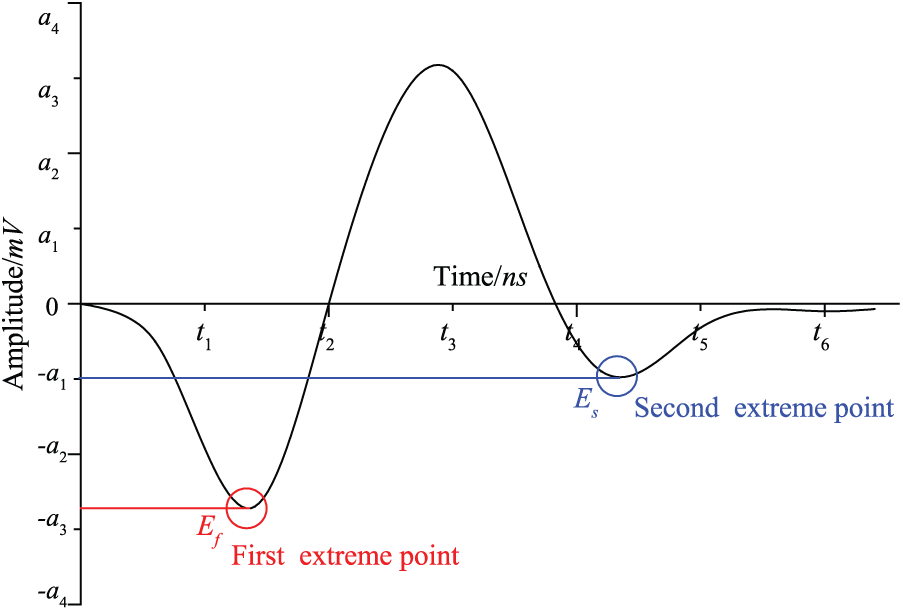
Amplitude changes over time.
Analysis of the test results
Qualitative analysis of the detection accuracy
The lining contour was detected on the test model using both contact and non-contact methods. The radar scanning map and radar waveform of the lining detection for different detection distances are shown in Figure 6.
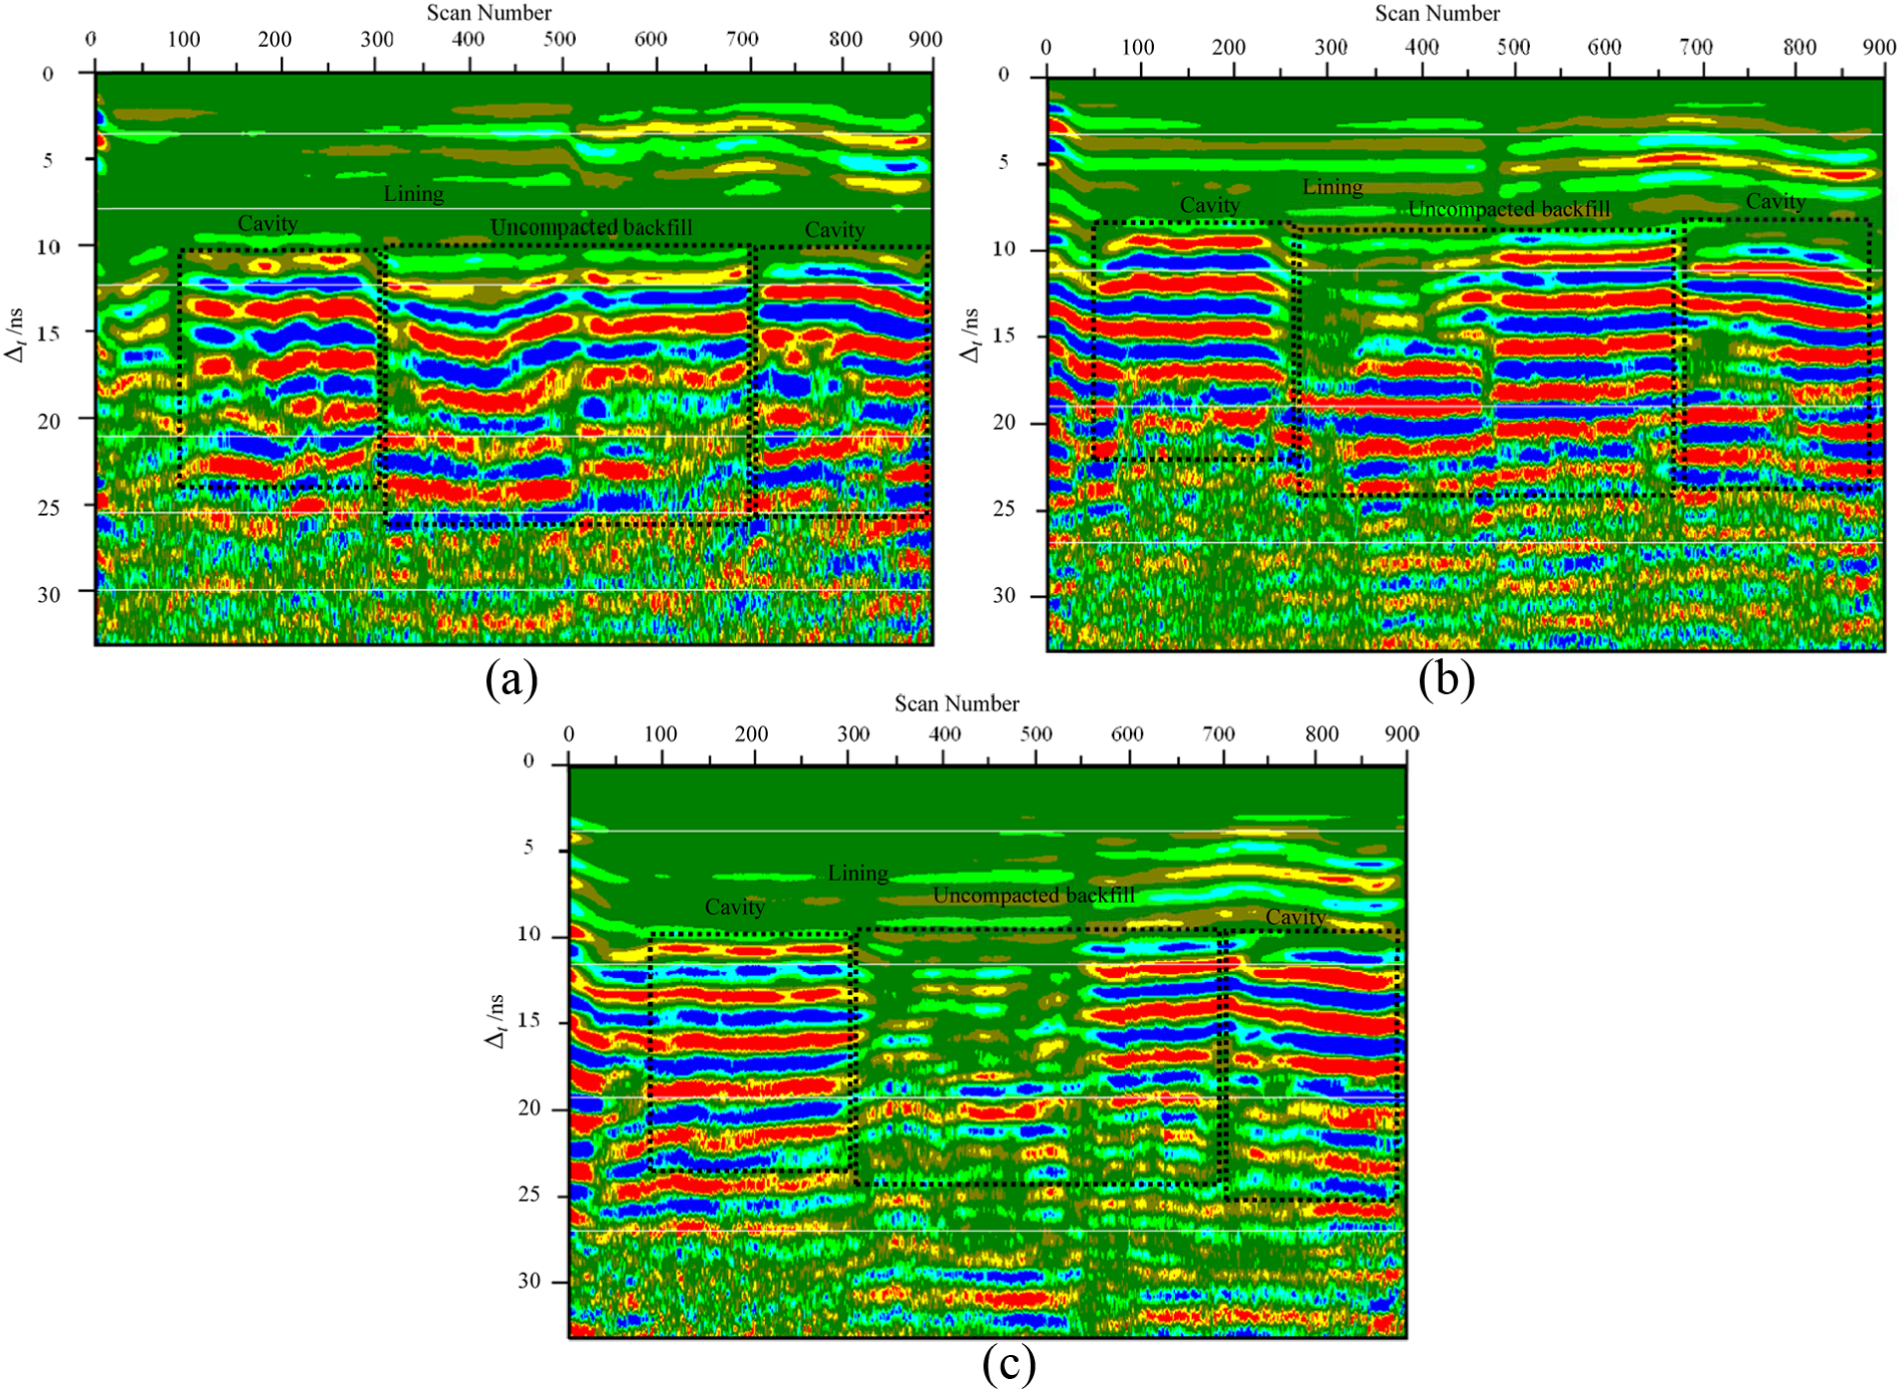
Radar scanning map of the lining detection for different detection distances: (a) detection distance 0 mm, (b) detection distance of 80 mm, and (c) detection distance of 160 mm.
At a detection distance of 0 mm, which represents contact detection (see Figure 6(a)), the contour of the lining can be seen on the radar scanning map, which makes it straightforward to determine the positions of the inner and outer surfaces of the lining. The cavity area behind the lining appears as an abnormal area on the map due to the continuous strong reflection of the same phase axis. The uncompacted backfill behind the lining can also be seen in the form of anomalies in the image. A strong reflection region is also present that exhibits alternating weak and strong reflections. Furthermore, the reflection signals representing the lining bars can also be seen in the radar scanning map. In comparison with the plain concrete lining, the map of the reinforced concrete lining indicates a local strong reflection region due to the presence of the rebar. Nevertheless, no typical rebar contour signal can be seen on the image, which indicates that the ground-coupled antenna could not be used to detect the size of the rebar in the lining. These results suggest that a radar scanning map can be used to delineate the contours of the lining as well as the outlines of the cavities and uncompacted backfill behind the lining. Such maps are useful when comparing the effectiveness of contact and non-contact detection methods.
When the detection distances were 80 (Figure 6(b)) and 160 mm (Figure 6(c)), the lining contours were visible on the radar scanning maps of all tests and the differences between the signals from the cavity and the uncompacted backfill behind the lining were easily distinguishable. The signals that propagated in the cavity were attenuated slowly, which resulted in multiple reflections as shown on the map. In contrast, the signals that propagated in the uncompacted region were rapidly attenuated, which prevented the occurrence of reflections. The uncompacted backfill behind the lining appears as an abnormal area on the image. However, as the detection distance increased, the contrast between the abnormal and normal areas became weaker. Based on these results, when the detection distance was 80 or 160 mm, the performance of the non-contact ground-coupled antenna was sufficient to satisfy the qualitative interpretation requirements.
A test with a detection distance of 240 mm was also conducted, although the imaging quality of the resulting radar scanning map was quite poor. Even though the cavity behind the lining can be easily seen, it was difficult to accurately determine the thickness of the lining and the contour of the uncompacted backfill. Thus, further tests were not conducted at this distance.
Quantitative analysis of detection accuracy
A quantitative analysis of the accuracy of the non-contact ground-coupled antenna was conducted that evaluated the following components:
The detection accuracy of the lining thickness;
The detection accuracy of the uncompacted backfill behind the lining;
The detection accuracy of the cavity behind the lining.
In the analysis, the waveform curves of several measurement points were selected on the radar scanning map, as shown in Figure 7. In the figure, points A1–A14 denote the lining thickness measurement points, B1–B6 denote the uncompacted backfill thickness measurement points, and C1–C6 denote the points at which the cavity thickness behind the lining was measured.

Waveform curves of the chosen measurement points: (a) detection distance of 0 mm, (b) detection distance of 80 mm, and (c) detection distance of 160 mm.
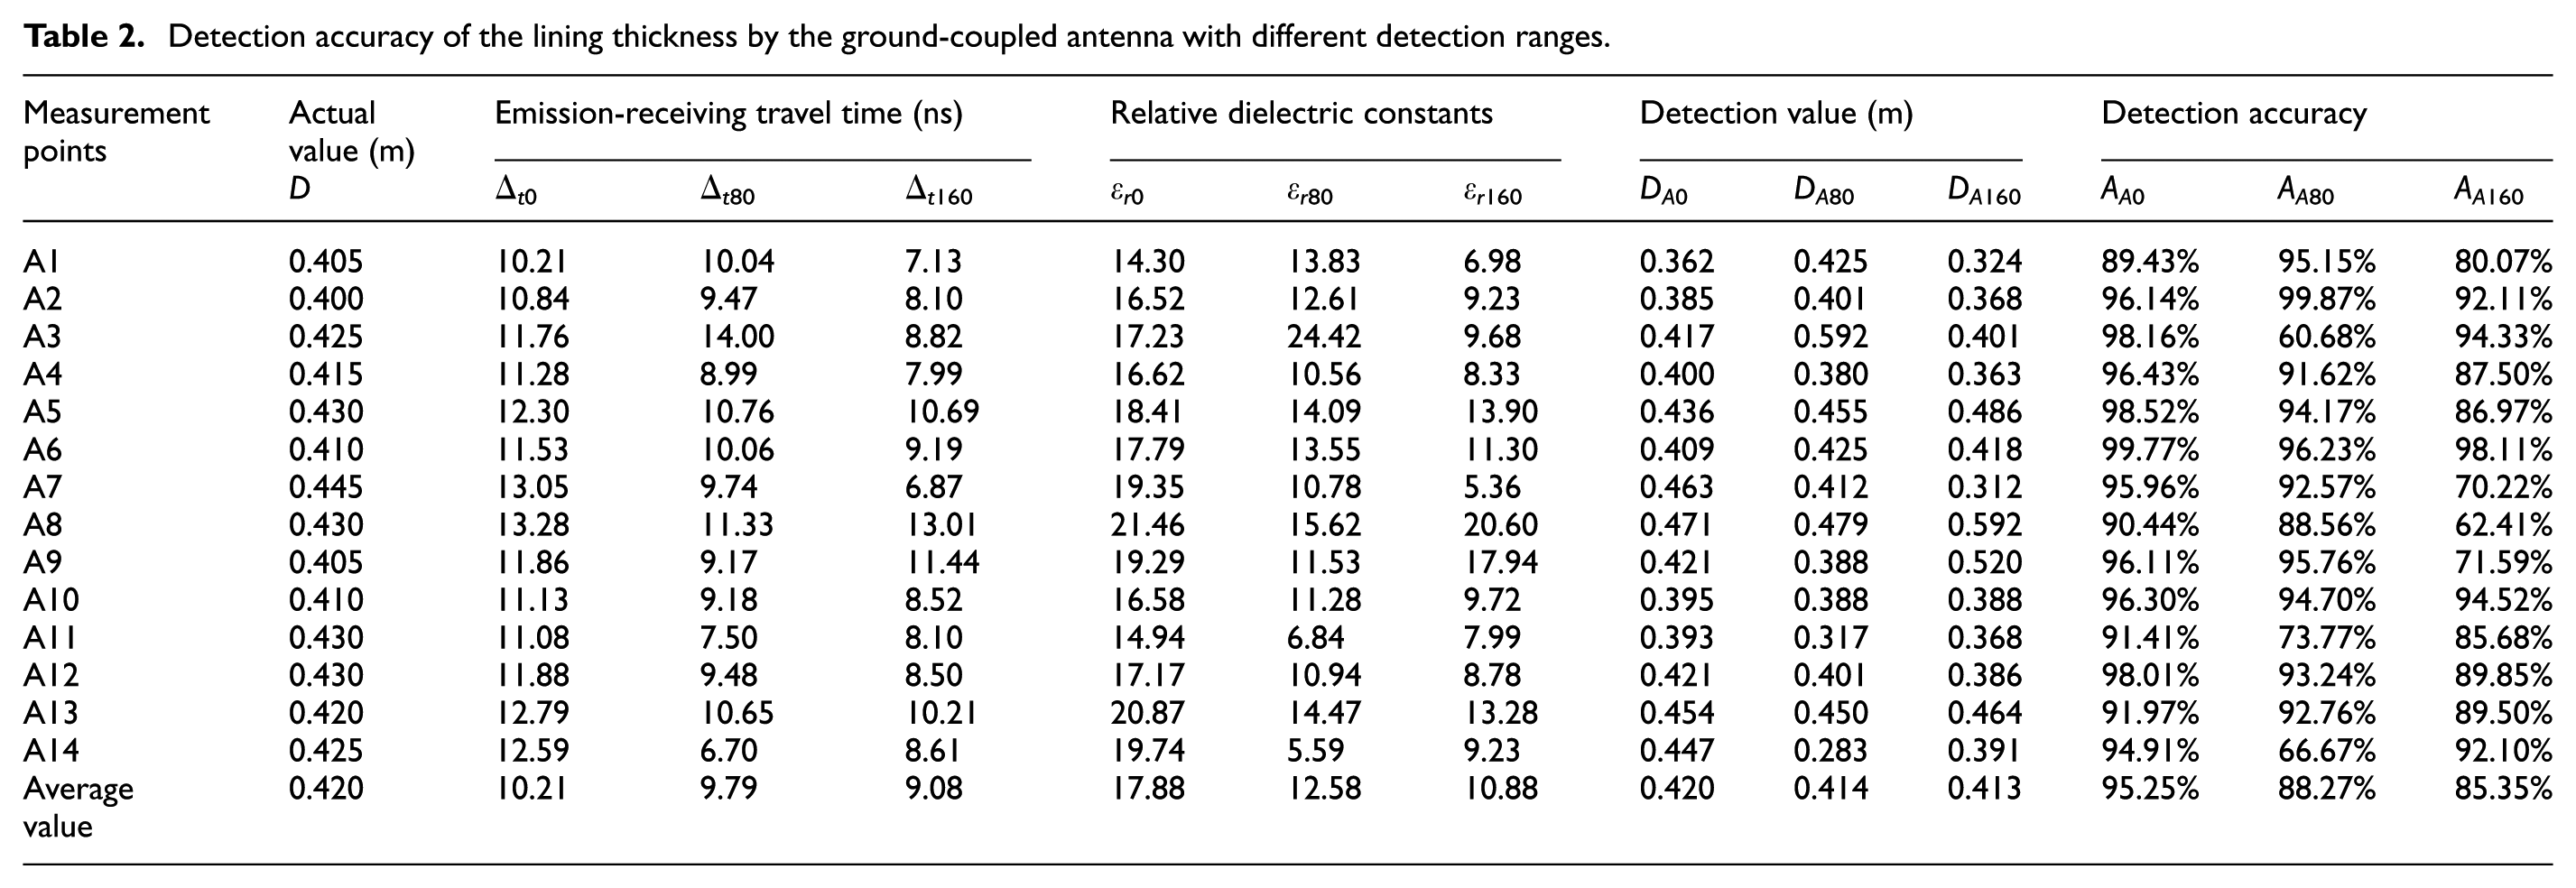
The actual thickness, the detected value of the lining, the uncompacted backfill at each measurement point, and the wave travel time in the lining are listed in Tables 2–4. In the table, Δt0, Δt80, and Δt160 represent the travel time at the detection distances of 0, 80, and 160 mm, respectively. The average travel time of the electromagnetic waves in non-contact detection was 0.5–1.5 ns shorter when compared to contact detection. Thus, it was concluded that the detection distance significantly impacted the detection accuracy of the non-contact ground-coupled antenna.
Detection accuracy of the lining thickness by the ground-coupled antenna with different detection ranges.
Detection accuracy of the uncompacted backfill behind the lining by the ground-coupled antenna with different detection ranges.

Detection accuracy of the cavity behind the lining by the ground-coupled antenna with different detection ranges.

Since a lining is not a homogeneous solid, the actual relative dielectric constant varies. In addition, in actual tests, it is also dependent on the detection equipment. By considering the actual size as well as the corresponding travel time, the calculation of the relative dielectric constant at each measurement point of the lining can be computed using equation (1). In Table 4, the terms εr0, εr80, and εr160 represent the relative dielectric constants of the lining at detection distances of 0, 80, and 160 mm, respectively. The test data indicate that the relative dielectric constant of the lining in non-contact detection was smaller than that for contact detection. In addition, the constant tended to decrease as the detection distance increased. At detection distances of 0, 80, and 160 mm, the average relative dielectric constants of the lining in front of the uncompacted backfill were 11.61, 10.02, and 8.62, while the average relative dielectric constants of the lining in front of the cavity were 12.19, 10.04, and 9.95, respectively. The average values in these two cases quite similar, which indicates the presence of the uncompacted backfill and cavity had little effect on the relative dielectric constant of the lining.
The detection accuracy (A) is defined as the degree of the proximity of the detected value to the actual value and can be calculated as follows

The accuracy of the ground-coupled antennas with different detection ranges is listed in Table 4. As per the results of the tests, at detection distances of 0, 80, or 160 mm, the detection accuracy of the lining thickness through the ground-coupled antenna was 95.25, 88.27, or 85.35%, respectively, the detection accuracy of the backfill thickness behind the lining was 96.21, 86.45, and 83.99%, respectively, and the detection accuracy of the thickness of the cavity behind the lining was 95.16, 89.68, and 89.96%, respectively. In the non-contact detection of the lining contour with the ground-coupled antenna, the detection accuracy exhibited a gradual decline as the detection distance increased. However, when the detection distance was 80 mm, the detection accuracy of the cavity behind the lining increased to 91.27%, with the exception of the data at point C5. At a detection distance of 160 mm, the detection accuracy of the uncompacted backfill behind the lining was 94.38% with the exception of the data at points B3 and B4. The detection accuracy of the measurement points in the non-contact detection tests was close to that in the contact detection tests, except for a few points that exhibited large errors. To address this, the accuracy of the non-contact detection method can be enhanced by mathematically applying appropriate data processing techniques.
Data correction and detection accuracy improvement
As mentioned previously, the results from measurement points B3, B4, and C3 negatively affected the detection accuracy of the non-contact ground-coupled antennas. This was thought to be because the detection value of the lining contour was calculated using the average of the relative dielectric constants of each measurement point rather than the actual relative dielectric constant, which introduced errors in the calculated detection value. However, as it is quite difficult to obtain the actual value of the relative dielectric constant, the proposed calculation method is considered to be sufficiently accurate to minimize the theoretical magnitude of the error. With the exception of a few measurement points, the detection values of the lining contour at the other measurement points were closer to the actual values and the overall detection accuracy can be improved if the values with a large amount of error are corrected mathematically.
To enhance the accuracy of the non-contact detection method, the functional relationship between the non-contact and contact detection values was developed in order to correct the erroneous non-contact detection values. In this approach, the detected values are considered to be samples and the correction coefficients are defined as C80 and C160 for detection distance of 80 and 160 mm, respectively. A polynomial function was employed to fit the relationship between D0/D80 (D0/D160) and D0 (Figure 8).

Functional relationship between D0/D80 (D0/D160) and D0: (a) DA0/DA80–DA0 and DA0/DA160–DA0, (b) DB0/DB80–DB0 and DB0/DB160–DB0, and (c) DC0/DC80–DC0 and DC0/DC160–DC0.
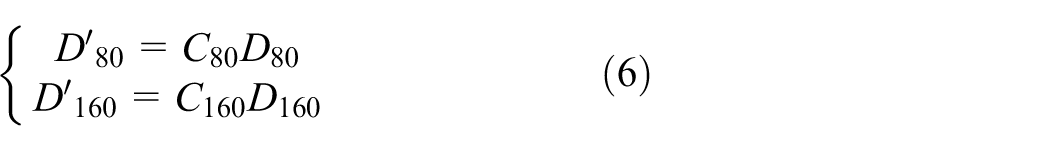
On this basis, various correction coefficients can be obtained as follows

Then, the corrected non-contact detection values can be calculated as
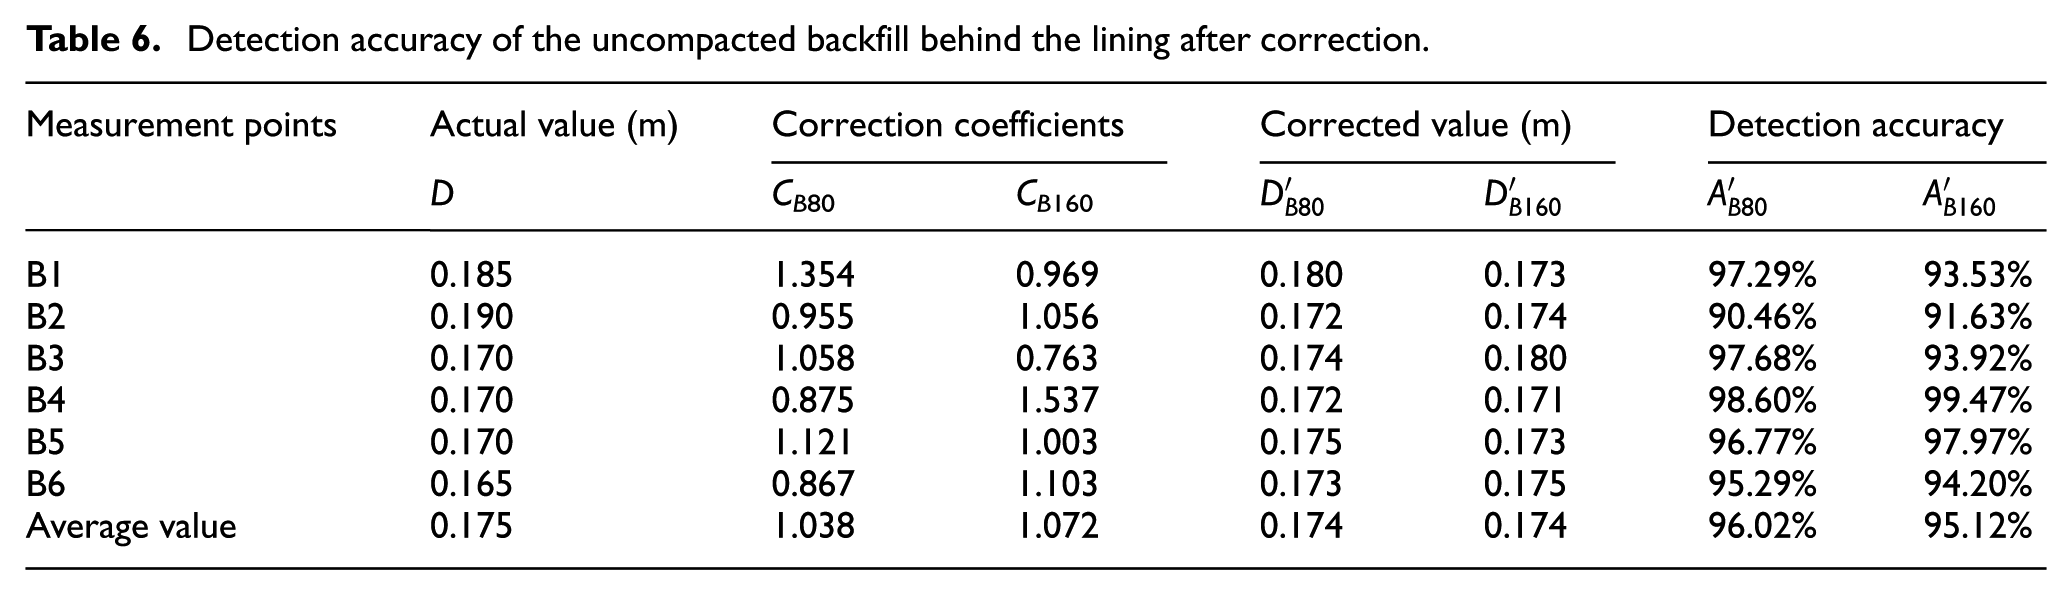
The detection accuracy of the non-contact ground-coupled antenna after correction is shown in Tables 5–7, and the results demonstrate that the accuracy of non-contact detection after correction increased to more than 92.05%, which is close to that of contact detection. With these improvements, the detection accuracy and non-contact detection distance for detecting the lining contour is sufficient to satisfy the requirements of engineering applications.
Detection accuracy of the lining thickness after correction.

Detection accuracy of the uncompacted backfill behind the lining after correction.
Detection accuracy of the cavity behind the lining after correction.

Discussion
When using the non-contact method to detect the thickness of the lining contour, the quality of the radar scanning images decreased as the detection distance increased. To obtain satisfactory radar scanning images, it was found that the radar reflection wave had to be processed using various methods, such as digital filtering and adjusting the gain coefficient. The imaging quality of the radar scanning images was also affected by the equipment. The image quality of the images acquired via the ground-coupled antenna at a detection distance of 240 mm was poor and could not be explained either quantitatively or qualitatively. Thus, before conducting non-contact detection tests in practical situations, it is imperative that a reasonable detection distance be determined ahead of time to determine the impact of the detection distance on the imaging quality. When the detection distance was at or below 160 mm, the radar scanning images were capable of accurately describing the lining contour and the resulting measurement results exhibited good consistency with the actual situation. At a detection distance of 160 mm, obstacles, such as uneven surfaces, lighting, cables, and pipes, can be effectively avoided. Thus, the results of this study have demonstrated that it is quite feasible to analyze the lining profiles in practical engineering situations with the non-contact detection method. The model test adopted in this article considers the most common lining structure used; therefore, the experimental data and conclusions can be used as general reference in future work. For other engineering projects with special lining types, customized functions could be established according to our methods.
The detection accuracy of the lining profile was seen to decline as the detection distance increased. However, at certain distances, the magnitude of the error at most of the measurement points was close to that of the contact detection method, which can ensure the linings can be accurately detected. By establishing the functional relationship between the contact and non-contact detection values, the accuracy of the non-contact detection of the lining contour through the ground-coupled antenna was as high as 92.05% (for a detection distance of 80 mm) and 93.25% (for a detection distance of 160 mm), which indicates the potential of this method to satisfy the requirements for accuracy. Due to the continuing advancement of ground-coupled antenna manufacturing and data processing technologies, the equipment performance is expected to improve, which will further improve the detection accuracy and distance. Thus, the non-contact coupled antenna detection technique is likely to be the best option when it comes to evaluating the integrity of the lining contours in underground structures.
Conclusion
A 1:1 test model was constructed to elucidate the accuracy of the non-contact detection of the lining profile with a ground-coupled antenna. In addition, the accuracy at various detection distances was qualitatively and quantitatively analyzed. At detection distances below 80 mm, it was found that a radar scanning map with well-defined lining contours could be obtained when gain processing techniques were applied to the measurement signal. As per the test model data, when the detection distance was 0, 80, or 160 mm, the accuracy of the lining thickness detection through the ground-coupled antenna was 95.25, 88.27, or 85.35%, the accuracy of the backfill thickness detection behind the lining was 96.21, 86.45, and 83.99%, and the accuracy of the cavity thickness detection behind the lining was 95.16, 89.68, and 89.96%, respectively. In addition, when the detected values with large errors were corrected using the functional relationship between the contact and non-contact detection values, this effectively improved the detection accuracy to 92.05% at a detection distance of 160 mm. Based on the results of this study, the detection precision and non-contact detection distance were sufficient to satisfy the requirements for typical engineering applications.
Footnotes
Handling Editor: Lalit Borana
Declaration of conflicting interests
The author(s) declared no potential conflicts of interest with respect to the research, authorship, and/or publication of this article.
Funding
The author(s) disclosed receipt of the following financial support for the research, authorship, and/or publication of this article: This work is supported in part by the National Key Research and Development Program of China (grant no. 2016YFC0401801/2016YFC0401804) and the National Natural Science Foundation of China (grant no. 51709282/51879284).