
Abstract
Vehicle tracking task plays an important role on the Internet of vehicles and intelligent transportation system. Beyond the traditional Global Positioning System sensor, the image sensor can capture different kinds of vehicles, analyze their driving situation, and can interact with them. Aiming at the problem that the traditional convolutional neural network is vulnerable to background interference, this article proposes vehicle tracking method based on human attention mechanism for self-selection of deep features with an inter-channel fully connected layer. It mainly includes the following contents: (1) a fully convolutional neural network fused attention mechanism with the selection of the deep features for convolution; (2) a separation method for template and semantic background region to separate target vehicles from the background in the initial frame adaptively; (3) a two-stage method for model training using our traffic dataset. The experimental results show that the proposed method improves the tracking accuracy without an increase in tracking time. Meanwhile, it strengthens the robustness of algorithm under the condition of the complex background region. The success rate of the proposed method in overall traffic datasets is higher than Siamese network by about 10%, and the overall precision is higher than Siamese network by 8%.
Introduction
The Internet of vehicles (IOV) can improve people’s travel efficiency through urban traffic management, traffic congestion detection, path planning, road charge, and public transportation management, to alleviate traffic congestion. By the surveillance camera in the bayonet and key sections of the city, we can perform recognition and tracking of all types of vehicles. Based on the statistical analysis of the recognition and tracking results on the server, we can calculate the driving path and determine the intention of the moving vehicle. In this way, we can also analyze the real-time road conditions at the location of the sensors and then feed the results back to the user’s vehicle through a wireless sensor, guiding the next step and recommending the appropriate route. Vehicle tracking is a key technology of IOV and intelligent transportation system (ITS), in which the image sensor and wireless sensor are complementary. The accuracy and speed of vehicle tracking system directly affect the performance of IOV. In recent years, with the development of computer hardware and improving the performance of intelligent algorithms, the performance of the vehicle tracking system is also increasing. The goal of vehicle tracking task is to get the position information of the target vehicle in the first frame in a video or an image sequence. In each subsequent frame, the position of the vehicle is predicted by various operations, including the center coordinates and the width and height of the target vehicle. The difficulty of vehicle tracking is how to select effective feature extraction methods for different scenes to express the target image region, so that the tracking model can effectively learn and predict the input samples.
Since 2012, convolution neural network (CNN) has been popularized in the field of computer vision. More and more researchers in the visual field choose CNN as the main body of their algorithm. CNN compared with the traditional pattern recognition method, the biggest advantage is to save the previous heavy feature engineering process. In natural scenes, illumination and color are different. It is difficult to find a universal feature extraction method to apply to all scenes. The CNN can transform the feature of the pixel domain into the high-level abstract feature through the convolution operation of the image, and the parameters used in the extraction process can be trained and learned by a large amount of data, and the interference of human factors is eliminated.
In literatures,1–4 the authors try to use correlation filter of the target area on the feature map of the CNN. They try the different feature layers and different structure neural networks, but the accuracy of the tracking is not improved, and the time delay of each frame is greatly increased. In Nam and Han, 5 discard a large-scale CNN, considering about a simple image block, using a small network of VGG-M (only three layers of coiling layer) to extract the image blocks around the target to determine whether it is a target object. This model has a very considerable accuracy rate, but it needs to extract a large number of candidate regions around the target area for decision. Each area needs to be extracted by the neural network, and the full connection layer of the network needs to be updated online. The tracking speed can only reach 1 frames per second (FPS). In Held et al. 6 and Chen and Tao, 7 the authors use two branch neural networks to calculate the similarity between two image blocks. When tracking, the target image block in the last frame and the surrounding image block are sent to two CNNs, respectively, and then the output results are sent to the same full connection layer to judge the similarity degree of the two. This method has omitted the online update process, and after one training, the network only forecasts each frame without two training and improves the time delay and accuracy. In Tao et al. 8 and Bertinetto et al., 9 the authors use the fully convolutional neural network to measure the similarity between the two frames, which is to extract the CNNs from the two frames with the same parameters. The output results do not pass through the fully connected layer but are convoluted with each other to obtain the similarity feature map, so that the coordinates of the target rectangle frame in the entire image frame are obtained.
In this article, we propose a fully convolutional neural network combined with an attention mechanism to measure the similarity of a template and a search area using selected deep features of multiple channels. We separate template and semantics from the background area of target vehicles in the initial frame adaptively. We use a two-stage method and an analog loss function for model training. The experimental results show that the proposed method achieves ideal accuracy with a decrease in tracking time. The robustness of algorithm under the condition of complex background region has been strengthened. The proposed method in overall traffic datasets on the success rate is higher than Kernelized Correlation Filter (KCF), Discriminative Scale Space Tracking (DSST), and Siamese-FC by at most 15%; the overall precision is higher than the three methods by at most 20%.
The rest of the article is organized as follows: Section “Background and related work” introduces the traditional CNN and similarity neural networks. Section “Semantic attentional bilinear network (SAS-Net)” describes the semantic attention similarity neural network for vehicle tracking and implementation of it, including the architecture of our similarity neural network, the architecture of our attention mechanism, and an extraction method of adaptive target scale. The loss function and a two-stage training method are presented in section “Loss function and training.” Section “Experiments” compares the success rate, precisions, and speed of the proposed semantic attentional similarity network (SAS-Net) with other three methods based on the experiments on our traffic dataset. We conclude this article and discuss the next research focus in section “Conclusion and future work.”
Background and related work
Convolutional neural networks
The general CNN, as shown in Figure 1, is mainly composed of a convolution layer and a fully connected layer, usually with a down-sampling layer and an activation function layer. Each neuron in the convolution layer is connected only to the part of the previous feature map. The number of parameters is the size of the convolution kernel and the kernels are shared, which greatly reduces the weight of the convolution. If the step size increases when the convolution kernel slips on the feature map, the overlapping area of kernels and the computational complexity can be reduced. For the fully connected layer, it is to connect all the output of the upper neuron and output a one-dimensional feature vector to play a unified role in dimension. Since the full connection layer is connected to all the output of the previous layer, the number of parameters it contains is much more than the convolution layer, and there is lots of redundancy, so it needs to be used with some specific activation functions. For example, the dropout layer can inhibit neurons from propagating forward with a certain probability (usually 0.5). The down-sampling layer samples the original feature map to a smaller size without any multiplication or addition operation without any parameters. The sliding method of the lower sampling area in the lower sampling layer is the same as the method of the convolution kernel sliding in the convolution layer. When the current sampling area slides to a position, the maximum value or the average value of all the pixels in the sampled area is taken instead of the whole region. This process is separately called the maximum pooling and the average pooling process. The pooling process is the best method to reduce the amount of data of the feature map, which does not change the feature structure of the image as a whole, and can be intuitively understood as the reduction of the resolution of the feature map.
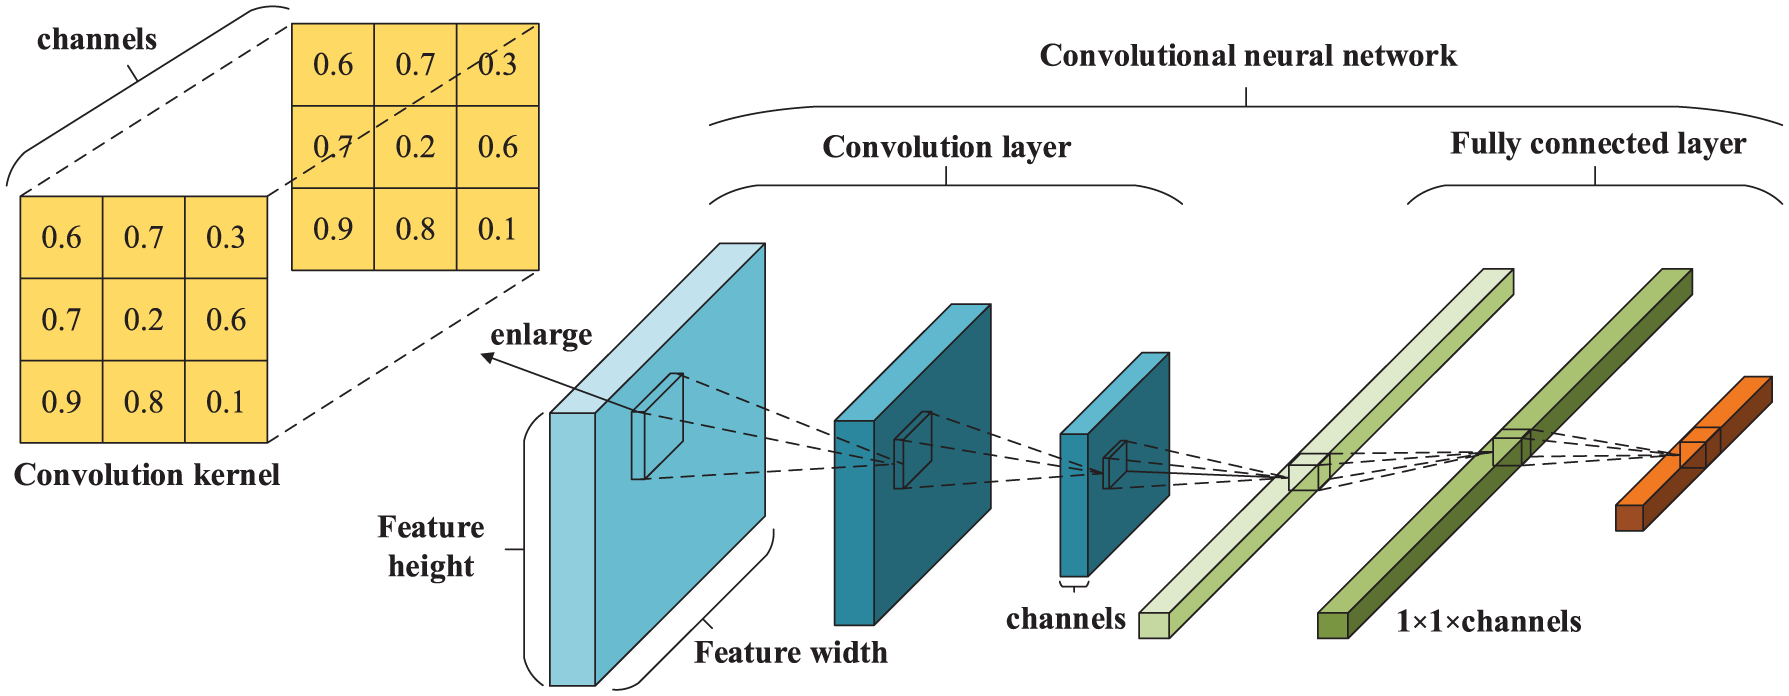
Architecture of a convolutional neural network. The general convolution neural network is mainly composed of a convolution layer and a fully connected layer, usually with a down-sampling layer and an activation function layer. Each neuron in the convolution layer is connected only to the part of the previous feature map. For the fully connected layer, it is to connect all the output of the upper neuron and output a one-dimensional feature vector.
Similarity neural network
The similarity neural network is a little different from the traditional CNN. The two image blocks, through the convolution layer and pooling layer, output the high dimensional feature maps. Then the features are input into the decision network to calculate the similarity of two image blocks. 10 The decision network is usually a fully connected neural network. The output result is a similarity value, representing the matching degree of the two image blocks. Before training, the matching degree of two image blocks needs to be labeled artificially. If the two image blocks match, the output label value is labeled as y = 1. If the two image blocks do not match, then the label of the training data is labeled as y = 0. The annotation method of training data is not a similarity value at all, but a boolean value. The loss function of the convolutional neural network is the cross-entropy between the true probability distribution of the input image and the probability distribution predicted by the network. It is the sum of the entropy of label distribution and the Kullback-Leibler (KL) divergence between label distribution and predicted distribution

It represents the information difference between two probability distributions, the greater the value, the greater the difference between the two probability distributions, which means that the two probability distributions are closer. The illustration of the bilinear similarity neural network is shown in Figure 2. The main idea is to pass the two image blocks through two branches, respectively, to input the subsequent two features into a fully connected decision network. If the two branches have completely different network structures and weight values, the feature extraction functions of the two branches are unrelated and different. The two extracted features differ in values and dimensions. When the two high-level feature maps pass through the first fully connected layer, their feature vectors are fused together. The parameters of this network are nearly twice as much as the bilinear network with shared weights. Also, it requires a greater amount of data and longer time in training, but it is more flexible.

Bilinear similarity network. The two image blocks are passed through two branches, respectively. Then the subsequent two features are input into a fully connected decision network.
Figure 3 shows the illustration of the dual channel similarity neural network. The two image blocks are superimposed as the input. They share both the weights and feature maps during forwarding propagation. The scale of the model is greatly reduced.
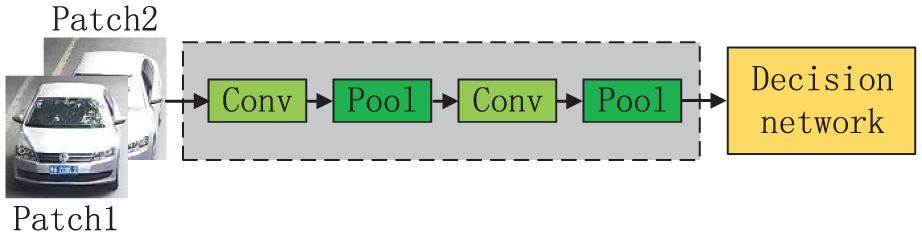
Double channel bilinear network. The two image blocks are superimposed as the input. They share both the weights and feature maps during forwarding propagation.
For a long time, there are many algorithms using similarity neural network before the vehicle tracking task. As early as 2005, Chopra et al. 11 used a bilinear structure to measure the face similarity. Lin et al. 12 used a similar bilinear structure in fine-grained bird classifications, which locates the object by one branch and extracts the features by the other branch. Bertinetto et al. 9 use the full convolutional Siamese network to search the closet area to the original target in the surrounding area of the target object, and the online learning is not needed in this process.
Semantic attentional bilinear network (SAS-Net)
In recent years, visual attention mechanism13–21 is one of the most popular research hotspots on visual images. The models based on CNN and recurrent neural network (RNN) are widely used in various types of visual tasks, such as target recognition, fine-grained classification, image segmentation, image caption, and visual question answering (VQA). In these tasks, common usage of attention mechanisms is to extract features from text or images and embed them into another CNN to achieve information fusion. The advantage of the attention mechanism is its ability to predict the weight vector for feature maps by model learning.
A typical example is in Seo et al., 16 they fused the digit and their color feature vectors in the image. This enabled the network to predict the color of the digit while focusing on the location of the digit. Inspired by this model, the tracking model of fully convolutional neural network embedded by an inter-channel visual attention mechanism is proposed in this article. With the target area combined with its background pixels as the semantic input in the first frame, the model can selectively predict the channel weights of convoluted template features and search area features according to feature maps of different channels. The weights are embedded into the corresponding channels of convoluted features to enhance or weaken the features of some channels.
In the CNN, the high-level features of semantics are robust to the changes of the target appearance, which improves the discriminative power and enhances the generalization ability of the model. In order to make the model more discriminant, we use the inter-channel attention mechanism. Intuitively, the contributions of each channel to the predicted similarity value are different. For the vehicle tracking task, the features of some channels seem to be more important and the others may have no significant impact on the predicted results. If the model can calculate the similarity according to features of different channels selectively, it will improve the performance of the model for vehicle tracking task.
Architecture of SAS-Net
The structure of proposed SAS-Net is shown in Figure 4. Unlike previous networks that require a fixed size image as input, a template Z based on the adaptive length-width ratio is used as a vehicle sample, in order to make the background information in vehicle features as little as possible. When a video captured by an image sensor, the image patch of the vehicle in the first frame is extracted. Its long side is resized to 127 pixels, and the whole vehicle patch is resized according to the same ratio as an exemplary image.

Architecture of SAS-Net. The exemplar Z, the semantics
The template in the first frame surrounded by the background pixels is extracted as a square patch. Then it is resized to size
The final similarity response map is output by mapping all the values of the similarity response to 0 to 1 through the sigmoid function. The whole process can be expressed in formula (2), where

Architecture of our bilinear network
The illustration of bilinear network structure is shown in Figure 5. The kernel size of each layer is similar to the AlexNet, 22 the difference is that the fully convolutional structure is adopted in the network, and the fully connected layer is not included. The bilinear network is composed of layers of conv1, pool1, conv2, pool2, conv3, conv4, conv5. The rectified linear unit (RELU) is used after each convolution layer.
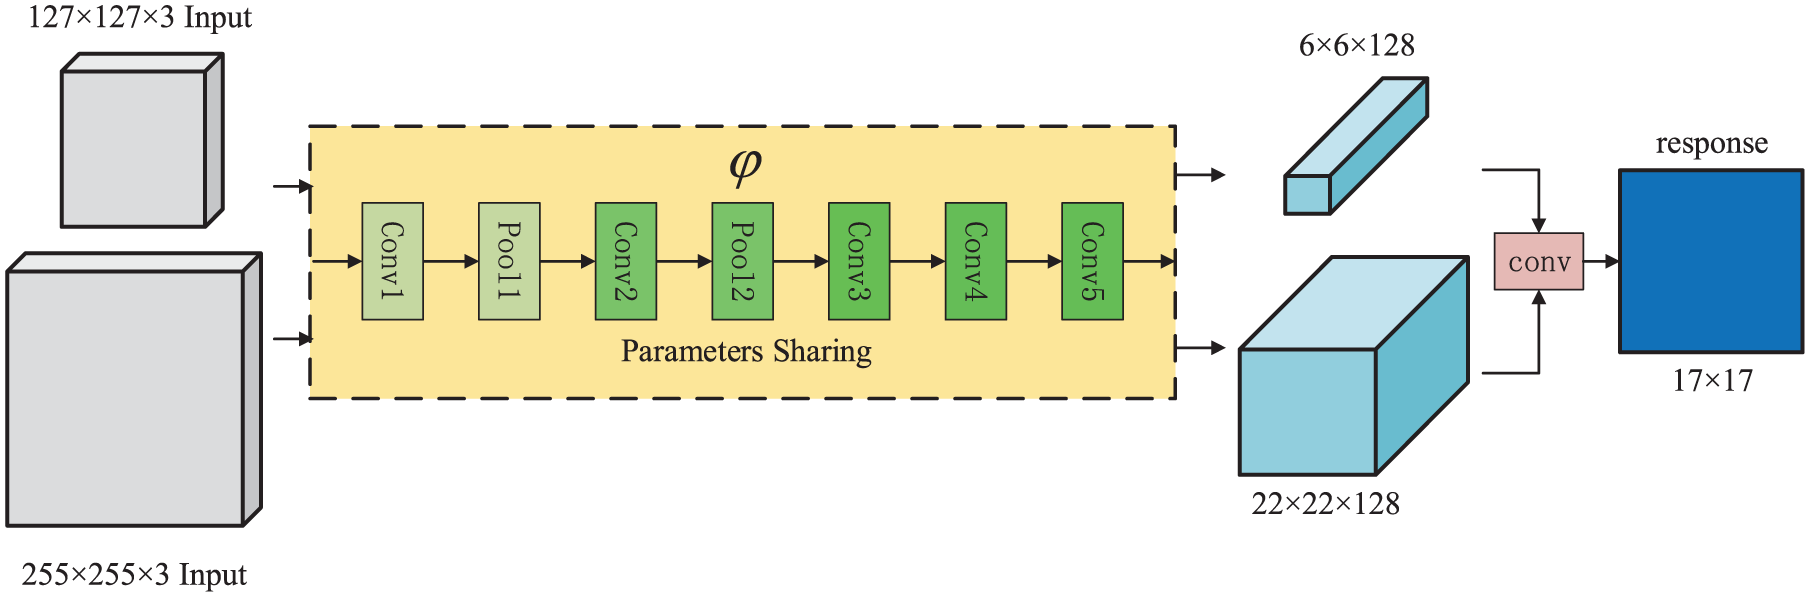
Bilinear network with parameters sharing. The two input with size of
Parameters and feature dimensions of SAS-Net.

SAS-Net: semantic attentional similarity network.
When the sizes of the input image patches are

The AlexNet does three times down-sampling operation with a stride of 2, apart from once convolution with a stride of 4. The overall scale is reduced by 31 times compared to the input image. The * in the table indicates that the scale of the image or feature map is freely adaptive in this dimension.
Because the ratio of the length to width is kept during interpolation and the length of the long side is resized to 127 pixels, the length of the short side is adapt111e. During forward propagation of input exemplar, the output feature map size is computed according to the input feature size as follows

In the formula above,
After the upsampling with step stride of 16, the range of the * side of response for positioning changes to
Architecture of inter-channel attention mechanism
The internal structure of the attention mechanism depicted in Figure 6 is the attention model in the main system model shown in Figure 4. The input is the semantic feature
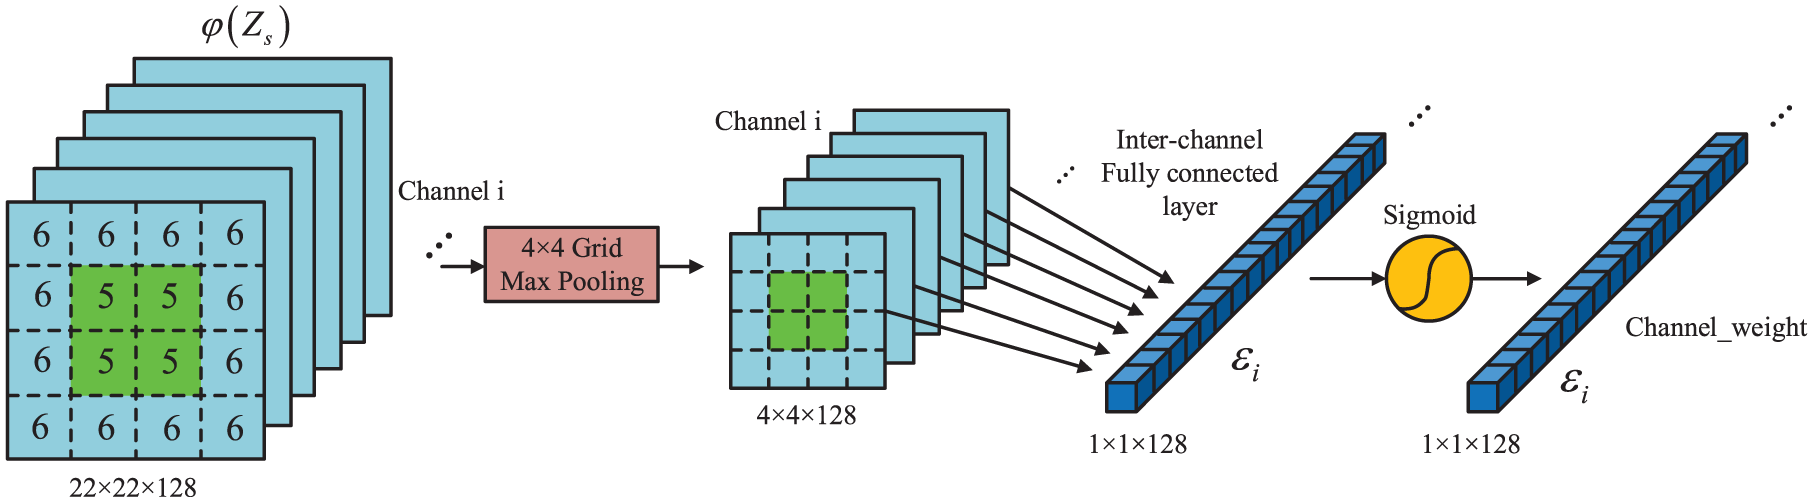
Inter-channel attention mechanism. The details of the attention model in Figure 5 are shown in this figure. The input is the semantic features obtained by bilinear networks. Through a process of the
The four grids in the central area are
Extraction method of adaptive target scale
In this article, a target template extraction method based on the adaptive target size is proposed to break the rule that the network input should be fixed size. To follow the target object, the target features can be adaptively changed, so the influence of the background to the target template can be reduced down to the lowest. Figure 7 shows a sample template without background area and the search area with the background filled around. The target box is directly used as the sample template with its long side interpolated to 127-pixel length. The scaling ratio of this procedure is calculated for interpolation of the short side at the same time.

Adaptive sample template and search area. The long side of the target will be resized to 127; the searching area will be resized to
In this way, the input of the network is no longer in a fixed size, but a rectangle with arbitrary aspect ratio. It is flexible for the network to adapt to various scales of the target vehicles, whether it is a moving motorcycle with larger aspect ratio or a driving car with relatively smaller aspect ratio. After determining the size of the sample template, a square search area is taken with the long side of target padded with a long side. The long edge of the rectangular target box is filled two times as long as before, and the short side is padded with more pixels from the background. Thus, when the search area is adjusted to 255 × 255 pixels, it can have the same scaling ratio with the target box and the sample template in the first frame.
Figure 8 is shown as the first eight layer feature maps of the exemplary feature

The first 8 layer feature maps of sample template and search area. The response of each channel feature to the target object is different. The convolution operation will pay more attention to the influence of the target object itself.
The channels that have a strong response of the target vehicles should be considered, and the channels which are not sensitive enough to the target object should be weakened. The attention mechanism is able to learn the importance of different channels effectively, make the model focus on the specific channels, and increase effective calculation model. Based on the fact that different feature map channels have different importance, the fully convolutional neural network combined with a visual attention mechanism is proposed for tracking. The network can select different features according to the weight of features among multiple channels from the semantic patches of the input image.
Loss function and training
The parameters of our inter-channel attention–based fully convolutional neural tracking model are mainly divided into two parts: one part is the parameters of the convolution kernels of the fully convolutional layer in the shared bilinear network and the other part is the parameters involved in the inter-channel fully connected layer in the visual attention mechanism. Therefore, a two-stage method for training our model is adopted. First, we use a large public dataset to pre-train bilinear network, making the bilinear part achieve an optimal result on this dataset. Then, we use our traffic dataset to train the visual attention network, while fine-tuning the parameters of the bilinear network. A large learning rate is used for the attention mechanism, and a lower learning rate is used for the bilinear network. At the same time, the parameters of the whole model are optimized jointly.
According to the section “Similarity neural network,” the method of labeling the similarity of two image blocks with binary value 0 and 1 is too “absolute.” In this way, the intermediate state is never involved. The judgment of the similarity should be an analog process, but the 0-1 annotations digitize the probability distribution. This will inevitably result in the loss of information. In the proposed method, we use an analog tagging method to train the network and finally achieve good results.
When the bilinear network is trained in the first stage, the network input is the image patch pair

Similarity response and two-dimensional label. Different from traditional binary labels to each pixel, an analog label method is applied.
The extracted image pair

where

where
During training, the batch gradient descent (BGD) is used to optimize the parameters of the bilinear part, and the whole process can be written as an optimization function

where
This article chooses to use the public dataset based on ImageNet Large Scale Visual Recognition Challenge (ILSVRC) for pre-training bilinear network to prevent the overfitting problem of the model in the pre-training stage. The dataset contains about 4500 video sequences and 30 different vehicles and animals. Compared to other datasets, the target species and the number of video sequences in the dataset satisfy the requirements of proposed network in this article.
After the pre-training stage of our bilinear network is completed using the ILSVRC dataset, the traffic dataset in this article is used to train the visual attention mechanism and fine-tune the parameters in the bilinear network. The traffic dataset consists of 40 video sequences, which contain crossroads, bus stations, and other densely populated scenes. The targets in the video are mainly traffic participants, such as vehicles, bicycles, and pedestrians. Figure 10 shows the sample template, the semantic information, and the search area extraction method under the traffic dataset of our laboratory. The rectangular box of sample template tightly encapsulates the target vehicle, the semantic feature of the background area, and the feature of the search area extracted around the rectangular target box in the process of tracking. All of them are interpolated according to the target scale. Sample template and semantic information are extracted from the initial frame of the video, and the search area is extracted in each subsequent frame. When the sample template is input into the network, it is adjusted to

Exemplar, semantics, instance, and response map from traffic dataset. The rectangular box of sample template tightly encapsulates the target vehicle, the semantic feature of the background area, and the feature of the search area extracted around the rectangular target box in the process of tracking. All of them are interpolated according to the target scale: (a) exemplar, semantics, instance, and response map of a turning red car and (b) exemplar, semantics, instance, and response map of a straight white car.
In the second stage of joint training, the loss function at the location

where

where
In the second training stage, we use the RMSprop method to optimize the network parameters

The entire network uses different initial learning rates for
There is no difference between the forward propagation of the network in the test tracking stage and the training stage. The sample feature
Experiments
The experimental environment for this article is as follows: CPU Intel core i7-4790 3.6 GHz; memory 16 GB, GPU NVIDIA Quadro K2200, which contains 640 Compute Unified Device Architecture computing core units and 4 GB graphics memory. The simulation software is MATLAB R2017a, and the program is written mainly based on the deep learning framework Matconvnet for MATLAB. The evaluation video data are provided by the intelligent traffic big data project of our laboratory. Forty video sequences are truncated, and the lengths of the truncated videos are not equal. The frame rate of these videos is 25 FPS, and the resolution is

Overlap ratio curves of several video sequences. Overlap ratio is the ratio of the overlapping area to the merging area between predicted box and ground-truth box: (a) overlap ratio curves of sequence 1, (b) overlap ratio curves of sequence 4, (c) overlap ratio curves of sequence 5, (d) overlap ratio curves of sequence 7, and (e) overlap ratio curves of sequence 8.
Figure 11 shows overlap ratio curve of each frame in sequence 1, sequence 4, sequence 5, sequence 7, and sequence 8 in our traffic dataset. In sequence 1, the Siamese network completely loses tracking of the target vehicle at about 20 frames because of occlusion or background interference, while SAS-Net performs well. The overall overlap ratio curve has been higher than the curves of the other three methods. In sequence 4, SAS-Net and DSST have a fairly high overlap ratio. Both the overlap ratio curves show that the overall overlap ratio between the predicted rectangular box and the real vehicle rectangular box is higher than Siamese when the SAS-Net is tracking. Only the overlap ratio of several frames is lower than the Siamese network. In sequence 5, before the 150 frames, the overlap ratio of SAS-Net is only inferior to that of KCF. After 150 frames, the overlap ratio of SAS-Net is higher than them of the other three methods. In sequence 7, the overlap ratio of SAS-Net is higher than KCF and DSST; it is also higher than Siamese after 80 frames. The overlap ratio of SAS-Net in sequence 8 is higher than that of other three methods.
Figure 12 shows the success rate and the thresholds of overlap ratio in 20 sequences of SAS-Net, Siamese, KCF, and DSST. The success rate is defined as the ratio of the success number to the total number of frames in all videos. The success number is the sum of success frames where the overlap ratio between the predicted box and the ground-truth box is higher than a certain threshold. Overlap ratio is the ratio of the overlapping area to the merging area between two rectangular boxes. It can be seen from the figure that the success rate of SAS-Net tracking is higher than that of other three methods under most overlap ratio thresholds.

Success rate with the overlap ratio threshold curve. The success rate is defined as the ratio of the success number to the total number of frames in all videos. The success number is the sum of success frames where the overlap ratio between the predicted box and the ground-truth box is higher than a certain threshold.
Figure 13 shows the precisions with distance threshold curves of SAS-Net, Siamese, and correlation filters methods of KCF and DSST in the 20 sequences. The meaning of the points on the curve is the ratio of the number of accurate frame number to the number of all testing video frames. The accurate frame is a frame where the distance between a predicted rectangular box and a ground-truth box is lower than a certain distance threshold on the abscissa axis. The distance is calculated by the Euclidean distance between the two central points of two rectangular boxes. As can be seen from the figure, the precision of SAS-Net is much higher than the other three methods when the distance threshold is below 30. When the distance threshold is higher than 30, the precision of SAS-Net is not the same as that of the DSST method and is still much higher than the KCF and Siamese methods by 10%. Compared with the Siamese network, the SAS-Net has greatly improved its performance.

Precisions with the distance threshold curve. The points on the curve are the ratio of the number of accurate frame number to the number of all testing video frames. The accurate frame is a frame where the distance between a predicted rectangular box and a ground-truth box is lower than a certain distance threshold on the abscissa axis.
Figure 14 shows the tracking results of SAS-Net, Siamese, KCF, and DSST in several key frames of our traffic video sequences. It can be seen from the figure that when the target vehicle is far away from the camera, the sensor cannot capture the features of the vehicle better. This will lead to the drift of the model so that the KCF fails to follow the target vehicle. Compared with several other methods, the Siamese method has a poor tracking result when the target vehicle is in a complex background area. The main reason is that the deep features of the surrounding vehicles are too similar to the deep features of the target vehicles, but the influence of surrounding background information to the model is not considered when the sample template is extracted. In this article, the SAS-Net method effectively filters the deep features at different channels through the attention mechanism. It multiplies each channel by different coefficients according to the importance of different channels. The vehicles are no longer disturbed by the background area and the occluded vehicles. Our model has achieved good results compared with other methods.

Tracking results on key frames in part of video sequences. When the target vehicle is far away from the camera, the KCF method cannot capture the features of the vehicle better. The Siamese method has a poor tracking result when the target vehicle is in a complex background area. Our SAS-Net has achieved good results compared with other methods.
Table 2 shows a contrast between SAS-Net and Siamese networks, KCF, and DSST. Evidently, the average processing speed of the Siamese network on 20 video sequences is 22.98 FPS, while the average processing speed of the SAS-Net on the 20 video sequences is 28.51 FPS, slightly faster than the Siamese network. This is mainly due to the variable scale sample template adopted in this article. The number of convolution features calculated by similarity measurement is greatly reduced, so the speed is improved when the last two features are convoluted. The speed of the SAS-Net is also faster than DSST by over 10 FPS. This is because the DSST method also trains a scale filter online while updating the location filter and extracts the target features of about 30 times when testing and updating. Without the support of the GPU lab environment, this process is time-consuming. However, SAS-Net only needs to extract the features of three times in the calculation and can achieve the desired speed with the support of Matconvnet framework. So the two methods also apply to different scenarios. Table 3 exactly shows the comparison on time for the convolution of sample template feature
FPS of SAS-Net compared with other methods.

FPS: frames per second; KCF: Kernelized Correlation filter; DSST: Discriminative Scale Space Tracking; SAS-Net: semantic attentional similarity network.
The significance for bold values are the performance of the proposed method.
Comparison of consumption time for feature convolution.

SAS-Net: semantic attentional similarity network.
The significance for bold values are the performance of the proposed method.
Conclusion and future work
In this article, we focus on the vehicle tracking task for IOV and propose the SAS-Net model which combines the bilinear network with a visual attention mechanism, making the model select the features from different channels according to different impacts of features from semantic areas. The model makes the vehicle no longer disturbed by the background area and the occluded vehicles and has obtained good results compared with other methods. The success rate of SAS-Net tracking is higher than that of KCF, DSST, and Siamese-FC under most overlapping rate thresholds. The precision of SAS-Net is much higher than the other three methods when the distance threshold is below 30. Our SAS-Net achieves a real-time tracking speed. If there is more hardware support, this model can be applied to large-scale intelligent IOV system to assist all the connected vehicles to make a good travel plan.
In the future research work, the joint vehicle tracking method based on the multi-image sensor will be brilliant. In the IOV system, interaction and fusion of information generated by different sensors among different vehicles are inevitable. In the combination of multi-sensors, how to fuse the multimodal data from various kinds of sensors, such as image sensors and wireless sensors, will be a long-term research goal. Deep neural networks still have great potential in these fields. Designing different kinds of neural networks for these multimodal data can achieve the fusion of different sensor information.
Footnotes
Acknowledgements
The authors would like to thank anonymous reviewers for their valuable comments and suggestions.
Handling Editor: Razi Iqbal
Declaration of conflicting interests
The author(s) declared no potential conflicts of interest with respect to the research, authorship, and/or publication of this article.
Funding
The author(s) disclosed receipt of the following financial support for the research, authorship, and/or publication of this article: This work was supported by the National Natural Science Foundation of China under grant (no. 61772387 and no. 61802296), Fundamental Research Funds of Ministry of Education and China Mobile (MCM20170202), China Postdoctoral Science Foundation Grant (no. 2017M620438), the Fundamental Research Funds for the Central Universities, and supported by ISN State Key Laboratory.