
Abstract
Due to the increasing arriving rate and complex relationship of behavior data streams, how to detect sequential behavior anomaly in an efficient and accurate manner has become an emerging challenge. However, most of the existing literature simply calculates the anomaly score for segmented sequence, and there is limited work going deep to investigate data stream segment and structural relationship. Moreover, existing studies cannot meet efficiency requirements because of large number of projected subsequences. In this article, we propose EADetection, an efficient and accurate sequential behavior anomaly detection approach over data streams. EADetection adopts time interval and fuzzy logic–based correlation to segment event stream adaptively based on rolling window. Through dynamic projection space–based fast pruning, large number of repeated patterns are reduced to improve detection efficiency. Meanwhile, EADetection calculates the anomaly score by top-k pattern–based abnormal scoring based on directed loop graph–based storage strategy, which ensures the accuracy of detection. Specially, we design and implement a streaming anomaly detection system based on EADetection to perform real-time detection. Extensive experiments confirm that EADetection can achieve real time and improve accuracy, significantly reduces latency by 36.8% and reduces false positive rate by 6.4% compared with existing approach.
Introduction
Sequential behavior data streams occur in a wide variety of applications, such as system call logs in a computer, operational logs of an aircraft flight, and alerts of intrusion detection system. Anomaly detection in such data streams has attracted considerable attention because of the potential harm caused by abnormal behaviors. 1 For instance, more than three-quarters of government agencies are more focused on combating insider threats by user behavior anomaly detection.2,3 In order to reduce harm, user behavior anomaly detection required to be efficient and accurate. First, it is quite necessary to achieve real-time data processing to keep the capacity of continuous detection. The large gap between data processing rate and arriving rate makes anomaly detection less meaningful. 4 Second, it has to be accurate to find and prevent abnormal behaviors. False positives or false negatives may lead to large resource waste. 5
These two requirements post emerging challenges to sequential behavior anomaly detection over data streams. (1) Events data stream usually arrives with high rate. For instance, the intrusion detection systems employed in a real-world network generates more than 9 million alerts per day. 6 The detection approach must be able to support such high arriving rate of live event data. (2) In continuously collected event stream, windows-based data processing is widely used. As there is no exact boundary to distinguish different behaviors, it is hard to fully reconstruct user behavior scene. 7 The key is to keep complex events correlation in behaviors through stream segment strategy and pattern abstraction. (3) As an event data stream is an unbounded sequence, the size of historical knowledge increases with event arriving, which occupies lots of memory and slows down the detection efficiency. The key is to design proper data structure to store historical knowledge for highly efficient anomaly detection.
Generally, sequential behavior anomaly detection consists of two stages: 8 (1) to establish patterns of behaviors and (2) to determine whether a behavior is abnormal based on the patterns. To establish a more efficient pattern, Hidden Markov Model,9,10 data mining,11,12 neural network, 13 clustering, 14 and some others have been adopted to anomaly detection research. However, most of them build lots of redundancy patterns by scanning the data stream repeatedly, which brings either computational complexity or high memory overhead to cause real-time problem. Meanwhile, these methods take less account of the features of user behaviors, which directly affects the accuracy of pattern construction.
To determine whether a behavior is abnormal, existing studies quantify detection results with statistical or probabilistic methods by comparing with the normal pattern. Similarly, there are many algorithms, such as Bayesian reference, 15 edit distance, 16 Markov transfer, 10 fuzzy logic, 17 and kernel. 18 Note that the storage structure of patterns makes a significant impact on the performance of the detection algorithms. Existing major storage structure is the tree and there are two limitations: 19 (1) large number of overlapping subtrees, which occupy enormous memory, and (2) complex traversal depth and breadth, which spend too much time to generate and traverse the tree.
Besides, the existing anomaly detection systems place more emphasis on the data processing module.20,21 There is almost no anomaly detection systems, which are energy data collection, data distribution, data processing and data storage as a whole, which leads to a confused situation for streaming anomaly detection. And it is very inconvenient for research and practical application. Hence, it is necessary to build a high-efficiency streaming anomaly detection system (SADS).
To address these challenges, we propose EADetection, an efficient and accurate sequential behavior anomaly detection approach over data streams. Specially, we mainly focus on three problems: (1) How to mine representative patterns from events stream to characterize behavior? (2) How to calculate the anomaly score for detected sequence? (3) How to design a high-efficiency streaming anomaly detection platform? Generally speaking, we provide the following contributions:
To realize the adaptive segment of user behavior sequence, EADetection adopts time correlation and fuzzy logic to define events association intensity, which keeps the behavior correlation based on rolling window. Through dynamic projection space–based fast pruning, large number of repeated patterns is reduced to improve the detection efficiency.
EADetection adopts the directed loop graph–based storage strategy to store the structural relationship of historical pattern and calculates the anomaly score by Bayesian network after top-k pattern collision test, which ensures the accuracy of detection.
We further design and implement a SADS based on EADetection to perform real-time detection. To improve stability and scalability, we adopt autocorrelation for modules to simplify configuration and topology mapping to achieve rapid deployment.
We conduct extensive experiments over uncertain behavior streams, which are based on SADS in the real deployment, to verify the high efficiency and accuracy of EADection under different parameter settings.
The remainder of this article is organized as follows: Section “Overview of EADetection” presents some definition and the workflow of EADetection. In sections “Construction of Sequential Pattern” and “Real-time Anomaly Detection,” we put forward EADetection algorithm in detail, including rolling windows–based adaptive segment, projection space–based fast pruning, directed loop graph–based pattern storage and top-k pattern–based abnormal scoring. Section “SADS” presents SADS, which includes the introduction of architecture and some optimizations. Evaluation results will be shown in section “Evaluation.” Finally, we provide our key conclusions and future directions in the last section of this article.
Overview of EADetection
In an unbounded sequential behavior data stream
Definition 1 (Behavior). The behavior is defined as a subset of S with strong structural relationship:
Definition 2 (Sequence). The behavior is defined as sequential subset of S:
Definition 3 (Correlation). Let
Definition 4 (Pattern). The pattern P of behavior B is defined as
Definition 5 (rolling window). As shown in Figure 1, rolling window is a subset of unbounded data stream. Once the segment condition is triggered, all the data in the window are popped for further processing.

An example of rolling window.
As there is no exact boundaries for behaviors in event stream, we segment the stream into sequences while keeping the behavior correlation. Then, we mine patterns from sequences to characterize behavior for further processing. We illustrate the workflow and dataflow of EADetecion in Figure 2. The above-described process can be divided into two stages: construction of sequential pattern and real-time anomaly detection. In the construction phase of sequential pattern, EADetecion adopts rolling windows–based adaptive segment strategy to transform stream into sequences, which is based on the intensity of behavior correlation defined by time interval and fuzzy logic. Then, we use dynamic projection space based fast pruning algorithm to train the sequences to develop a pattern library, which is used to characterize the behaviors. The algorithm considers the randomness and repeatability of behaviors to achieve the self-adaption of behaviors. Meanwhile, it constantly prunes projected subsequences to achieve real-time sequence mining.

The overview of EADetection.
For real-time anomaly detection, we propose top-k pattern–based abnormal scoring based on a directed loop graph–based pattern storage structure called DLGPStructure. The DLGPStructure preserves the structural relationship to guarantee the accuracy and reduce false positive rate (FPR). Moreover, the algorithm reduces the traversal level by top-k strategy to improve the efficiency.
Construction of sequential pattern
Rolling windows–based adaptive segment
EADetection maintains a rolling window for each user to establish sequences. The popping condition of rolling window is given based on the intensity of behavior correlation, which is defined by time interval and fuzzy logic. The time interval refers to the time difference of arrival between adjacent data, which is inversely related to behavior correlation. Moreover, we present fuzzy logic based on correlation to adapt behaviors with uncertain processing time, which maintains the specific two data and the measure value of their occurrences. The stream is self-adaptively segmented into sequences by these two indicators.
Time interval–based correlation
Time interval–based correlation (TIBC) is calculated based on the assumption that the correlation intensity has an inverse relationship with the length of time interval. If the time interval of two events is beyond a given threshold, then we believe that the correlation of the two events is weak, which means the possibility that they belong to the same behavior is low. With arriving events stream, the TIBC of the current event

where
Fuzzy logic–based correlation
Fuzzy logic is employed to handle the concept of partial truth, where the truth value may range between completely true and completely false.
22
It is important and useful to employ the fuzzy logic sets in uncertain scenarios.23,24 Motivated by this, we proposed fuzzy logic–based correlation to handle the complex behavior with long processing time. Each user is bounded with a fuzzy logic set, called fuzzyLib, which is used to store the event pairs with different levels of correlation. For arriving events with low TIBC, we put the last event of the rolling window

As shown in equation (2), if it is the first time the event pair appears in the rolling window, the weight is initialized with a constant
As shown in Algorithm 1, for arriving event

Projection space–based fast pruning
EADetecion adopts patterns with high support degree to characterize segmented sequences. The number of projection space is the key factor, which influences the pattern mining efficiency. Therefore, projection space–based fast pruning strategy removes duplicate projected subsequences and merges high similar ones to avoid bottleneck caused by repeated mining.
Different from traditional frequent pattern mining,
25
events sequences here are approximations to behaviors and do not have exact boundaries. Therefore, it is not necessary to keep the intermediate subsequences contained by other sequences. Figure 3 shows a pattern mining example with prefix a in event stream

An example of pattern mining.
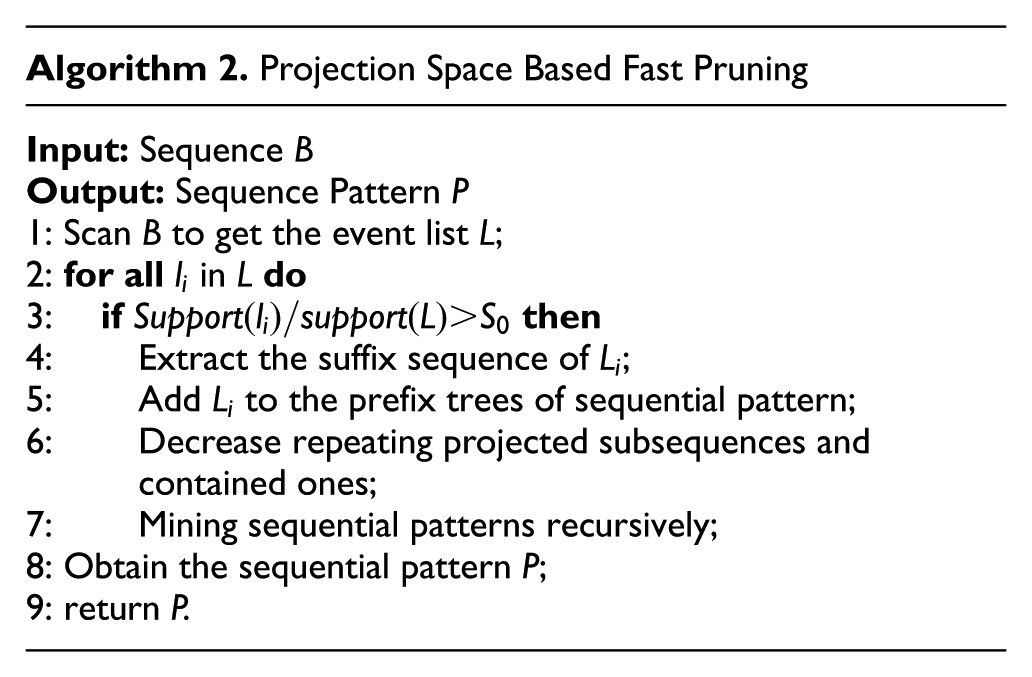
As shown in Algorithm 2, after obtaining the event list by scanning the sequence, prefix trees with high support degree are added into the projection space. Then, we decrease projected subsequences and merge high similar ones to obtain the sequential pattern during the sequence mining. It resches the next mining iteration after that.
Real-time anomaly detection
Directed loop graph–based pattern storage
As the structure of pattern storage has a direct impact on real time and accuracy, we analyze the features of sequences to propose directed loop graph–based pattern storage structure, called


As shown in equations (3) and (4),
Figure 4 shows a brief comparison between tree and

A brief comparison.
Top-k pattern–based abnormal scoring
In this section, we propose top-k pattern–based abnormal scoring, to obtain real-time detection results with high accuracy.
Let

Note that the weaker the correlation between

As shown in equation (6),
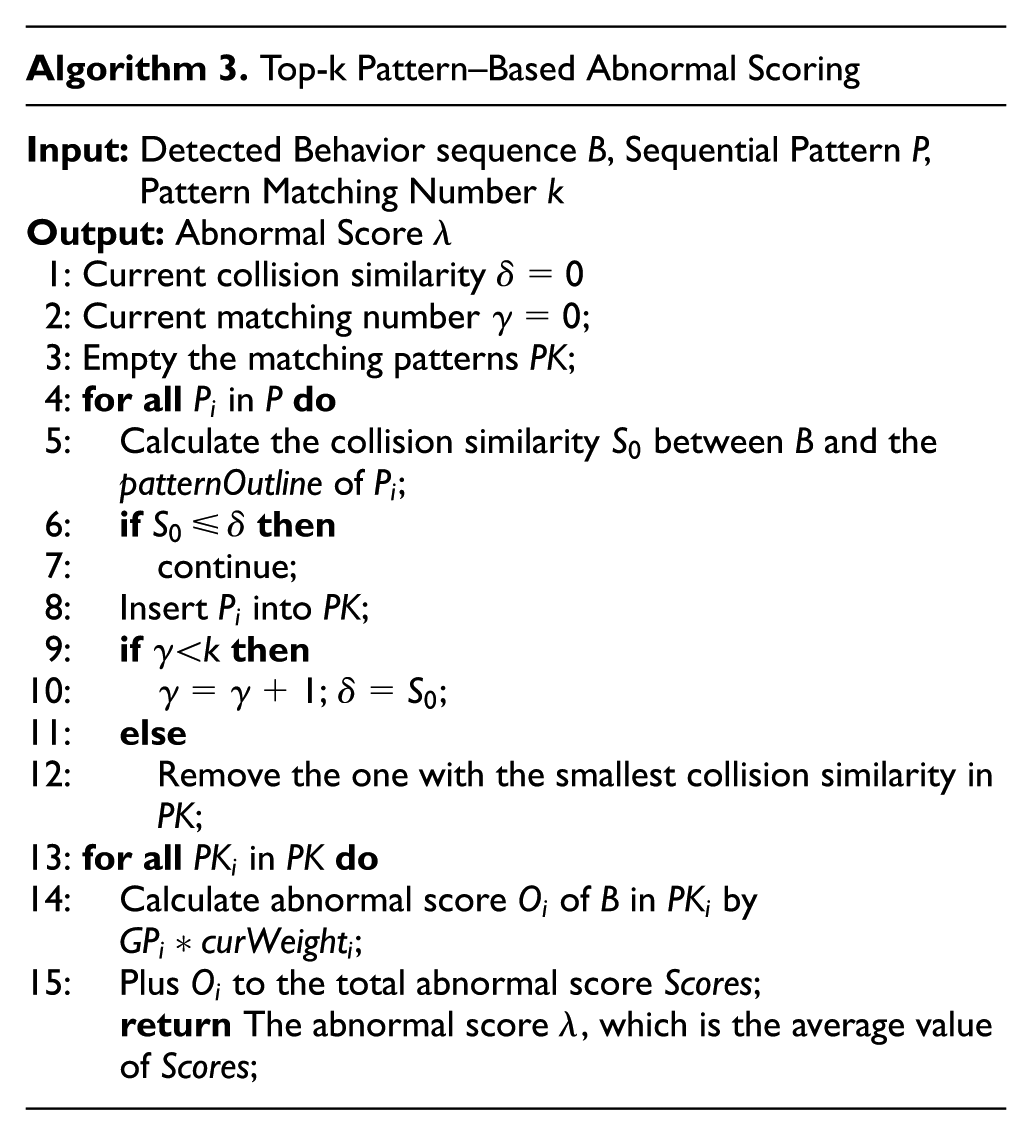
As shown in Algorithm 3, we acquire the top-k patterns by crash tests. First, we calculate the collision similarity
SADS
Architecture of SADS
To perform real-time detection, we design and implement the SADS. Taking account of the flexibility, stability and scalability of SADS, we adopt hierarchical design thought to decouple the service modules of anomaly detection over data streams. 26 And the overall structure is summarized in Figure 5.
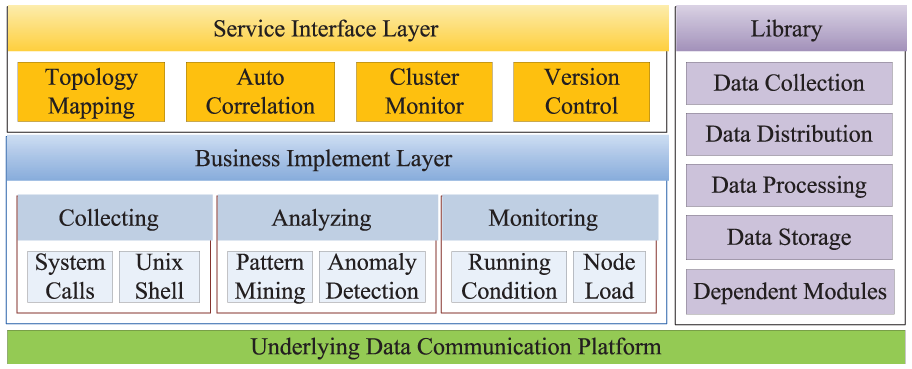
Architecture of SADS.
As shown in Figure 5, there are several layers and modules in the framework. The bottom is the fundamental communication platform, which is mainly responsible for the communication of the nodes involved in the process of anomaly detection. The upper layer, business implement layer, is the module for the input and management of data streams, which mainly consists of three submodules: (1) collecting module, which is mainly responsible for collecting real-time data stream, such as system calls and unix shell commands; (2) analyzing module, which mainly includes the work of sequence mining and anomaly detection and (3) monitoring module, which mainly provides data support for optimization strategy, such as running condition and node load.
As the interaction layer, service interface layer mainly provides a series of interfaces for users to interact with the system, which includes (1) the topology design, which maps the physical cluster into topology to achieve rapid deployment; (2) the autocorrelation, which achieves the automatic configuration and dynamic distribution of nodes; (3) the cluster monitor, which mainly reflects the cluster state and (4) the version control, which is mainly responsible for updating the library.
Implementation of EADetection on SADS
In this section, we implement EADetection in real cluster environment to achieve real-time collection, monitoring and analysis for anomaly detection based on SADS. And the process is shown in Figure 6.
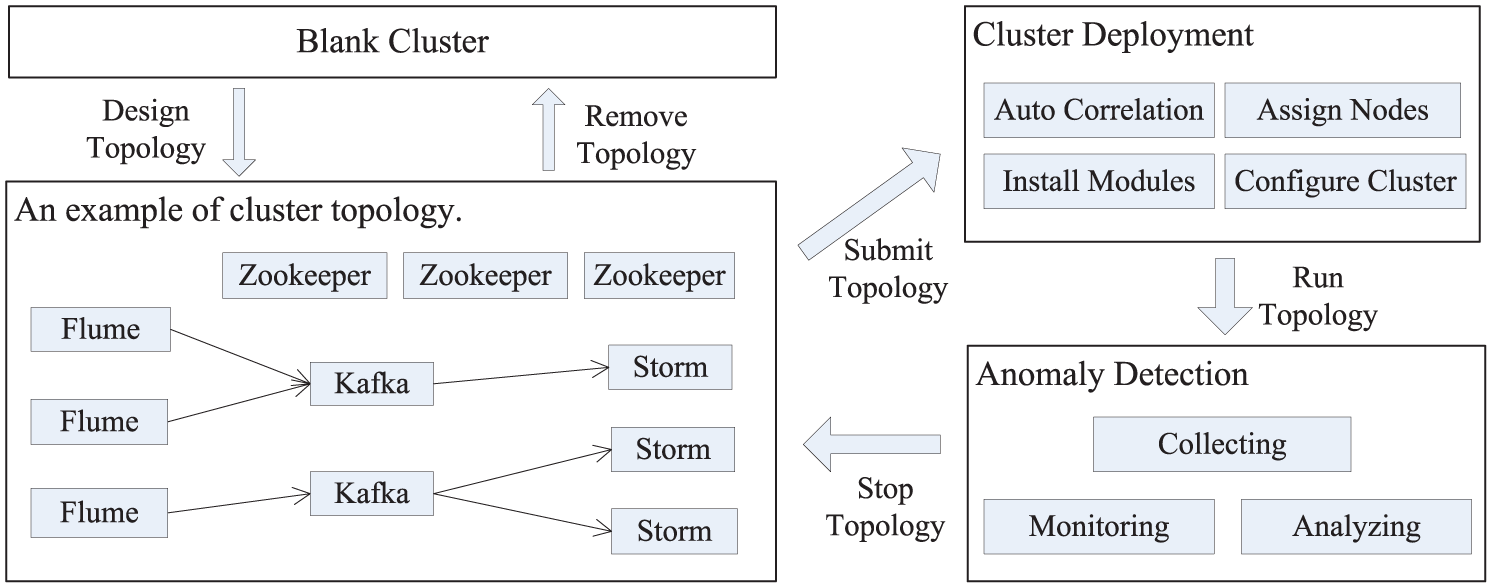
Implementation of EADetection on SADS.
First, we design and submit a topology with the dashboard provided by SADS for cluster deployment, and an example is given in Figure 6. Then, SADS analyzes the submitted topology to deploy the cluster, which includes (1) assigning modules to nodes, (2) installing modules and (3) configuring the cluster. Finally, we run the topology to implement EADetection in real deployment environment for anomaly detection, which includes collecting, monitoring and analyzing.
Note that the communication between modules of conventional deployment requires additional process of complex configuration, which restricts the scalability of deploying. Moreover, the artificial assignment easily leads to the node overload without understanding the status of nodes, which affects the stability of analyzing and may result in the failure of anomaly detection. To solve these problems, we propose the technique of autocorrelation, which dynamically assigns modules to nodes and automatically configures relevant modules based on real-time cluster status. Meanwhile, the traditional cluster deployment for anomaly detection results in lots of repeating work when installing different modules in different nodes by artificial distribution, which restricts the flexibility of system. Thus, we propose the technique of topology mapping to achieve rapid deployment, which improves the flexibility of deploying.
Autocorrelation
Let

Autocorrelation effectively simplifies the configuration of modules, which refrains from inflexibility caused by artificial assignment. Meanwhile, the dynamic allocation mechanism by ranking effectively improves the scalability of system. Specially, the sufficient measure for load capacity of nodes avoids node overload to achieve load balance.
Topology mapping
SADS provides the online method for designing topology visually based on workflow, which makes design effort convenient and effective. During the process of installing modules, SADS deploys the cluster by analyzing the submitted topology in the absence of human intervention. Namely, SADS realizes the mapping between cluster topology and physical nodes to abstract cluster into topology, which makes the cases of nodes transparent to users.
Topology mapping reduces lots of repetitive work, such as different deployment for each node. Specially, it avoids the man-made faults caused by the frequent switch of mainframe during the installation and configuration. Hence, topology mapping can achieve rapid deployment and improve the flexibility, which allows developers and researchers focusing on the application logic.
Optimizations and discussions
According to the above introduction of SADS, we can see that there are still some open problems need to be further considered and solved, which are also the directions of our current and future work.
Stability analysis. The main parameters of SADS are the weights of all modules. The weights vary in different application scenarios. Here, for simplicity and generality, we set the weight w = 1 for each module. Currently, we are working on the strategy of self-adaptive weight assignment based on the CPU memory utilization.
Communication of modules. The communication of the processing modules not only refers to the high efficiency of SADS but also relates to the efficiency of anomaly detection. Generally, the communication includes the communication between the modules and the communication between the modules and the function iteration layer. The former is the fundamental structure, which is determined by the modules. And the latter is determined by the system and directly relates to the detection efficiency. Since the system needs fast response and the used memory has been limited, we believe that heartbeat method is more suitable than others like active pull. Therefore, we choose heartbeat method to achieve the communication of modules.
Load balancing for all nodes. Load balancing aims to avoid the case that the load in some nodes are too heavy, while the other nodes are idle. 26 To improve the resource utilization and meet the real-time requirement, the load of nodes should be considered when the system assigns tasks. Besides, SADS should be able to dynamically adjust the load of nodes in order to avoid the performance degradation or a single node of failure. Thus, exploring dynamic load balancing strategies is also a very important aspect for SADS.
Fault-tolerance of detection process. It is the guarantee of detection accuracy and robustness. Too many factors may lead to failures, such as instructions issued by mistake, allocation of nodes or runtime error. Moreover, as the number of components or nodes increase, so does the probability of failure. Once failures occurred, the anomaly detection may be interrupted, and it may lead to an extremely serious result. Therefore, we need to study the fault-tolerant strategies to solve the problems, which consist of the fault detection and rapid recovery.
Dynamic scalability of cluster. The change of node or topology is a normal and frequent operation in the streaming anomaly detection process. For existing systems, once the change of the nodes or the cluster topology happened, we have to interrupt the detection process and restart the system, meaning the inconvenience and the potential threats. Moreover, the new form of shared global economy requires cloud services to be collaboratively provisioned by different cloud providers in a geo-distributed manner. For instance, JointCloud 27 is a cross-cloud cooperation architecture for integrated Internet service customization. The topology will be much more flexible under such circumstances. So, we should explore dynamic scalable strategies of cluster to avoid the interruption and restart.
Self-adaption of repository. The repository directly relates to the commonality and transportability of SADS. The incompatibility among detection modules can easily lead to failures to interrupt anomaly detection. Besides, the multi-source of modules increase the artificial maintenance cost. Hence, we should design and implement a self-adapting technique for repository including (1) self-updating, (2) collision detection and (3) auto-merging.
Evaluation
Experimental environment
We have implemented EADetection based on SADS to verify the effectiveness and real-time performance in the real cluster environment. All the hosts are homogeneous, each of which is configured with an Intel Core i5-4590 CPU, 4G main memory, 1TB hard disk and gigabit Ethernet. Meanwhile, the SADS is implemented with Java running on the Ubuntu operating system.
The experiment datasets used in this article are the Sendmail dataset from the University of New Mexico (UNM) 28 and the Unix Shell dataset from Purdue. 29 The former includes 7 normal data files and 19 abnormal ones, and it is shown in Table 1. The latter includes 8 user’s log record within 2 years. One of them is taken as normal data, and it is mixed with few other user’s data as abnormal data.
UNM system call dataset files.

UNM: University of New Mexico.
PrefixSpan is a scalable and efficient sequence mining method, which has a good performance in sequence anomaly detection over data streams. 30 Similarly, EADetection also adopts sequence mining method to achieve low latency and accurate anomaly detection. Thus, we compare with EADetection to verify the latency and accuracy of EADetection.
To verify the latency, we adopt two metrics: (1) the number of projection space, which have a direct affect on the efficiency of sequence mining and significantly reduce latency when reducing the number, and (2) processing delay, which is used to characterize the low latency. The projection space is affected by the initialized threshold, which is calculated by the minimum support and the length of behavior sequence. To verify the accuracy, we adopt two metrics: (1) true negative rate (TNR) and (2) FPR. The metrics are usually affected by the anomaly degree threshold which is used to distinguish between normal ones and abnormal ones. To analyze how the behavior sequence length affects the detection efficiency and accuracy, we compare the detection results on UNM dataset and Purdue dataset.
Experiment performance
Performance of efficiency
To analyze the real-time performance, we first compare the EADetection and PrefixSpan by the number of projected space, which is the key factor that influences the efficiency. Then, we compare the processing latency between the two approaches to intuitively show the performance.
As shown in Figure 7, EADetection reduces the number of projected space significantly under different sequence length. The number of projected space decreases with the growth of minimum support degree, which indicates that minimum support degree is a key factor which influences the generation of projected space. We increase the sequence length from 8 to 11, and the number of projected space increases with high rate. This is because larger sequence length can increase the support degree, and then, more projection space is generated if the minimum support degree remains the same.

The number of projection space of PrefixSpan and EADetection with different min support degree under four sequence length setting: (a) sequence length = 8, (b) sequence length = 9, (c) sequence length = 10, and (d) sequence length = 11.
Figure 8 shows that EADetection significantly reduces the processing latency compared to PrefixSpan. Different from the phenomenon of Figure 7, processing latency does not always decrease with the growth of minimum support degree. It remains stable after minimum support degree is set to 8. This is because there is a large number of projected space when minimum support degree is small, which increases the processing latency due to variable patterns. With the growth of minimum support degree, the number of patterns becomes small. Then, the value of k in top-k detection strategy is a main factor that influences the processing latency. Processing latency remains stable because the value of k is unchanged.
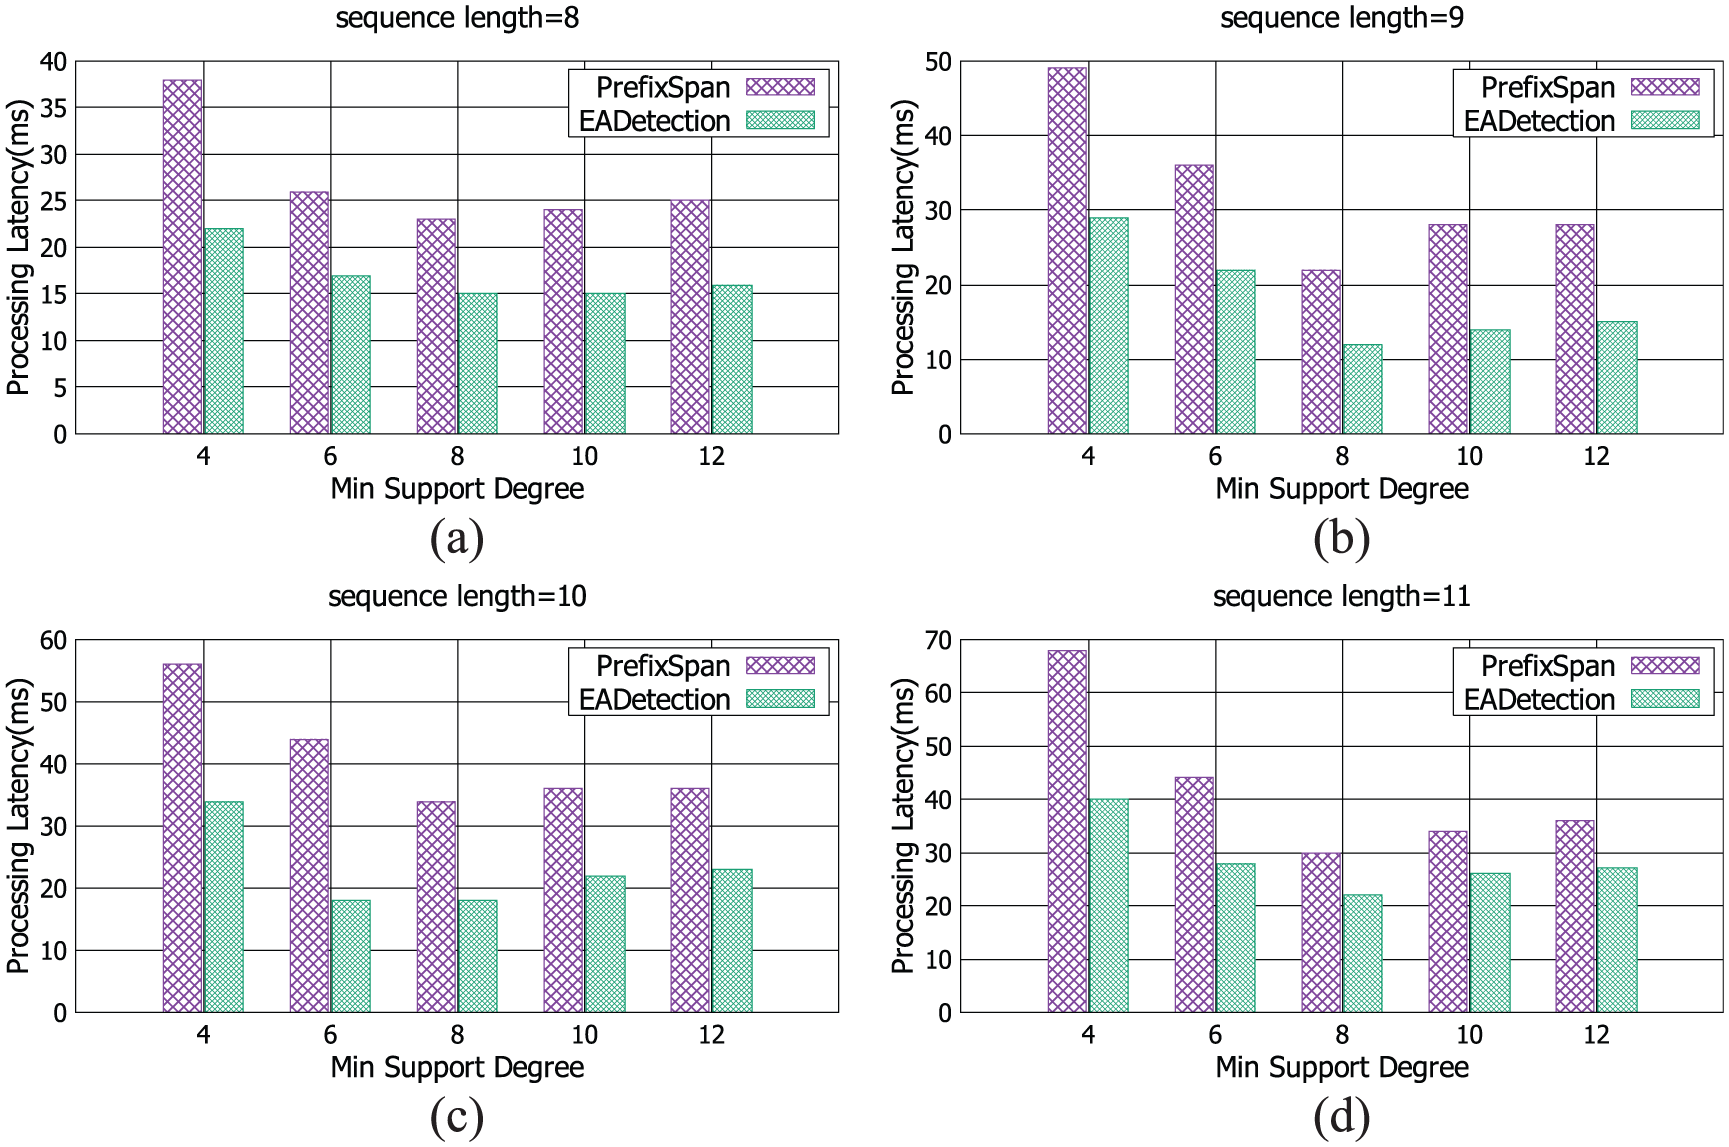
The processing latency (ms) of PrefixSpan and EADetection with different min support degree under four sequence length setting: (a) sequence length = 8, (b) sequence length = 9, (c) sequence length = 10, and (d) sequence length = 11.
Performance of accuracy
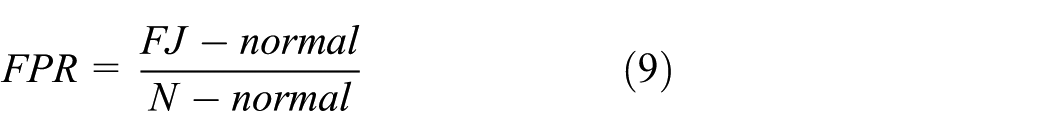
We evaluate the accuracy of EADetection with TNR and FPR. Suppose that the total count of sequences in the abnormal dataset is

As shown in Figure 9, EADetection achieves high detection accuracy with TNR close to 98% and FPR less than 10%. TNR of EADetection increases with the growth of minimum support degree. When minimum support degree is set to 10, it changes to be steady. FPR keeps at a low value when minimum support degree changes. And this is because EADetection removes and merges large number of short sequences.

Accuracy of PrefixSpan and EADetection with different min support degree: (a) TNR and (b) FPR.
To further verify the effectiveness of top-k pattern–based abnormal scoring, we evaluate the accuracy with different value of k and without top-k. As shown in Figure 10, TNR does not change too much when the value of k changes, and this is because EADetection chooses the k pattern with highest correlation intensity. Unlike TNR, FPR decreases significantly when k increases, which indicates that removing too many compared pattern will cause more false alarms. After k is set to 9, it changes to be steady. So, removing patterns with weak correlation intensity dose not impact the detection accuracy. Therefore, we can achieve high TNR while keeping low FPR by adjusting the value of k.
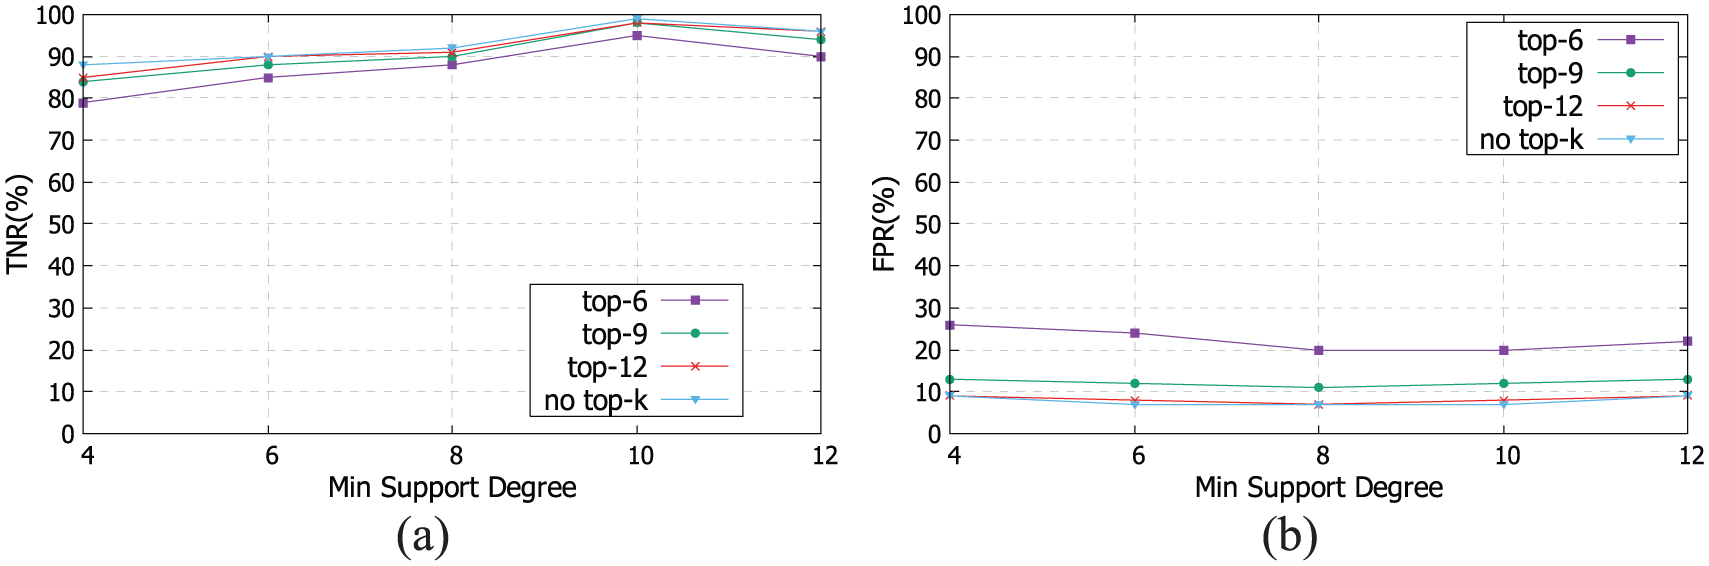
Accuracy of PrefixSpan and EADetection with different min support degree under different values of k: (a) TNR and (b) FPR.
Performance of difference datasets
To analyze how the behavior sequence length affects the detection efficiency and accuracy, we also experiment on the Purdue dataset. With respect to the UNM dataset, the sequences in the Purdue dataset are shorter. The number of the events in the two dataset are provided as the same to compare the efficiency and accuracy of the detection and the results are shown in Figure 11.

The result comparison of Purdue and UNM.
From Figure 11, we can observe that it has obvious efficiency advantages at the Purdue dataset. This is mainly caused by the two factors in short transaction conditions: (1) small projected database in the process of sequence pattern mining and (2) low-level traversal. Although the advantage in accuracy is relatively weak, we can still believe that the EADetection is more suitable for the detection scenario with relatively short length transactions.
Conclusion and future work
Nowadays, user behavior anomaly detection over data streams has received considerable attention in numerous fields, but it poses immense challenges to researchers. In this article, we propose EADetection, an efficient and accurate sequential behavior anomaly detection approach over data streams. To realize the adaptive segment of user behavior sequence, EADetection adopts time correlation and fuzzy logic to reconstruct user behavior scene based on rolling window. Through dynamic projection space–based fast pruning, large number of repeated patterns are reduced to improve the detection efficiency. Meanwhile, EADetection adopts the directed loop graph–based storage strategy to preserve the structural relationship of user behavior and calculates the anomaly score by Bayesian network after top-k pattern collision test, which ensures the accuracy of detection. Specially, we design and implement an SADS based on EADetection to perform real-time detection. Extensive experimental results demonstrate that EADetection achieves the two goals of streaming anomaly detection: (1) improving detection efficiency to meet low latency requirements and (2) guaranteeing the high accuracy.
Although our proposed approach efficiently completes user behavior anomaly detection over data streams, there is still much work to do in the future to conduct more research in this area. For instance, the considerations of concept drift is meaningful and challenging. The direction of our future work is to implement it in EADetection to further improve the performance of anomaly detection.
Footnotes
Acknowledgements
This is an extended version our paper “A User Behavior Anomaly Detection Approach based on Sequence Mining over Data Streams” presented at PDCAT2016.
Handling Editor: Antonino Staiano
Declaration of conflicting interests
The author(s) declared no potential conflicts of interest with respect to the research, authorship, and/or publication of this article.
Funding
The author(s) disclosed receipt of the following financial support for the research, authorship, and/or publication of this article: This work was supported by the National Key Research and Development Program of China (2016YFB1000101), the National Natural Science Foundation of China (Grant No. 61379052), the Natural Science Foundation for Distinguished Young Scholars of Hunan Province (Grant No. 14JJ1026), and Specialized Research Fund for the Doctoral Program of Higher Education (Grant No. 20124307110015).