
Abstract
Detecting psychological stress in daily life is useful to stress management. However, existing stress-detection models with only heartbeat/pulse input are limited in prediction output granularity, and models with multiple prediction levels output usually require additional bio-signal other than heartbeat, which may increase the number of sensors and be wearable unfriendly. In this study, we took a novel approach of incremental pulse rate variability and elastic-net regression in predicting mental stress. Mental arithmetic task paradigm was used during the experiments. A total of 178 participants involved in the model building, and the model was verified with a group of 29 participants in the laboratory and 40 participants in a 14-day follow-up field test. The result showed significant median correlations between self-report and model-prediction stress levels (cross-validation: r = 0.72 (p < 0.0001), laboratory verification: r = 0.70 (p < 0.0001), field test r = 0.56 (p < 0.0001)) with fine granularity ratings of 0–7 float numbers. The correct prediction took 86%–91% of the testing samples with error standard deviation of 0.68–0.81 in the label space of 14. By simplifying the process of prediction with a perspective of stress difference and handling the collinearity among pulse rate variability features with elastic net, we successfully built a stress prediction model with only pulse rate variability input source, fine granularity output and portable friendly sensor.
Introduction
Excessive psychological stress, one of the major mental health problems of modern society 1 is related to many negative mental and physical health outcomes, for example, anxiety, depression disorders, heart disease, cancer, and infectious illnesses. 2 Evidence from psychiatry research also showed mental stress as one of the most significant prenatal risk factors of Tourette’s syndrome (TS) and attention deficit and hyperactivity disorder (ADHD). 3 Breast cancer research showed improvement brought by stress management in cellular immune function. 4 Quantitative stress assessment, therefore, has great potential uses in various types of mental healthcare for both mass and specific population.
Heart rate variability (HRV) is known as a psychological stress indicator. 5 Consensus that multiple measures of HRV have consistent changing trends during the onset of stress was reported. 6 In previous studies of mental stress detection; measures of mean of heart rates (mHRs); standard deviation of beat-to-beat interval (SDNN); root mean square of the sum of the squared differences between adjacent normal R-R intervals (RMSSD); very low-, low-, and high-frequency ranges in power spectrum (VLF, LF, and HF); and pNN50 were employed.7,8 Good prediction accuracies of machine learning were seen in published studies.9–12
However, several challenges still exist in application of the stress-detection technology. One of the major challenges of stress detection with machine learning is the realism of the prediction result. Subjective stress is considered continuous in value domain and can be measured with self-report scales with fine granularity.13,14 Most machine-learning algorithms produce binary classification (labeled as stressed and non-stressed). As for linear regression, which produces continuous values, reliable model for HRV measures and subjective stress level was not reported so far. Another challenge is device portability. Electrocardiogram (ECG) is the most popular technology for HRV data collection, but most of the ECG devices are not portable or may give considerable extra burden to users.
The objective of this study was to develop a stress-detection model based on R-R interval that could reflect subjective stress precisely with continuous digital levels (instead of stressed and non-stressed dichotomy classification) and be used in daily life without burdening users with additional devices. Thus, the following requests should be fulfilled: a linear model should be built because typical output of other machine-learning approaches generates discrete classification results; no re-classification should be done on stress self-report; the ground-truth should be totally based on stress self-report, otherwise the subjectivity could be distorted by bias introduced; and input sources other than R-R interval are not applicable because additional signal calls for additional sensors as well as power consumption which brings extra burden and technical problems. Few research gaps are therefore needed to be filled. First unknown matter was if the indices based on R-R intervals can express stress level linearly. Meanwhile, assuming former question answered positively, given some HRV parameters are highly correlated, and whether collinearity problem can be resolved properly during linear model building (MB) is another pending issue. Moreover, stress self-ratings are inevitably with between-person bias, how to reduce such bias while maximally protect the subjective intention is a key problem that is still pending.
New approaches in measurements, sensors, and learning models are boosting technical improvement in digital healthcare area.15–20 Pulse rate variability (PRV) is proved an alternative measure to HRV. 21 Photoplethysmography (PPG) being as a portable pulse signal collecting sensor has been previously verified with good reliability and validity.22–26 In linear regression learning method, elastic net is an effective variable-selection method in dealing with the curse of dimensionality and parameter collinearity. 27
Since many of the HRV/PRV features have certain changing trends, while stress level switches between low and high, 6 we hypothesized that there is a linear HRV/PRV feature combination responsive to the interplay between sympathetic and parasympathetic nervous system. In this study, we devised a novel transformation for the PRV features to approach the responsive formula. Nine PRV-related features from PPG voltage curve data were selected by using elastic-net method. We used PRV change between statuses instead of absolute values to express the stress difference. In this case, both the change of feature values and their explicit directivity were used in building the regression model, and an output, continuous in value range, was acquired. The model performance was verified in both laboratory and field test. To our knowledge, it is the first study of PPG and raw self-report-based PRV psychological stress assessment with fine granularity output.
Background and related work
The activation of sympathetic nervous system is considered an outcome of mental stress, while parasympathetic nervous system works in an opposite way as a peacemaker to release the stress and HRV responses to this interplay. 28 With approaches of machine learning, models built in previous works were based on the hypothesis that stress may be classified into several (or binary) ranks. 10 Raw self-reports, for example, collected by Likert-type scales, were re-classified based on researchers’ experience, data distribution, and manipulation exposure. 12 To increase precision of the predictions, galvanic skin response, skin temperature, and respiration data were employed with HRV based on literature.11,29,30 However, re-classification for self-report may also introduce bias to the ground-truth. Binary and multiple ranks classification of mental stress is also contradictory to common sense that mental stress level is a continuous gradient value. This study was underlined by its noninterference of subjective report and its realistic continuous assessment output.
Scene design
Two types of design were used in the previous research: research based on laboratorial stressor and field event stressor. Typical laboratorial manipulations are: (1) Trier Social Stress Test: 5 subjects would be asked to prepare a public speech; (2) Cold Pressor: asking participants to put his or her dominate hand or both hands into cold water and keep doing this for 5 min; 31 (3) Mental Arithmetic: subjects would be required to finish a serial of mental mathematics trials (e.g. Montreal Imaging Stress Task (MIST) 32 ), which was employed by this study; (4) video and music materials as stressor were employed in some studies.33,34 For field design, researchers used specific events in real-life as stressor (e.g. academic examinations) 35 or used regular self-reports as ground-truth to evaluate the performance of the model. 11
Usage of HRV data
Three types of HRV features were employed by researchers: time domain, frequency domain, and non-linear features. Responses to emotional stimulants for many of these measures were examined by researchers.6,36 Distinctive changing trends for several features caused by mental stress influence were found, and studies used these features to quantify stress were seen. Karthikeyan et al., 10 used a serial of methods including discrete wavelet transform (DWT), Lomb-Scargle periodogram (LSP), probabilistic neural network (PNN), and k-nearest neighbor (kNN) generated binary stress prediction. Singh et al. 12 used both galvanic skin response and HRV features and predicted different stress status while driving. Traina et al. 37 used linear expressions and described the response of different frequency bands to subjective stress and found significant correlation between stress level and the response. Plarre et al. 11 used both HRV and respiration features to build models with support vector machine (SVM) and J48 decision tree and predicted binary stress status. Although many of their learning processes were based on labels defined by re-classified self-reports or experiment manipulation exposures, which could lead to extra bias, and most of their outputs were discrete rank data, and they have demonstrated the potential of HRV features and machine learning in mental stress prediction.
Ground-truth acquisition
In psychology research (i.e. studies for post-traumatic stress disorder (PTSD) and cortisol level), stress assessments were done by self-report.38,39 Stress predicting model studies also used self-rating, but the difference in self-rating data was usually further classified by data distribution in these studies.12,37 The re-classification was to reduce the number of learning labels to meet the model’s limited prediction precision. Experimental manipulation is another way to label stress status. Typically, HRV or PRV data generated during rest block were labeled as non-stressed, while data from task block were labeled as stressed. 11 Either method could introduce extra bias by improperly treating self-rating between-person difference or between-person difference for response and non-response to stressor exposure.
Present approach
In laboratorial phases of this study, we used mental arithmetic task (MAT) as stressor exposure paradigm. A self-rating 8-point Likert-type scale was used as stress assessment. No modification or re-classification was applied to the self-rating value, and the value difference between experiment blocks was used as a learning target. Elastic-net regression 40 was used as feature screen and MB method. The features were built in differential form as well. The differences of each traditional PRV parameter appeared between blocks were used. After the elastic-net regression performing screening, fitting the differential PRV features to the perceived stress difference, a 10-fold cross-validation was done. A smaller group retest and a 1-day daily-life stress-tracking study with three times data collection per day were conducted to verify the model performance.
Data collection methodology
Study design
There are three phases in this study. In the first phase (MB phase), we built an elastic-net model and applied a 10-fold cross-validation with laboratory-based experiment. In the second phase (performance verification (PV) phase), to verify the performance of the model, a smaller group of participants with different background from MB phase was used. The MAT was modified as a shorter version. Smaller sample size and the shorten task reduced input information of the model, as a result, the using condition became more rigorous than in MB phase. The third phase was a field test (FT) phase, PPG signal collection devices were provided to every participant and used to track their daily stress for 14 days. This phase was one closest to the actual usage scene, long-term performance of the model was tested.
Participants
In MB phase, 195 participants were recruited with local advertisement. Due to the loss of data, 178 (age: 16–36 years, 85 male) participants’ data were obtained. In PV phase, 29 (age: 29–45 years, 17 male) participants were recruited from an information technology company. To balance the bias of mathematics skill management, participants were recruited from development department, administration department, and business department. FT phase recruited 40 participants (age: 19–33 years, 20 male) from local college students with part-time job cyber billboard. In MB and PV phase, participants were asked to arrive at laboratory 30 min before the test began and sit in idle to adjust themselves to a rest state. All the participants have passed a screening questionnaire to ensure no one has one of the following experiences or diseases: heart disease, cerebral trauma, hypertension, or having taken hypotensor (including but not limited to propranolol, metoprolol, Tenormin, bisoprolol, carvedilol) within 6 months. In both MB and PV phase, alcoholic beverage was refrained at least 24 h before the test.
MAT
The principal component of MIST 32 is a computer-based arithmetic task. In prior studies,32,41 significant increase of subjects’ cortisol was found after the task. In this study, we used the paradigm of MIST principal component as a prototype and developed MAT for experimental usage. The software was developed with Microsoft Visual C#. 42
Three blocks were used in the MB phase: task with time limit (TL) bar, task without time limit bar (T block), and blank block (B block). The task was constituted with mental arithmetic trials with answers of single-digit numbers. Each block was presented once and the order was random to counterbalance proactive interference between the blocks. In the TL and T blocks, participants were asked to complete MAT, while in the B block, participants were asked to sit in idle. In the PV phase, only TL and B were exhibited with fixed order. A practice session with 10 trials was presented before all blocks, and 2-min short breaks were set between adjacent blocks (Figure 1).

Experiment procedure.
Each trail in both task blocks (TL and T blocks) were with time limit, but only TL block informed subjects the remaining time explicitly. There were five different task difficulty levels, from two operands with only addition or subtraction operator to four operands of addition, subtraction, multiplication, and division. The duration of each block was 2 min; therefore, in TL and T blocks, the total number of trials finished by each participant was determined by the time they cost on every single trial. A rotary digit number dial pad for mouse-click inputting answer and a correctness feedback field were placed in the user interface layout (Figure 2).

Graphic interface of the mental arithmetic task.
Instead of using a MIST user-performance indicator, 32 we provided a dynamic money reward to the participants. A sum of 250 Chinese Yuan was the initial reward amount, and when participants gave an incorrect answer, 5 Yuan was subtracted from the initial amount. The remaining value was displayed by another text field below the time limit bar. Time limit for the trials was also dynamic. After every correct answer, the limitation reduced by 10% with floor value of 4 s, and an incorrect answer will increase the limitation by 10% with ceiling value of 8 s. There is a baseline time (8 s maximum) for every participant determined by average correct response time in practice session before all blocks.
Heart/PRV
In MB phase, to confirm the consistency of PPG and ECG data, we collected corresponding HRV data with ECG. ECG data were collected with BIOPAC MP160. 43 BIOPAC MP160 is a console paired with a three-lead wireless ECG sensor using adhesive electrodes attached to the user’s chest. The PPG data were collected with Huawei Watch 2, which is a wrist watch shaped smart wearable device with a PPG sensor embedded. Participants were asked to wear both ECG and PPG devices during the whole MAT.
We extracted R-R interval from the ECG and PPG raw signal and built HRV and PRV features. The ECG-HRV features were calculated with the R language 44 and RHRV package. 45 For R-R interval variability measures based on ECG and PPG signal, known as HRV and PRV, obtained high coefficients of determination between 0.92 and 0.99, 26 and PRV was considered an alternative method for HRV, 21 we performed same calculation to extract PPG-PRV features with MATLAB. 46 All data analyses were conducted using Python programming language version 2.7 with packages of pandas (version 0.19.1), SciPy (version 0.18.1), and sklearn (version 0.18.1).
Features of different dimensions were introduced to the study. A total of 36 parameters were dumped from the raw R-R intervals, and we first removed all the VLF- (range: 0.0033–0.04 Hz) related parameters because our task duration was less than an entire time circle of this frequency; single parameters with absolute values were either transformed into ratio value or removed; in addition, we calculated pairwise correlation coefficients of the parameters, removed ones with correlation coefficient over 0.9 in any of their pairs and correlated lower with stress self-report, which was the learning target value. After this manual parameter screening, nine parameters were left. Statistical (HR variance, RMSSD, SDNN), 47 geometrical (Mode and amplitude), 35 frequency range (LF with band of 0.04–0.15 Hz, HF with band of 0.15–0.4 Hz, and LF/HF), 48 and non-linear (SD1SD2) 49 measures were selected. In addition, variance of estimated heart rate by every R-R interval and width of R-R interval’s histogram (20 ms per unit) were also included. For LF and HF are absolute values, which may be different on measure scale when duration of data changed, to increase the validity of the features in different time scale, we replaced these features with proportion of LF and HF in total power (Table 1).
Definitions for extracted features.

Self-report
Before the TL block in PV phase and after every block in both MB and PV phases, the participants were requested to report their stress level by clicking a radio button group with eight choices (from 0 to 7, where 0 represents totally relax and 7 represents extremely stressed, Figure 3). The self-report stress level is with between-person differences and these differences may mislead the learning process. For example, some people believe when there is no stressor, the ordinary status should be totally relaxed (choice 0), while some believe an ordinary status should be 2 or 3. Researchers often used experiment manipulation as ground-truth to regulate self-report, an elaborative approach was building an experimental manipulation-orientated machine-learning classifier to further decide what stress level a self-report result actually stands for. 11 However, from psychological perspective, the self-report stress level may be even more precise than stressor-defined stress level because every stressor stimulation has a certain response rate in population. A study about public speech anticipation stressor showed that response rate was only between 20%–40%. 50 Thus, using experiment manipulation as ground-truth may unintentionally conceal this natural responsive difference. In view point of data variance analysis, between-person difference belongs to individual level, while the experimental manipulation is a systematical, across-subject variable. Data regulation with non-counterpart factor could increase bias. Our study took an individual-level approach to control the between-person difference of stress self-report. To include baseline differences, we asked participants to do the self-rating before all the procedures and used this rating value as an individual baseline, and the baseline values were added to all their model-prediction results. Another attempt to diminish between-person difference in self-rating is using difference between stress states instead of absolute value of every stress state in MB.

Stress self-report interface.
MB methodology
Since the HRV measures have explicit directionality trends between stressed and non-stressed conditions, 6 it implies that a stress level prediction could use the directionality trend as a dichotomy to determine whether the subject became more stressed or less stressed than before. Thus, we hypothesized that there is a linear combination for the differential PRV features’ responds to subjects’ stress level differential. We standardized the data of all the features respectively and used the difference values instead of absolute values in both PRV features and self-rating scores. Three different blocks (TL, T, and B) has six feature vectors (TL—T; TL—B; T—B; T—TL; B—TL; B—T) and six corresponding self-rating differences

where DFV is short for differential feature vector, c1 and c2 represent different blocks of the mental task, and fs with footnotes represent feature sets during blocks. The subtraction between feature sets complies with the rule of vector subtraction.
In line with the need for continuous output, the regression should be the natural choice of our learning algorithm. However, regression classifiers demand correlations among features as low as possible. 51 HRV/PRV indices are known to be inter-connected, and many indices are correlated with others. Therefore, the dilemma exists when a continuous outcome is demanded from a model, while traditional linear regression loses its precision with collinear parameters. The elastic-net’s shrinkage process is designed to resolve collinearity problem,27,40 as a result, parameters that are considered to be risky from perspective of traditional linear regression can still be used to build a robust regression prediction model by the elastic net. Correlation matrix was calculated to find out how much each pair of variables is related (Table 2). Strong and medium correlation between variables were observed (r = 0.84 maximum). To handle the collinearity problem may be caused by the correlated features and stabilize the performance of the predictor, elastic net was employed as our parameters screener (Figure 4).
Prediction result along timeline for stress prediction and self-report in FT phase.

SDNN: standard deviation of beat-to-beat interval; RMSSD: squared differences between adjacent normal R-R interval; HR var: variance of heart rate; Mo: geometrical mode; AMo: amplitude of geometrical mode, PLF, PHF: proportion of LF and HF in total power spectrum; Hist-Width: width of R-R interval’s histogram (20 ms per unit).

Data processing scheme.
We used 1.5-min signal in the very middle of the blocks to extract HRV features. The feature vectors and their corresponding differential self-rating values were then applied to the elastic-net model training. The penalty parameter was set 0.95. Cross-validation was performed to determine the best cut for parameters. To draw a comparison between differential feature vector (DFV) model and absolute feature vector, we also built a model for absolute feature vector and tested its accuracy.
Performance verification and field test
As is shown in Figure 1, the PV phase used simplified experiment manipulations (only T and B block, and the T block was excluded from the process). For there were still three self-rating points for every participant, six DFVs and six corresponding self-rating differences were extracted. Compared with MB phase, there was more uncertainty of the data for the stress-arousal level after practice—some participants may treat the practice seriously, someone may finish it in a leisure way, and others might have an arousal level in between. This was a strict condition for the model performance test because only the stress-arousal trend reflected on PRV features verged on the same linear hypothesis, can the prediction be precise. As a result, the PV phase can be considered as a demanding reliability test for the model.
The FT phase was a 14-day real-life follow-up experiment. Participants were required to finish a short note once for a day to keep record of stress events in their lives. They did the PRV data collection three times a day, 5 min each time. Self-ratings after the collections to mark the stress level at the very time spot were requested. We used 1.5-min PRV data in the very middle of the collection process to calculate the features. The feature vectors were generated consecutively; thus, every single DFV was generated by performing subtraction for latest absolute feature set and the one before the latest. As we had 14 days’ data with three data records per day, there were 42 PRV absolute value feature sets and, accordingly, 41 differential feature sets for each subject. We used the third HRV feature and self-rating as the baseline to make sure that the baseline self-rating is noted when participants got used to live with the setup of FT phase. The participants’ stress level was more unpredictable in their real-life, and students could lead a life which is ordinary in stress change. As shown in the diary, it was true that participants went through none of the stressing life events in the social re-adjustment rating scale 52 during the FT phase. Meanwhile, there could also be extreme status without being aware of themselves, which might become an extra unexplainable variance. These were the major challenges to the model’s capability in reflecting subtle fluctuations and tolerance for noise. Since the application scene exhibited many unexpected characteristics and was real-life based, we regard this FT phase as a test for the model’s ecological validity.
Results
Cross-validation of elastic-net result showed the best cut at lambda equals 0.0027 (Figure 5) and rejected SDNN as a parameter of regression model. The mean-squared error during the iteration was stable within the lambda space of 0–0.1324 (log Lambda ∈ (–6, –2)), while the space was mostly taken by nine parameters formula, which only varied at the tail with a 1–3 parameter’s drop. The parameter adjustment showed during lambda’s shrinkage, all the parameter curves changed gently in most of the x-axis space (Figure 6).
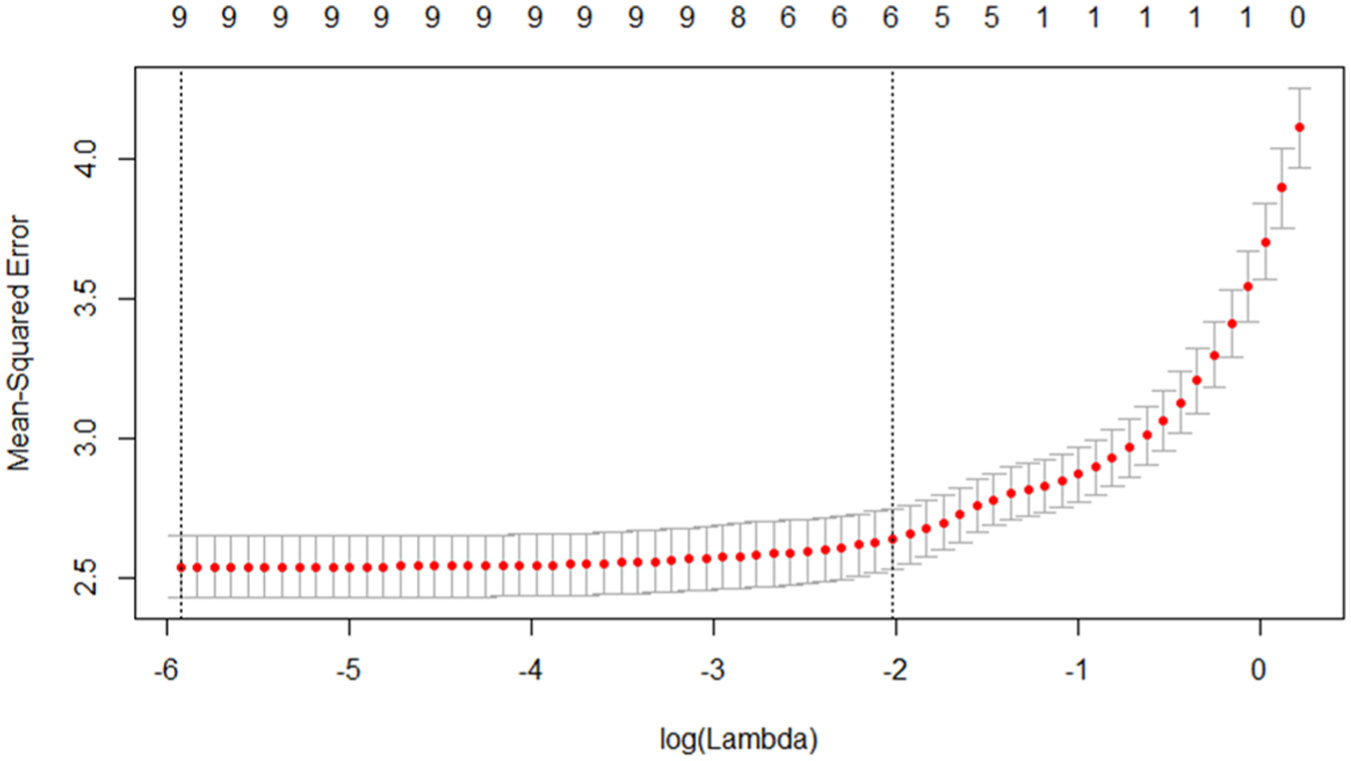
Mean-squared error during elastic-net cross-validation iteration process.

Parameter adjustment during elastic-net cross-validation iteration process.
In the MB phase, a 10-fold cross-validation was applied to the DFV model to acquire the model-prediction performance. We chose 18 (approximately to 1/10 of the total participant number) individuals as the test set and used the rest to do the training. This process was performed 400 times with no identical subject combination for both sets, and the self-reports and prediction results were recorded. Bivariate (Pearson) correlation was run between the self-reports and prediction results (Table 3), a median correlation was found (r = 0.72, p < 0.0001; Figure 7). Same test process was done to the absolute feature vector model, we acquired a lower correlation (r = 0.40, p < 0.0001). In the PV and FT phase, the model prediction with PPG-PRV DFVs input also exhibited medium correlations with self-report, respectively (r = 0.70, p< 0.0001, and r = 0.56 p < 0.0001; Figure 8). We used ECG-HRV DFVs as input and compared ECG- and PPG-based output records with correlation (r = 0.75, p < 0.0001). The correlation of ECG-based output and ground-truth was also found median (r = 0.68, p < 0.0001).
Performance of the models.
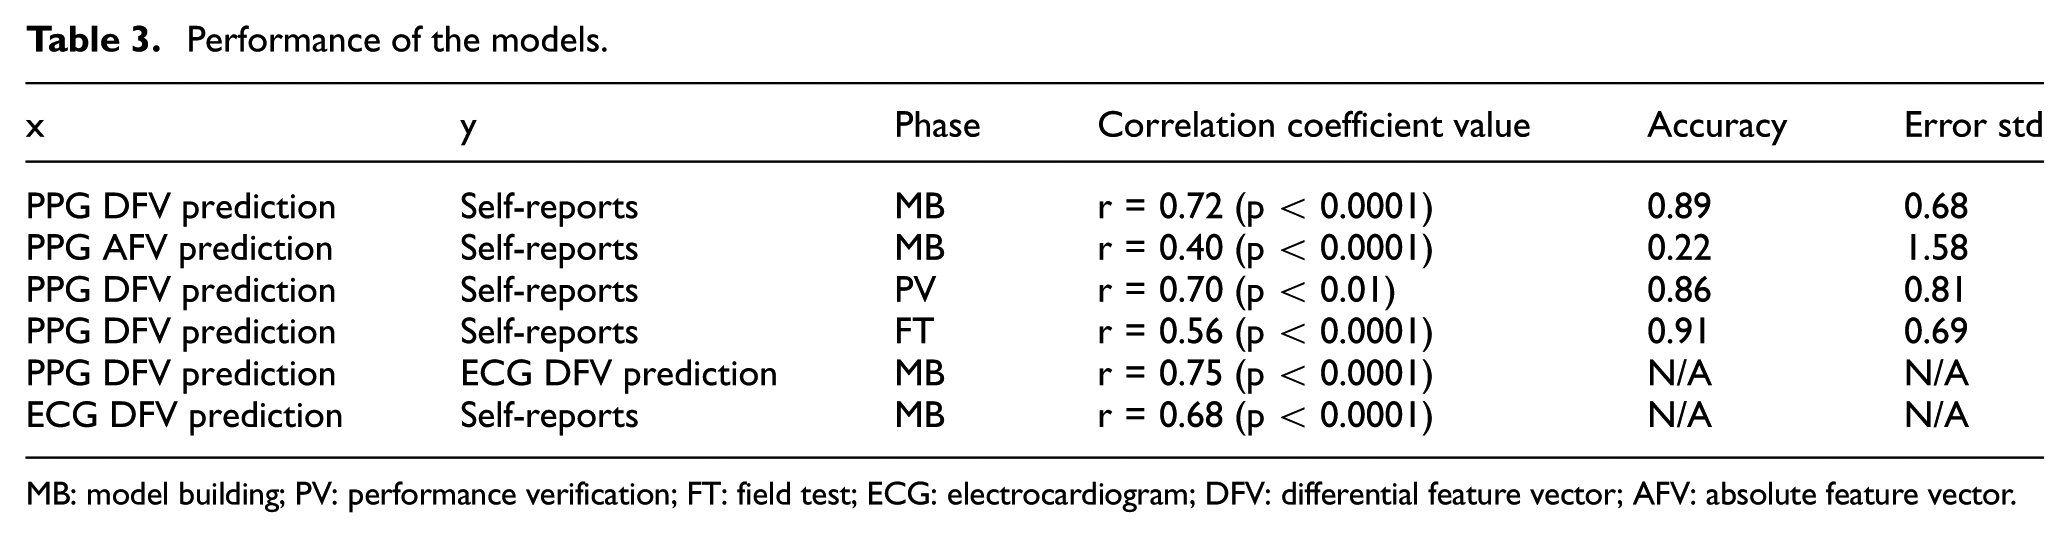
MB: model building; PV: performance verification; FT: field test; ECG: electrocardiogram; DFV: differential feature vector; AFV: absolute feature vector.

Cross-validation result for stress prediction and self-report in MB phase.

Prediction result along timeline for stress prediction and self-report in FT phase.
Since self-rating was from a 0–7 Likert-type rating scale, with the measure of difference between ratings, the value space length increased to 14 (–7 to 7) in all three phases. Considering a larger value space and the discrete raw rating data, in precision measure, we set the error tolerance as ±1 (the minimum value between two integers) in the value space of 14 (–7 to 7). Thus, if the error between self-ratings and predictions were within ±1, predictions were marked as correct. This judgment standard was applied to all the phases. Based on this decision rule, the DFV model’s correct predictions took 89% of the test samples in MB phase, while the standard deviation of its error value was 0.68; as a comparison, absolute feature vector model showed an accuracy of 22% with error standard deviation of 1.58; for PV phase, correct predictions reached 86% of all the predictions with error standard deviation of 0.81; and in FT phase, 91% of the predictions were correct with error standard deviation of 0.69.
Discussion and conclusion
The result of the model (Figures 5 and 6) showed the mean-squared error was well controlled in a stable space while in a long-range of lambda change, this suggests that the model is stable in both parameter and performance. The parameter’s adjustment tracks, being flat in trends, also confirmed stability of the model. It can be concluded that with the nine parameters, this model generates predictions with good data credibility. In cross-validations (Figures 7 and 8), predictions and self-report were in concordant trends, data were better fitted in central space than in remote areas. This could be caused by the observations being more concentrated in the center so that the central cases were better trained and responded than the remote ones.
In this study, researchers used PRV features differences between stress stimulation levels and their counterpart stress self-rating to build a linear regression stress prediction models. After laboratorial MB process, the model was verified by a 10-fold cross-validation, another smaller laboratorial data set, and a 14-day field follow-up data set. Also, a model with raw features absolute values was built as performance comparison target. The result showed a good prediction accuracy and stability while the performance in both laboratorial and field data sets were similar. This suggests that the model has a good ecological adaptability and robustness. The feature difference–based model also over-performed well than the model based on feature absolute values in both prediction accuracy and result stability. This proved that HRV/PRV feature difference preprocessing was a successful strategy in building stress linear model. The results using ECG and PPG input were moderately correlated, and this result exhibits partial incompatible of the data source sensor. In this case, a particular input source may need MB process by the signal itself to serve its own purpose.
HRV, as an index of mental stress, was investigated by prior researchers with the approach of prediction models, and many of the modern ECG modules took HRV stress detection as a functional component and are good at discriminating stressed and non-stressed difference. 53 Our study took one step forward and used PRV to calculate stress not limited in status but in level. Model for continuous and scenario-free output has not been developed; besides, many models still need other biofeedback as evidence to work with HRV/PRV features. With PPG and microprogrammed control unit (MCU), R-R interval collection may now slip the leash from multi-lead polygraph’s wires, electrodes and heavy main unit. As a result, a model for PRV daily use is demanded. This study took a novel method of PRV data usage with the perspective of stress difference as data correction, and feature construction strategy built a model to meet the demand of higher stress measure precision. In this section, we discuss the novelty and contributions of our approach as well as the limitation and future directions.
Contribution and findings
Our study aimed at building a PPG signal–based, scenario-independent, realistic input–output mental stress–detection model. The result exhibited significant correlations and good accuracy, which suggested that it is practical to use this model as a mental stress predictor. In line with the objectives of this study and evidenced by field test phase, this model is particularly useful for daily stress assessment. To our knowledge, this is the first reported realistic output PPG-PRV stress model. Compared with prior studies in recent years, our work showed advancement in multiple aspects (Table 4).
Comparison of representative-related studies in recent years.
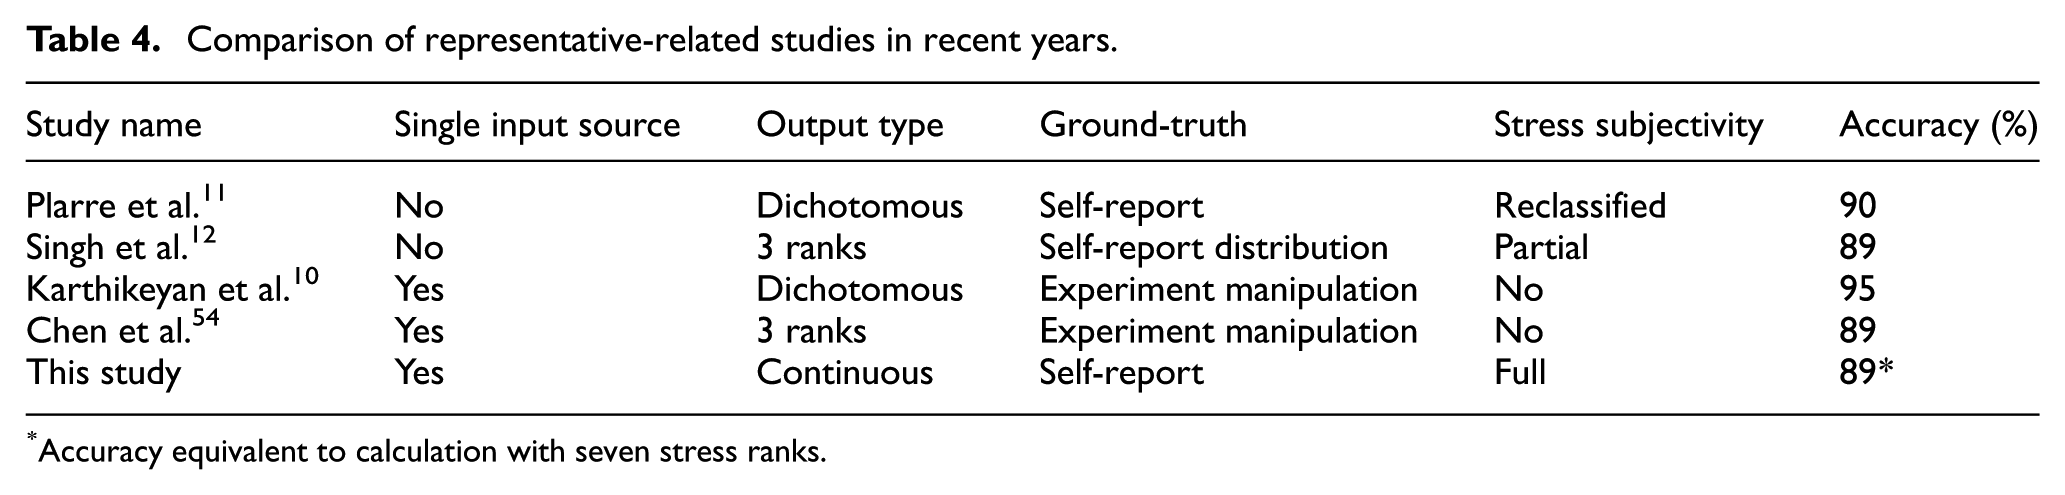
Accuracy equivalent to calculation with seven stress ranks.
The key contribution of this study, which also enables regression family method to predict mental stress, is the perspective and measure of differential. As the trends of HRV/PRV features are sensitive to the directivity of mental stress change, the DFVs model kept this information with sign after the subtraction between two absolute feature vectors and self-ratings. The directivity of features and ground-truth served as a dichotomy before the beginning of model’s learning process, for the label space is split by the rise and fall of stress level. Methods other than using differential perspective, if not explicitly set, would insufficiently utilize directivity information, and this could be seen from the DFV model well outperforme absolute feature vector model. It is an important advance for mental stress prediction because the design of this model handled the major problem of previous research of stressed versus not-stressed (more versus less stressed than previous level in this case). Usage of the trends preserved and enhanced important information. With this method, prediction based on PRV features alone and realistic output became possible.
Another highlighted contribution is that we used PRV features only but combined with other biofeedback information. Although respiration, galvanic skin response, and skin temperature were critical to some previous models’ performance, 11 they are difficult to acquire from today’s smart wearable device. This single data source characteristic of our model improved the practicability for stress detection. Also, this single data source model implied that PRV alone provided enough information for mental stress prediction. Furthermore, our use of elastic-net model provided an evidence for linearity between PRV features and mental stress which has not been well proved before. Future research for further relationships between feature changing trends and autonomous nervous system activities are needed.
Based on the idea of keeping self-report losses and avoiding extra bias being introduced, there is no further manipulation (re-classification, labeling by block type etc.) applied to the ground-truth, and even though this brought considerable challenge, continuous learning targets were preserved. For the first time, this study provided a model that measures stress with a continuous variable instead of a rank variable. It is more complicated than using binary classifiers (e.g. SVM, decision tree, and Naïve Bayesian Model) to separate different status because rather than finding and using distinctive features with machine-learning toolbox, this study used discovery of latent relationship between factor differences which referred to additional investigation.
Limitation and future work
This model focused on only acute stress model, while the absence of chronic stress assessment is a limitation of this study. Chronic stress assessment reflects a more representative status of a person’s stress level. Another limitation can be observed from the correlation coefficient’s drop: though the accuracy did not change much, the correlation decreased from laboratory’s 0.72 to field’s 0.56. This implied that there was some possible unknown variance in the follow-up tracking that did not show up in the laboratory. The cross-validation result figure showed that points fitting accuracy decreased while the distance to the center of y-axis increased. Data distribution could be one of the reasons, but a more precise expression which covers variations more comprehensively may also resolve this shift elegantly.
Multiple approaches can be taken to improve time span coverage of stress predictor. First, a search for long-term stress-sensitive HRV features is worthy. Some literature already showed evidence of how HRV features are responsive to chronic stress. 55 Second, since acute stress assessment can be acquired by the model of this study, the stress record could be a clue for further discovery of the relationship between acute and chronic stress;56–58 moreover, with trackable PRV features, patterns in probability distribution and value variance of acute stress levels 59 in long-term need to be explored in future research.
Compared with laboratory data in MB and PV phase, the correlation coefficient in FT phase dropped from 0.72 and 0.70 to 0.56. Tracking down the sources of the variation as well as finding PRV features responsive to the variation should be future goals. For example, age could be one of the most evident variables. 60 Although little obstruction was made by age in this study for ages of participants concentrated in early adulthood, it is true that we did not consider moderate variable other than PRV while modeling. Factorial research should be conducted in future to further discover unknown variations.
With the same model, ECG-derived output also showed a strong correlation with PPG-derived output; the homogeneity within the two types of signal showed in our study, being consistent with previous research.22,25,26 It is not surprising that the ECG-derived output is weaker in predictive power for stress because the model was built based on PPG feature vectors. More technical discussion about PPG and ECG signal should be referred in future work.
Concluding remarks
It has been long time for researchers trying to make HRV and PRV a practical measurement for mental stress, the goal of this study is to provide a model which can meet the demand of daily use. By providing a novel measurement of stress difference, we successfully brought a promotion for PRV mental stress prediction precision and its practicability. A new possibility for various mental healthcare and mental disorders rehabilitating services is therefore provided. Further studies based on our new findings are needed.
Footnotes
Acknowledgements
The authors would like to thank Anqi Zhang, Lan Xia, Xiaoping Zhao, Yu Zhu, and Bo Yang at Huawei Devices (DongGuan) Co., Ltd. for their assistance in hardware support and signal processing.
Handling Editor: Joel Rodrigues
Declaration of conflicting interests
The author(s) declared no potential conflicts of interest with respect to the research, authorship, and/or publication of this article.
Funding
The author(s) disclosed receipt of the following financial support for the research, authorship, and/or publication of this article: The study is as a part of Evaluation and Intervention Technology Research for Post-traumatic Stress Patients Population project (grant no.: JCYJ20170413170301569) and is funded by Shenzhen Science and Technology Innovation Commission.