
Abstract
The present sensor arrangement in a cubic way for monitoring crack propagation in rock samples exhibits shortfalls of blind monitoring zone and large deviation. This study proposes a double-layered wrap-around sensor network, which enhances the monitoring range and improves the location accuracy of acoustic emission source. Furthermore, based on the polar formation algorithm, acoustic emission source was positioned to explore the propagation of microscopic cracks in cylindrical rock samples and this was further validated by the acoustic emission activity index. The results show that: (1) The double-layered wrap-around sensor network exhibits considerably broader monitoring range and enhanced precision. The simulated fracture formed from cracks of high-energy release had a favorable consistency with the macro-failure surface of rock specimens; (2) During the loading process, acoustic emission activity had a significant positive correlation with signal amplitude and the number of events. In addition, acoustic emission activity of medium-grained sandstone showed a tendency of decreasing—remaining at a low value—increasing—remaining at a high value, which exactly corresponds to the four rock loading stages of compaction, elastic deformation, crack development, and crack connection; (3) rock samples experienced micro-cracking of low energy, micro-cracking of high energy, and crack connection in sequence in the failure process, which shows a high consistency between crack development and acoustic emission activity. Thus, acoustic emission activity could be used as an index for assessing the rock failure state.
Keywords
Introduction
Acoustic emission source (AES) monitoring refers to monitoring acoustic emission (AE) signals emitted from rock masses subjected to loading, and AES can be used to evaluate the stress level and damage degree of rock masses. The most direct and effective method of studying rock mass damage is to locate the cracks in rock masses during the loading process by acoustic emission sensors. Accurate positioning algorithm, AE sensors of high sensitivity, and reasonable sensor arrangement are required to monitor crack development in rock masses and thus to assess the rock mass damage. To this end, extensive studies have been carried out. A new AES positioning approach was applied to a large-size plate like structure and then used in combination with the time-of-flight to assess AES location and source positioning algorithm, which enhances the positioning precision. 1 Several researchers proposed an AES positioning technique of fiber-reinforced composites, which was employed to distinguish artificial AES from real AES. 2 In respect of specific positioning algorithm, a multidimensional scaling method, a novel method combined with Wigner-Ville distribution (WVD) for AES positioning, and a Delta T scheme were proposed to reduce location error.3–5 Some scholars used a new positioning algorithm and sensor arrangement to promote the precision of AES location.6–10 In order to improve sensor efficiency, an optimized microfiber coupling sensor, the bar wave calibration method based on AE sensor, a new denoising method based on π-phase shifted fiber Bragg grating sensors, SA ultrasonic sensor were proposed to increase the sensitivity of AE sensors in terms of receiving signals and hence to improve the accuracy of location.11–14
The aforementioned studies mostly focused on the improving AE positioning algorithm and increasing AE sensor sensitivity. However, few researches were concentrated on the optimization of AE sensor arrangement so as to improve the positioning precision of rock cracks. As the arrangement of AE sensors could significantly impact the effectiveness of recorded data and the rationality of monitoring results, its analysis is of utmost importance to studies of crack development and rock damage. On the basis of previous studies, a double-layered wrap-around sensor network (DWSN) was proposed to investigate the acoustic emission activity (AEA) laws of cylindrical rock samples. The energy released by the development of micro-cracks in rock specimens under loading was classified and a specific algorithm was used to calculate AES so as to achieve the location of micro-cracks in the rock specimens. The coupling characteristics of AE signals and crack development during the rock failure process were investigated and the rationality and accuracy of DWSN were validated.
The optimization of AE sensor arrangement
An AE sensor cubic array arrangement was put forward to improve the positioning precision of AES. 6 The location of AES was measured by calculating the distance between AES and sensors, the relationship of wave velocity and time, as shown in Figure 1. As the height of cylindrical rock specimens is greater than the diameter, the arc section between the two ends of the specimens and the two adjacent sensors falls outside the covering range of sensors, as indicated by the shadowed section in Figure 2. Hence, it is necessary to optimize the sensor arrangement and the positioning algorithm to precisely determine the AES location. The proposed DWSN arrangement is shown in Figure 3. In the figure, 1∼8 represents the sensor numbers and the corresponding coordinates are listed in Table 1. Sensors 1∼4 are arranged on a plane, while sensors 5∼8 are set on another plane. The arrangement is capable of monitoring the crack development in the cylindrical rock specimens and hence accurately positioning AES.

Schematic three-dimensional diagram of cubic network.

The blind zone of monitoring.

Schematic diagram of DWSN arrangement.
The coordinates (polar coordinates) of AE sensors.
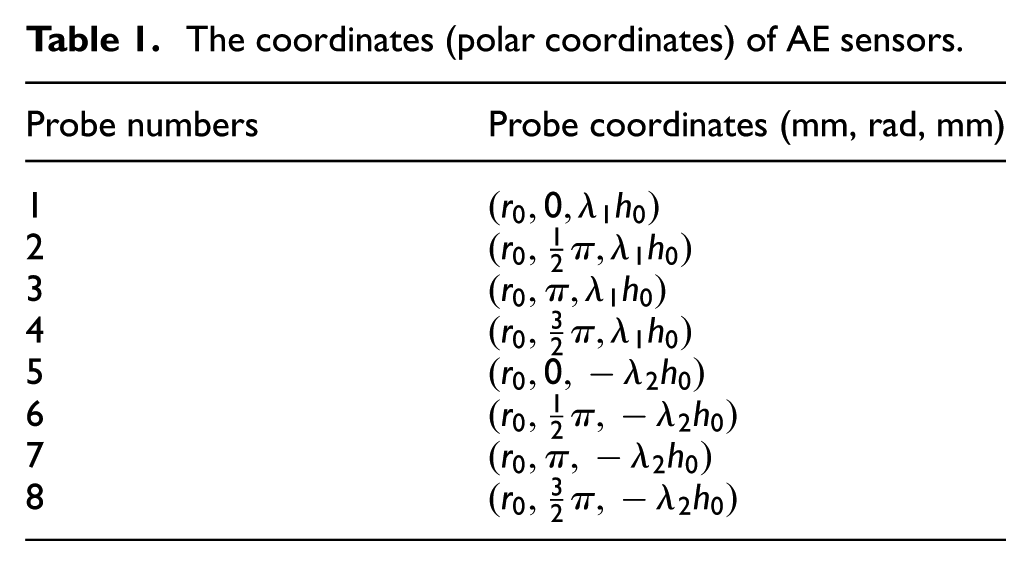
The cylindrical coordinates are displayed in Figure 3. For calculation simplification, the central point O of the cylinder is taken as the origin of coordinates, while the height and diameter of cylindrical rock specimens are set to be


where


Combining equations (6)–(8) produces the following
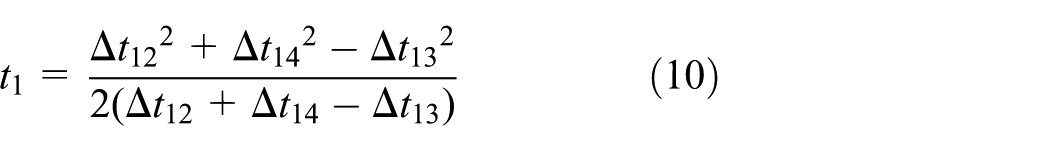
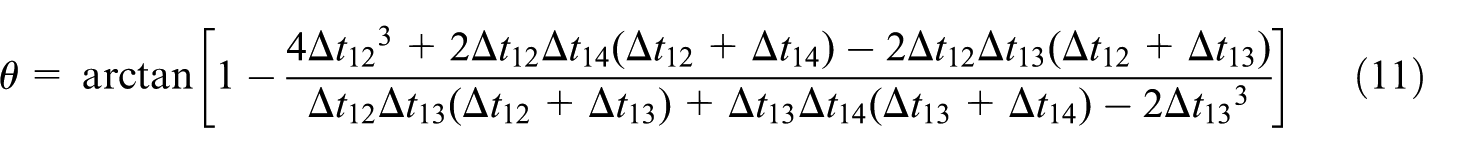
Equations (11) and (12) can be further obtained by combining equations (6)–(8) and (10)

Equation (9) can be rewritten as follows

where
As crack locations in the rock specimens are stochastically distributed, the number of sensors can be increased to form multiple three-dimensional wrap-around monitoring networks to achieve more accurate monitoring results. As shown in Figure 3, eight sensors were adopted to construct a DWSN. Thus, the adjacent five sensors around a crack could form a three-dimensional wrap-around monitoring network. This helps shorten the distance between the AES and the sensors used in the monitoring network, and thus avoid possible signal absence due to the energy attenuation in the propagation process.
The AEA and AE energy-level classification of rock specimens
The AEA, S
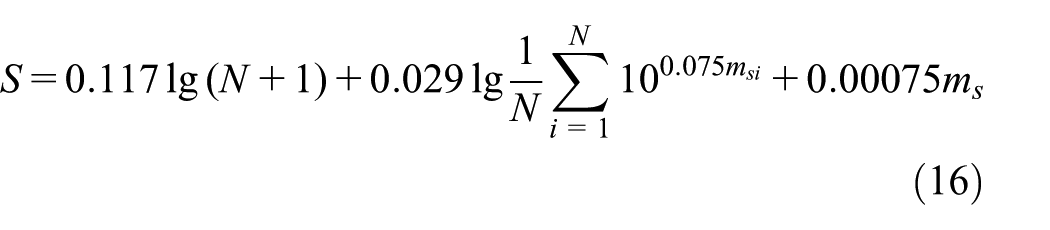
As rock cracking can be taken as a type of microscopic earthquake to some degree, the S of AEA in seismology can be employed for AES monitoring. In 1987, S was introduced based on the fuzzy entropy of a fuzzy set and the Euclidean distance. 15 S consists of seismic frequency, average magnitude or average energy release, maximum magnitude, microscopic concentration degree, and memory effect of seismic dimension. The expression of S is as follows

where N,

where
where N and
AE energy level classification of rock specimens
The initiation and propagation of micro-cracks is the essence of rock damage. Failure has occurred in rock mass units if cracks are generated inside. However, the failure of a single rock mass unit does not affect the strength of the whole rock mass. A rock mass will experience failure only when sufficient rock mass unit failures have occurred.
According to the relationship between the rock strength and overall damage degree, the loss criteria of the strength per unit of rock mass with dissipated energy could be used to get the dissipated energy 20

where
To accurately calculate the energy released by micro-cracks, a time interval of t is taken at the elastic stage and the number of AE events

where
According to the nature of rock mass failure, a certain number of micro-cracks could lead to a small fracture. The propagation of small fractures could form a large one and the connection of large fractures could produce a macro-failure surface. Thus, this research defines the four AE energy levels:

The relationships for the increment among diverse AE energy levels.
Experimental scheme
MTS Landmark 370.50 dynamic/lithostatic load fatigue test system was employed in the experiment, as shown in Figure 5. The monitoring of AES and uniaxial loading test for the rock specimens were conducted simultaneously, while the acquisition of AE signals was achieved using a PCI-2 data acquisition system from PAC Company in the USA. The system was able to collect the real-time transient waves of AE, and to realize the acquisition and process of waveforms and real-time AES location. In the experiment, eight R15a sensors were employed to acquire AE signals. The arrangement of sensors is demonstrated in Figure 6 and the coordinates of sensors are listed in Table 2. The frequency of the sensors ranged between 100 and 400 kHz, and each sensor was equipped with a 2/4/6 C preamplifier. The distances between the sensor and the upper and lower sections for the rock specimens were set at 20 mm. The threshold, the amplification of the preamplifier, and sampling rate of the AES testing system were set at 40 dB, 40 dB, and 2 MSPS, respectively. Furthermore, in order to guarantee the acquisition precision, PDT, HDT, and HLT were set at 50, 200, and 300 μs, respectively. In the meantime, a high-speed camera was used to monitor the real-time surface deformation of rock specimens and to record the transient morphology of rock failure.

The assembled test system.
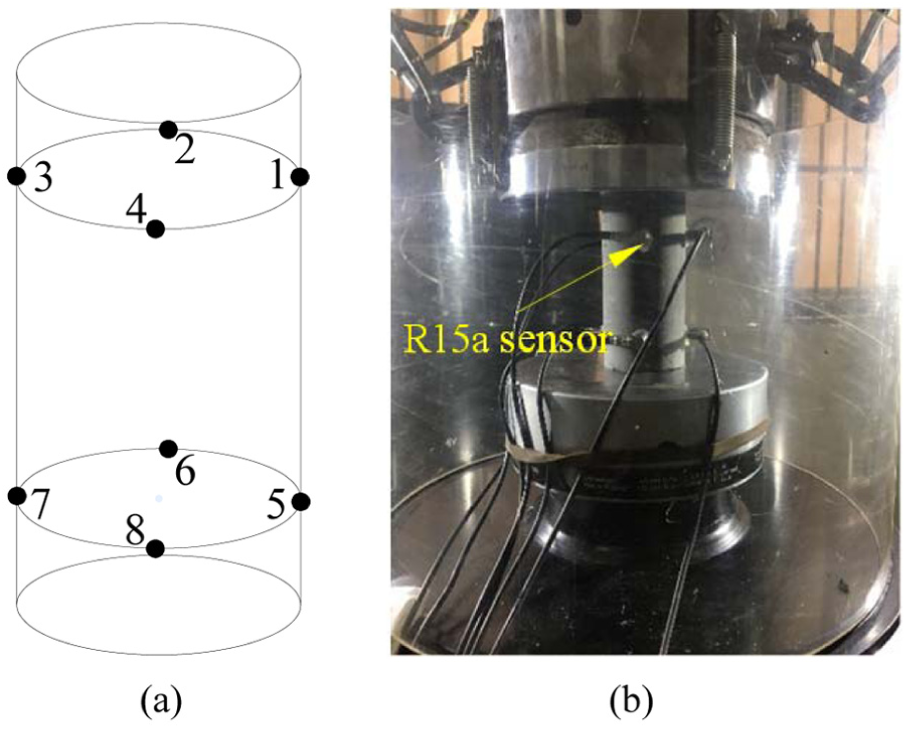
Sensor arrangement. (a) Schematic sensor arrangement. (b) Real sensor arrangement.
The coordinates (polar coordinates) of AE sensors in the experiment.

As shown in Figure 7, the experimental samples were wet-drilled from the sandstone in the roof of Xingan coal mine, Hegang, Heilongjiang Province, with a diameter of 50 mm and a height of 100 mm. The flatness of the end face is less than 0.02 mm. The samples were stored in a well-ventilated place to let them dry naturally for 1 week prior to testing.
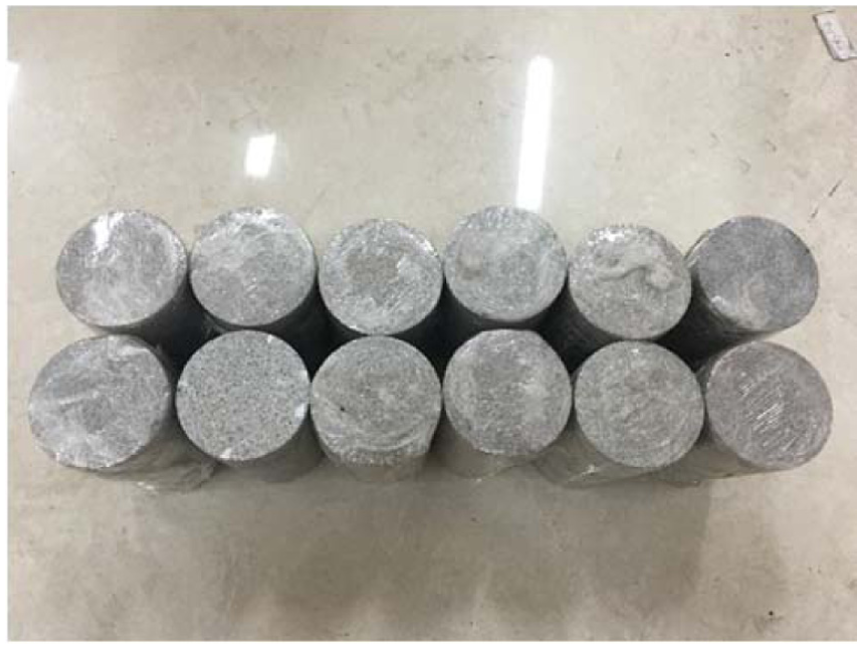
Rock specimens.
Load control method was used to carry out the A and B sets of experiments. Group A was characterized by cyclic loading–unloading at an identical lower stress limit, while Group B featured in cyclic loading–unloading at identical lower and upper stress limits (constant stress difference). The loading rate and unloading rate were set at 0.5 and 1 kN/s, respectively.
Apart from Groups A and B, another group of C was also prepared for determination of the used sandstone UCS strength (
For Group A, the lower stress limit was taken as a variable and was set at 0.05, 0.1, 0.15, and 0.2
For Group B, the difference in the upper and lower stress limits of two consecutive cyclic loading–unloading was taken as a variable and was set at 0.05, 0.1, 0.15, and 0.2
Results and discussions
Characteristics of S for AEA
Based on equation (16), the number of AE events in a cyclic loading–unloading process was taken as a group for calculating S (y-direction) of AEA. Meanwhile, by setting the uniaxial compressive strength as reference value, the normalized peak stress was used as the x-direction to obtain the variation of S in the cyclic loading–unloading process, as shown in Figure 8. The variation of S in the two loading schemes was generally consistent in different stages throughout the test. In the whole loading process, S stayed at a high initial value, then decreased prior to sustaining a low value, and then increased before remaining at a high value again until rock failure. The rocks with compact structure and greater strength in compaction stage mainly underwent adjustment for the compaction of the primary fissure. During this stage, as few cracks occurred within the rocks, there were only a small number of AE signals, and accordingly S was small. Given that the rock specimens belonged to medium-grained sandstone in the experiment, they exhibited large clearances and a loose structure among the internal particles; this research not only conducted compaction on primary fissures, but also penetrated a part of primary fissures in the compaction stage. Therefore, S was greater. Afterward, due to increase in stress, the primary fissures and clearance compacted, causing reduction in the number of AE events, and hence leading to the decrease of S value. While the primary fissures compaction was adjusted, the stress increased and the rock specimens were shown to evolve into the elastic stage. A small number of micro-cracks developed within the rocks. Since this stage was mainly demonstrated by elastic deformation of internal micro-cracks and the development of small portion of cracks, hence there were only few AE events, and S maintained a low value. With the continuous increase of stress, the cracks within the rocks gradually developed and extended, and after reaching yield point, the change in the rock specimens entered into a plastic stage. The development of the cracks in this stage had been most significant: a large amount of cracks were developed and propagated to further form large-sized cracks within the crack specimens, which released a great amount of energy. Hence, this stage not only exhibited more AE events, but also high AE magnitude, causing an increase in S value. Failure stage primarily referred to the formation of large-sized cracks after being penetrated, which formed the surface with macro-fracture: the tip of the large-sized cracks during the loading process tend to produce stress concentration, which causes further enlargement in the size of cracks. Meanwhile, a large number of micro-cracks began to extend from the rock specimen margins and then penetrated to the specimens surface, consequently, forming the macro-crack surface, S at this stage maintained high value. Based on the aforementioned analysis, medium-grained sandstone shows a tendency: initial decrease—maintaining a low value—increase—maintaining a high value, which corresponds to four stages of rocks failure including compaction, elastic deformation, crack development, and crack prorogation.
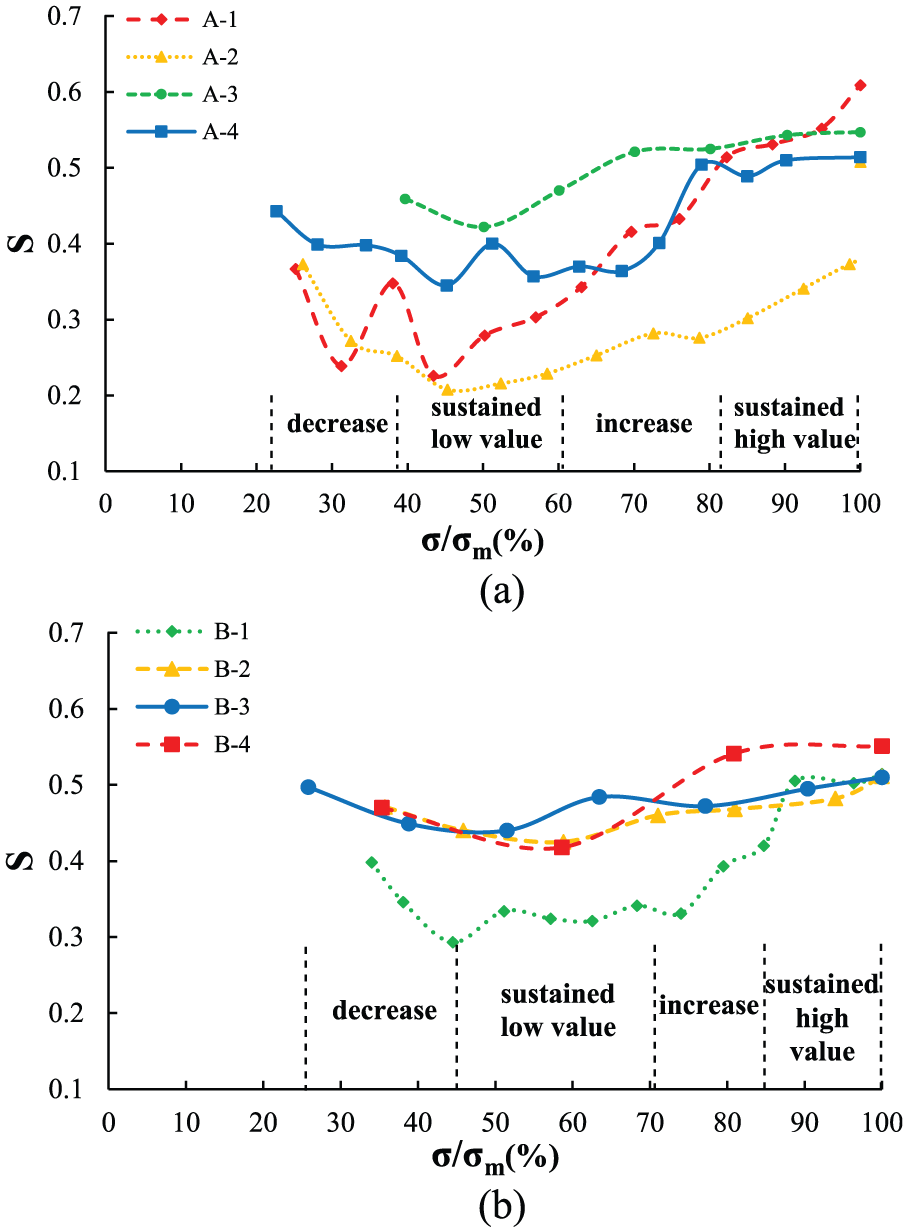
The change law of AEA of the rock specimens. (a) Scheme A. (b) Scheme B.
The analysis of AES location of rock specimens
To verify the accuracy of the DWSN arrangement, equations (11)–(13) were used to calculate the coordinates of the micro-cracks occurring in the rocks so as to locate AES. The morphologies of the micro-cracks and the macro-failure surfaces for the rock specimens were compared, as shown in Figure 9.
The location performance comparison between the morphologies for the micro-cracks and the macro cracks for the rock specimens.
With the proposed DWSN arrangement, the location of the micro-cracks within the rocks exhibited high consistency with the location of visible rock failure surfaces. The failure surfaces based on the recorded high-energy cracks were generally in good agreement with the failure surfaces obtained from the high-speed video camera, validating the high positioning accuracy DWSN arrangement.
To further validate whether the arrangement could precisely locate AES of micro-cracks released with small energy and the AES which was farthest from the sensor, the AES positioning was carried out on the rock specimens at different stages based on the recorded signals. The B-1 rock specimen with apparent AEA under most cyclic loading–unloading was chosen as shown in Figure 8. The AE signals of the B-1 rock specimen during the whole loading process were classified into four stages: compaction stage (1st–3rd cyclic loading–unloading), elastic stage (4th–8th cyclic loading–unloading), plastic stage (9th–10th cyclic loading–unloading), and failure stage (11th–13th cyclic loading–unloading).
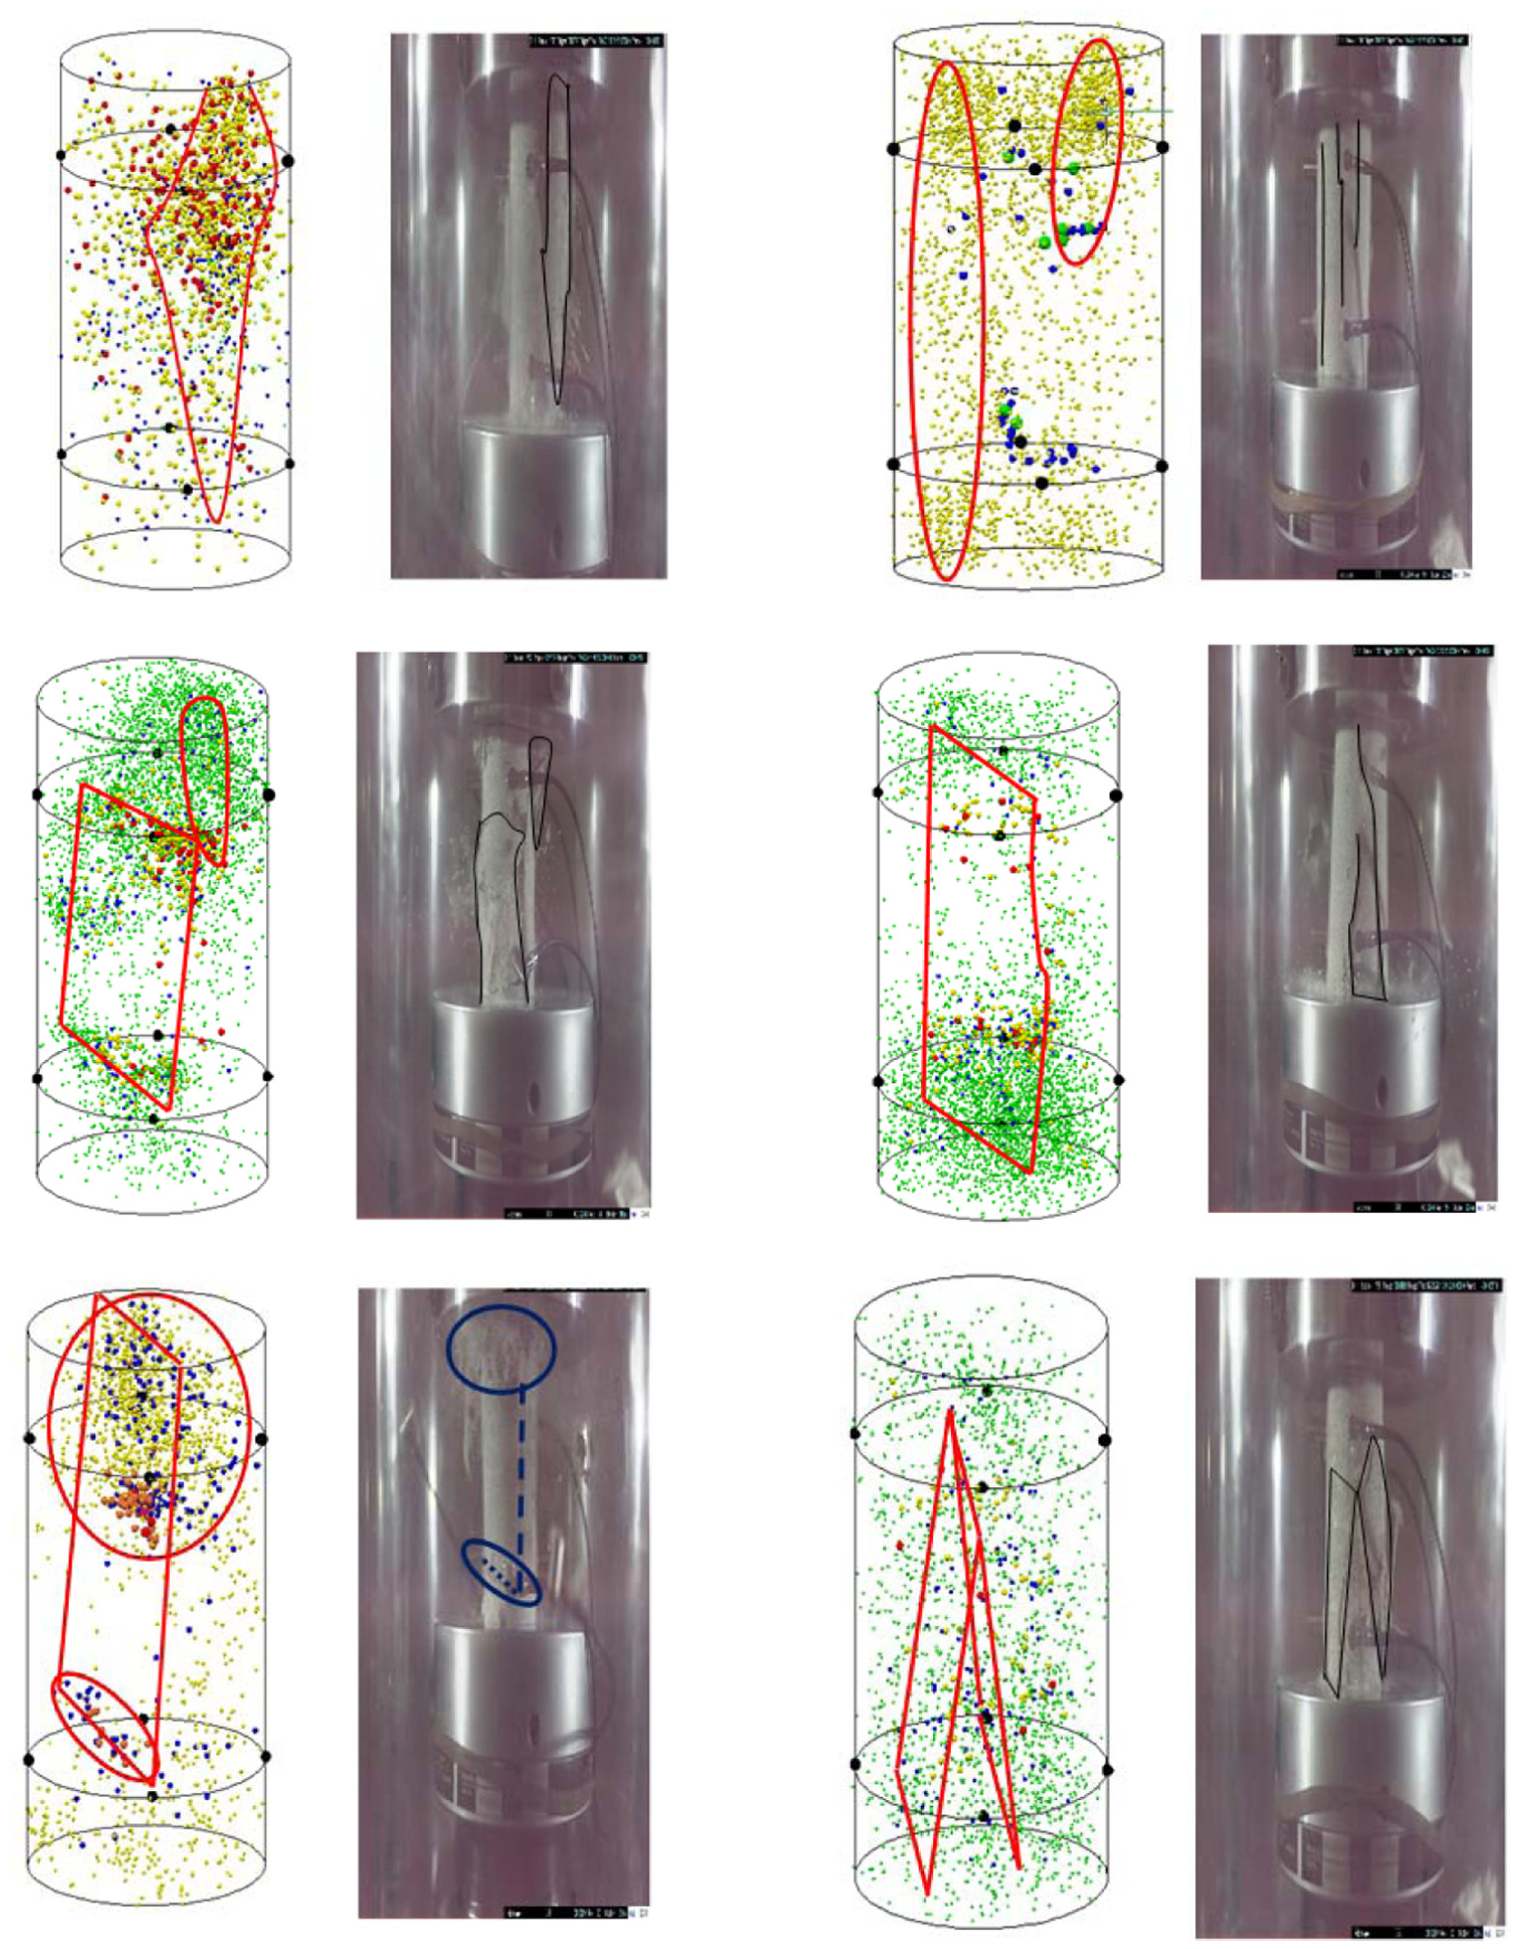
The locations of AES for the rock specimens at different stages during the whole failure process are illustrated in Figure 10, in which (a), (b), (c), and (d) represent the compaction, elastic, plastic, and failure stages. The left part of the figure denotes the location of overall signals, while the right part demonstrates the upper-, and lower-, vertical views for the rock specimens. The number in the middle part of the figure refers to the S- AEA, N, the number of micro-cracks, E, the released energy from micro-cracks, which corresponds to the upper and lower parts of the rock specimens. Yellow, blue, green, and red AES represent the cracks released with energy level E1, E2, E3, and E4, respectively, with values of 7.6E-17∼3.8E-16, 3.8E-16∼3.8E-15, 3.8E-15∼4.22E-14, and 4.22E-14 above. The following conclusions can be drawn from Figure 9:
Compaction stage: the micro-cracks were mainly located at the lower part of the rock specimens. S and N were comparatively higher in the lower part of the specimens than that of the upper part. In addition, small energy micro-cracks (yellow AES), which were located farthest from the sensor on the lower part of the specimens, were all monitored and the majority of cracks were found to be located at the lower part of the specimens. There were nine cracks of energy level E3 and multiple cracks (blue AES) of E2 in the whole compaction stage. Multiple high-energy cracks were generated in regions A and B roughly in a linear distribution, and tended to be connected with each other.
Elastic stage: cracks were concentrated on the upper part of the specimen. There were 13 cracks of energy level E3, and a small amount of E2 cracks and E1 cracks. High-energy cracks were found to be distributed along the axis surrounding the region with a large amount of micro-cracks. High-energy cracks were mainly concentrated in Zones A and a, which were more likely to be connected to form fractures, few cracks occurred in Zones B and b.
Plastic stage: the cracks were distributed at the upper axis of the specimen and dispersed to different directions around. There are two E4 cracks (red AES), ten E3 cracks, and multiple E2 cracks. The S value of the upper part of the specimens reached 0.44 and AEA was higher compared to the elastic stage. In Zones A and a, the specimens had developed several high-energy cracks, most of which were connected and severe damage existed inside.
Failure stage: the failure was primarily concentrated on the upper part of the specimen. There were 8 E4 cracks and more than 20 E3 cracks. The S value of the upper part for the specimen reached a peak value of 0.549. The cracks with 1 and 2 energy levels in Zones A and a were located in the zone surrounding the high-energy cracks, which were connected to each other. The cracks in the B region extended toward the boundary of specimens. The cracks occurring in the A and B regions extended from the axis to the boundary of the specimen and contributed to the formation of macro-fractures on the specimen surface, and the specimen was completely instable.

The failure of B-1 rock specimen at different stages and the location of overall AES. (a) Compaction stage. (b) Elastic stage. (c) Plastic stage. (d) Failure stage. (e) The whole loading process.
Based on the aforementioned analysis, the results of AES located with the DWSN arrangement revealed that high-energy crack zone (C) located by using the AES system corresponded to the c zone on the surface of the specimen. Zone (A) had concentrated cracks of low energy which were quite consistent with the phenomenon in Zone (a). The cracks on the upper part of the specimen subjected to the transient failure were compacted into powder. Furthermore, there was favorable agreement between Zone B formed by high-energy cracks and macro-fracture section (b) for the specimen subjected to failure. These results indicated that the proposed arrangement could locate not only the cracks on the boundary and at the ends of the specimen that were farthest from sensors, but also the micro-cracks of E1 and E2, confirming the higher precision of the proposed arrangement.
Moreover, the development of the cracks generated in the rocks under cyclic loading–unloading was monitored using the DWSN arrangement. The deformation and instability of the rock specimens was accompanied by energy release, and the initiation and propagation of cracks. In the first three stages, micro-cracks were mainly distributed surrounding the zone of high-energy cracks and propagated to different directions. Multiple high-energy cracks were initiated in a linear distribution and tended to be connected. In the failure stage, a large amount of micro-cracks were generated and extended to the boundary of the specimens. This resulted in the expanding of internal fissures and their propagation toward the boundary, which eventually led to macro-fractures. The location of the fissure development is usually the area of serious rock damage. Due to the development of fissures, the effective bearing capacity of the area is reduced, and structural surfaces of weakness appear, thereby causing rock damage. In areas of severe damage, the fractures are more likely to be initiated and propagated due to the decrease in effective bearing capacity, which ultimately leads to rock failure. The final rock failure surface was determined by the evolution process of “low-energy cracking—high-energy cracking—fissure connection.” While micro-cracking mainly resulted in the damage of rock mass, and fissure connection directly led to the instability of rock mass.
Conclusion
The current arrangement of sensors in monitoring AES exhibited shortfalls including the presence of blind monitoring zone and large deviation. This study proposed a DWSN arrangement, which enhanced the monitoring range and improves the location accuracy of acoustic emission source (AES). Furthermore, the crack propagation was researched microscopically, and the results were verified based on the AEA index. The detailed conclusions are as follows:
The positioning of AES was based on polar formation algorithm of circular cylinder. The DWSN arrangement can not only detect the cracks generated on the boundary and at the ends of rock specimens, but also monitor the development of micro-cracks. The failure surfaces based on the recorded high-energy cracks were generally in good agreement with the failure surfaces obtained from the high-speed video camera.
In the loading process, AEA showed a positive correlation with signal amplitude, number of events, and energy release rate of cracks. AEA was also found to be highly coupled with crack distribution and damage degree of rock specimens. In the zones of greater damage degree, both AEA and the crack energy level were higher. With the increase in stress level, the AEA presented a tendency of decreasing—remaining at a low value—increasing—remaining at a high value, which exactly corresponds to the four rock loading stages of compaction, elastic deformation, crack development, and crack connection.
The positioning of cracks of different energy levels and AEA in the loading process was analyzed. The results indicated that rock samples experienced micro-cracking of low energy, micro-cracking of high energy, and crack connection in sequence in the failure process, which shows a high consistency between crack development and AEA. Thus, AEA could be used as an index for assessing the rock failure state. Hence, the proposed DWSN arrangement can precisely monitor rock crack propagation. The future research will be focused on different types of rock specimens so as to enrich the indices for monitoring and determining rock damage.
Footnotes
Handling Editor: Feng Hong
Declaration of conflicting interests
The author(s) declared no potential conflicts of interest with respect to the research, authorship, and/or publication of this article.
Funding
The author(s) disclosed receipt of the following financial support for the research, authorship, and/or publication of this article: The authors gratefully acknowledge financial support for this work provided by the Fundamental Research Funds for the Central Universities (2018ZDPY02).