
Abstract
A new testing method was introduced to apply moving-axle loads of a subway train on a track structure. In order to investigate the dynamic responses of the shield tunnel subjected to moving-axle loads, a series of laboratory model tests were conducted in a 1/40 scale model tunnel. The influences of the axle load, the wheel speed, and the cover depth of the shield tunnel on the vertical displacement and acceleration of the lining were presented and discussed. Parametric studies revealed that the vertical displacement–time history of the lining presents a “W” shape due to the combined action of two axles of a bogie. The peak value of the vertical displacement increased with the axle load linearly, while it decreased with the increase in the cover depth. Moreover, response time of the displacement decreased with the increase in the wheel speed, but the peak values remained stable at the same level. Finally, a three-dimensional dynamic finite element model was adopted to simulate the movement of the axle loads and calculate the responses of the lining. The numerical results analysis agrees well with experimental results.
Introduction
Owing to the increasing demands of more convenient and more comfortable traffic systems, the various subway tunnels are being constructed in compactly populated urban areas. The development of subway transport network relieved the urban traffic crowding more effectively but a running train timely produced vibrations to the residential areas and buildings, which may irritate populations and create a tribulation to sensitive equipments. 1
The vibrational waves are such waves which can be generated by the dynamic interaction between rough wheels and uneven rail tracks and transmitted through the track bed and the segments into the surrounding soil.
In general, the vibrations and numerical and analytical testing methods were intensively studied during the last few decades. These vibrations are introduced by moving subway trains and have been widely studied using various numerical methods.2–7 These studies have paid more attention to the environmental issues such as analyzing the wave propagation, calculating the ground vibrations, and isolating vibrations in the structures. The dynamic responses of a cylindrical tunnel due to traveling loads are based on analytical approaches which were analyzed by Datta et al. 8 and Guan and Moore. 9
Most of the model tests, especially centrifuge tests, were conducted to understand the effects of seismic loading on the dynamic behavior of tunnels.10–12 It should be noted that only limited experimental research has been carried out directly to apply dynamic train loads on tunnel tracks 13 and railways.14,15 However, these cyclic compression loads were applied to the fixed positions on the model track in these fixed-point loading tests have ignored the actual moving of the loads.
Recently, a model test apparatus was developed to study the deformation characteristics of railway roadbed in which a loading wheel with the constant vertical load moves repeatedly along the rail,16,17 As a result, the deformation mechanism of substructures subjected to a moving-wheel load was quite different from that in the fixed-point loading tests. Therefore, it seems that the fixed-point loading tests are not suitable for predicting the mechanical behavior of shield tunnels under actual train loading.
In this article, a new testing method was put forward to evaluate the dynamic characteristics of shield tunnels subjected to moving-axle loads. In this new method, the speed and weight of trains can be well controlled in the test, and the vibration response and deformation of the existing tunnel can be well monitored and captured. A series of laboratory model tests were performed in a model tunnel which was suppressed in a sandy soil. Special attention was paid to the effects of the axle load, the wheel speed, and the cover depth on the dynamic properties of the lining in terms of the vertical displacement and acceleration.
Finally, a three-dimensional (3D) numerical model was proposed to simulate the moving-axle loads and examine the dynamic responses of shield tunnels based on the finite element (FE) method. The simulated displacement and acceleration results of the lining were compared with those of model tests to verify the validity of the moving-axle loading test.
Model test design
Comparing with the dynamic excitation due to surface irregularities of the wheels and rails, the quasi-static excitation which is independent of the dynamic wheel-rail interaction and can be easily determined by moving the axle loads. 18 Kim and Kim 19 designed a model train that moved forward in a 1/20 scale model tunnel to generate the train-induced unsteady flow. Later, a running train test with constant vertical load was conducted in a 1/40 scale model tunnel in this study. The axle load, the wheel speed, and the cover depth of shield tunnels were kept variable.
Soil sample
It is very difficult to fabricate a model soil which completely meets the mechanical properties of the prototype based on the resemblance model. In general, the model ground has been fabricated according to a single typical soil layer such as the gray silt clay in Shanghai area 20 and the Speswhite kaolin clay. 21 In addition, it is unreasonable to use the model soil repeatedly in various cases of the model test. In this study, a clean and dry sandy soil was used to investigate the general law of dynamic characteristics of shield tunnels. It was filled into a box with internal dimensions (length × width × height) of 1400 mm × 640 mm × 1100 mm (Figure 1).

Model test box and EPS board arrangement.
Parameters of the sandy soil are listed in Table 1. In this table, Cu is the uniformity coefficient, Cc is the curvature coefficient, ρdmax is the maximum dry density, ρdmin is the minimum dry density, ρd is the dry density of the sandy soil, e is the void ratio, and Dr is the relative density. The internal friction angle (φ) and cohesion (c) were measured by conventional triaxial compression tests. The compression modulus (Es) was obtained from consolidation tests. Expanded polystyrene (EPS) boards, 20-mm thick in the length direction and 100-mm thick in the width direction were pasted on the inside walls of the box to prevent the reflection of the propagating waves back into the soil as shown in Figure 1.
Physical and mechanical properties of the sandy soil.

Model shield tunnel
The 1/40 scale model shield tunnel was composed of the lining, the track bed, rails, and sleepers. The construction of the model tunnel was mentioned as following.
First, a polyethylene (PE) pipe with an outer diameter of 160 mm and inner diameter of 141 mm was cut into many rings having 30-mm length for each that were used as the lining. The rings were used to assemble the lining one by one through six pairs of screws and six pieces of plastic sheets as shown in Figure 2(a).

Fabrication process of the model tunnel: (a) assembling of the lining, (b) monolithic track bed, and (c) completed model tunnel.
Second, water and gypsum powder were mixed together at a mass ratio of 1:1.5, and the mixture was then poured into the assembled lining to mold the monolithic track bed with 510 mm length (Figure 2(b)). Finally, the model rails and sleepers were made by acrylic sheets, and the sleepers were stuck on the rails at a spacing of 14 mm using chloroform (CHCl3) and the spacing of the rails was 28 mm, which were determined to be 1/40 scale of the actual spacing of the railway. Here is a special description of the similar proportions in model tests. Some structural prototype structures are complex, and the structures that cannot be embodied in the scale model will be simplified. The dynamic performance of the simplified model is different from the prototype structure. However, in this experiment, we have made the maximum similarity between the model and the prototype. The vibration response of the prototype tunnel structure can be calculated according to the similarity relation. What’s more, the approximate range of error produced by size effect can be summed up by this test.
After the solidification of the track bed, the sleepers were fixed on it using the mixture (Figure 2(c)). In other words, the sleepers were embedded in the track bed whose thickness was 16 mm in total. In addition, uniaxial compressive strength tests (Figure 3) were conducted on the gypsum specimens to obtain the compressive strength of the track bed which was 8.16 MPa on average.
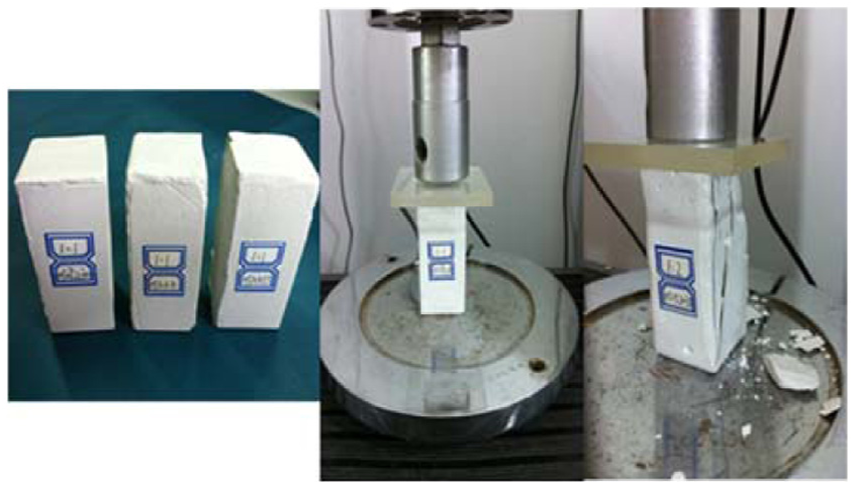
Uniaxial compressive strength tests of the gypsum specimens.
Moving-axle loading
The schematic diagram of the moving-axle loading in the model tunnel which was buried in the sandy soil is shown in Figure 4. The moving-axle loading device essentially included the model flatcar with iron weights and drive motor equipped with an automatic speed controller.

Schematic diagram of the moving-axle loading.
As shown in Figure 5(a), similar to the carriage of Shanghai Metro train, the 1/40 scale model flatcar consists of two bogies, four axles, and four pairs of wheels. The distance between two adjacent bogies is 393 mm and between the axles is 63 mm. The length and the width of the flatcar are 570 and 100 mm, respectively. Different numbers of iron weights are put on the flatcar to apply three different vertical loads which are 63.70, 118.09, and 155.33 N. Compared to the iron weight, the weight of the flatcar can be ignored. Therefore, it is equivalent to the vertical loads, the axle loads are 15.93, 29.52, and 38.83 N. The flatcar is connected to the string at the front and the string is attached to the drive motor equipped with a speed controller. The drive motor begins to pull the flatcar moving along the rails at constant speeds of 0.181, 0.338, and 0.665 m/s.
Photographs of the experimental procedure: (a) tamping the sandy soil and (b) completed model.
Experimental program and procedure
The cover depth has a significant influence on the dynamic responses of shield tunnels subjected from moving-axle loads. Therefore, the effects of the ratio (C/D, D = 0.16 m) of cover depth (C) to outer diameter (D) as well as the axle load (P) and the wheel speed (v) was studied in the tests. Fifteen groups of different test variables values were performed in this study as listed in Table 2. These test variables were labeled as A1 ∼ A5, B1 ∼ B5, and C4 ∼ C5. In connection to this; A1 means C/D = 0, P = 15.93 N, and v = 0.181 m/s. The effects of the ratio of cover depth to outer diameter, axle load, and wheel speed were analyzed individually in the test results. While keeping the wheel speed and the cover depth constant, the tests A1, A2, and A3 were implemented to evaluate the effects of the axle loads on the dynamic response of the lining.
Experimental program.

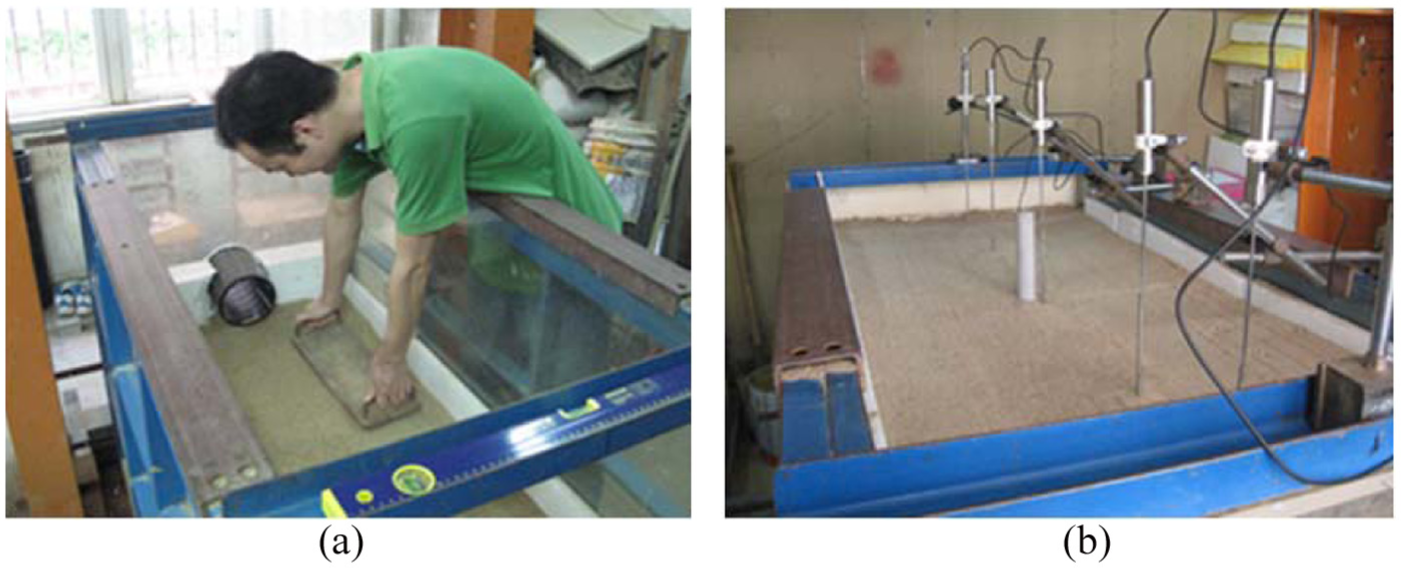
The procedure of the model tests is shown in Figure 5. Four buckets of the sandy soil were poured into the box and tamped to 100-mm thick layers as listed in Figure 5(b), in order to approach the relative density (Dr) of around 0.685. After the layered soil reached the height of 441 mm, the model tunnel was placed on the flat soil. Then, an acceleration transducer and five hollow steel pipes were installed at the measuring points (AA and VD1∼VD5) as is shown in Figure 6. The tunnel headroom was limited; the acceleration transducer was installed on the external surface of the lining and segregated from the surrounding soil. The inner bar was connected to the linear variable differential transformer (LVDT), and it was segregated from surrounding soil by the hollow steel pipe for the purpose of measuring the vertical displacement of the lining under the ground. Resulting sandy soil was filled continuously up to the design height as mentioned in Figure 5(b). After the completion of the model construction, the drive motor pulled the flatcar with a constant vertical load passing through the tunnel at a constant speed. It is noted that only one variable (P or v) was changed in a completed model and the tests A1, A2, and A3 were carried out in a model with different loads.

Layout of the measuring points (unit: mm).
Model test results and discussion
Vertical displacement–time history
The time history curves of the vertical displacement are shown in Figure 7 for tests A2 and A3. It can be observed that the vertical displacement curve displays a “W” shape, in which the displacement reached at the peak level when a moving bogie passed the measuring point. This indicates that two axles of a bogie generate a displacement at peak of the lining. The total numbers of the peaks correspond to that of the train bogies. It can also be summarized that the load distribution of the adjacent bogies overlapped in the longitudinal direction of the lining. The displacement gradually returned to zero after the passing of the second bogie. It can be recognized to the elastic deformation of the lining under short-term loading. In context to this, the bending stiffness at the boundary is less than that at the middle part of the lining. The peak values of the points were located at both sides, but VD1 and VD5 of the lining are larger than that of the middle points VD2, VD3, and VD4.

Time history curves of the vertical displacement for the tests: (a) test A2 and (b) test A3.
Effects of axle load on displacement
The displacement–time histories for typical measuring points are presented under different axle loads in Figure 8. It can be seen that the peak values of the points increased with the axle loads but “W” shape of the vertical displacement curve remain unchanged. The relationship between the peak value and the axle load remained linear as shown in Figure 9. The axle load was increased from 15.93 to 29.52 N. At the same time, the average increase in the peak values was 105%, which was larger than the 85% increase in the load.

Time histories of the vertical displacement under different axle loads: (a) C/D = 0, Point VD1; (b) C/D = 0, Point VD2; (c) C/D = 0, Point VD3; and (d) C/D = 2, Point VD5.

Peak values-axle loads relationships.
Effects of wheel speed on displacement
The time histories of the vertical displacement are plotted under different wheel speeds as shown in Figure 10. It is obvious that the response time of the displacement decreased with the increase in the wheel speed. Although the increasing speeds “compress” the displacement curves, the peak values remain stable at the same level in the tests.

Time histories of the vertical displacement under different wheel speeds: (a) C/D = 0, Point VD1 and (b) C/D = 1, Point VD5.
Effects of cover depth on displacement
The displacement–time histories and the peak values of the point VD1 were controlled under different cover depths by outer tunnel diameter in Figure 11. According to Figure 12, with the increase in C/D from 0 to 1 and then to 2, the displacement peak values first decreased markedly (average decrement of 0.013 mm) and then experience a slight decrease (average decrement of 0.002 mm). This result indicated that the soil cover above the tunnel restricted the vertical displacement of the lining effectively and the peak values gradually decreased with the increase in the cover depth.

Displacement–time histories under different cover depths normalized by outer tunnel diameter: (a) P = 29.52 N, v = 0.181 m/s; (b) P = 38.83 N, v = 0.181 m/s; and (c) P = 29.52 N, v = 0.338 m/s.

Relationships between peak value and cover depth normalized by outer diameter.
Acceleration time history
The acceleration time histories of the point AA were obtained in Figure 13. It is proved that the vibration was random because of the unevenness of the rails so that the data was not suitable for evaluating the influence of the variables on the acceleration response of the lining. Since; it was difficult to make an ideal model flat track in laboratory and acceleration response of the lining was studied using a FE numerical model.

Acceleration time histories of the point AA: (a) Test A3 and (b) Test C3.
FE simulation
In order to verify the moving-axle loading test, a 3D numerical model was developed using the ABAQUS software. The model tests were performed to examine the dynamic responses of shield tunnels subjected to moving-axle loads, but the sandy soil was chosen as the model soil whose mechanical strength does not meet the similarity ratio under the elastic deformation condition. The vertical displacements of the tests did not agree well with that measured data under the actual moving-axle loading of a subway train. Therefore, numerical simulation was used to verify the data of the vertical displacement–time history of the lining rather than the peak values.
Numerical model and material properties
A 3D FE model was established, which has a width of 31 m, a length of 15.7 m in the longitudinal direction, and a depth of 50 m as in Figure 14. In comparison to geometrical symmetry with the shield tunnel of Shanghai Metro Line No. 4, the soil-tunnel system was considered for half an hour in this simulation. The outer diameter of the tunnel was 6.2 m and the cover depth stabilized by the outer tunnel diameter is 2.2 m. The width and thickness of the segment were 1.2 and 0.35 m. In order to shorten the numerical model, the tunnel was buried in the homogeneous silty clay in Shanghai area.
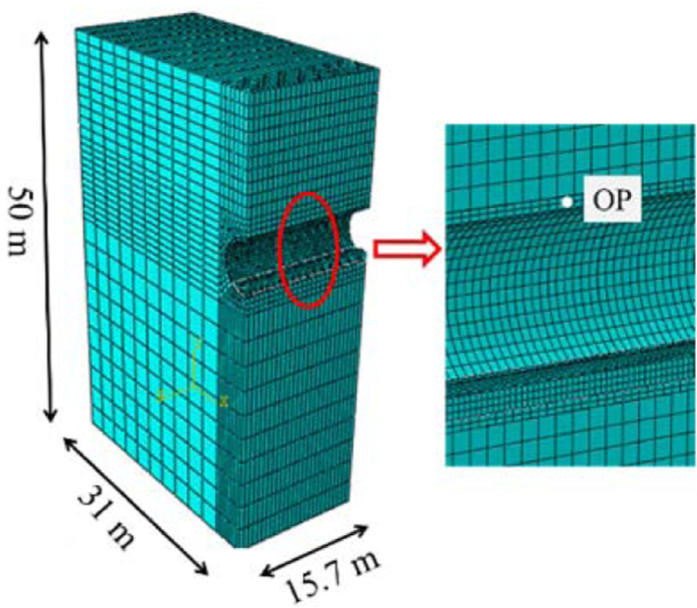
3D finite element model.
While considering the lowest shear wave velocity of the silty clay, the element size of the rail, track bed, lining, and soil were determined to be 0.1, 0.2, 0.3, and 1.2 m, respectively. The structure can be anticipated to undergo small elastic deformation under short-term loading and the linear elastic model can be used for the dynamic analysis. The hexahedral eight-node reduced integral element (C3D8R) was used as the model of the soil and the tunnel. The concrete strength of the segment and the track bed were classified as grade C55 and C40, respectively. The properties of the material such as the silty clay, the lining, and the track bed are given in Table 3.
Material properties of the soil and the tunnel structure.

Soil-structure interaction and visco-elastic artificial boundary
The interactions of different materials are defined as follows.
The stiffness and damping coefficient of the fastener which was connected with the rail sleeper are 3.0 × 10⁷ N/m and 7.0 × 10⁴ N s/m. The bottom surface of the track bed was tied with the inner surface of the lining. The Coulomb friction coefficients between the lining and its surrounding soil and between the linings are assumed to be 0.88 and 0.62, respectively. 22 The bolts were embedded into the adjacent segments to simulate the connection in the longitudinal direction. Gu et al. 23 developed a consistent viscous-spring artificial boundary. Parameters of the boundary include the normal spring stiffness (KN), damping coefficient (CN), tangential spring stiffness (KT), and damping coefficient (CT), which can be calculated as


where coefficients αN and αT are 4/3 and 2/3, respectively. G is the shear modulus, R is the distance from vibration origin to the boundary, and ρ is the mass density. Cp and Cs are the P and S wave velocities, respectively.
Subroutine of moving-axle load and Rayleigh damping
A carriage with the axle load of 169.5 kN moved along the rails at a speed of 72 km/h. The distances between two adjacent bogies and between the axles were 15.7 and 2.5 m. The moving-axle load was programmed by the user subroutine and was then embedded into the ABAQUS program. The Newmark-β implicit integration scheme was selected to solve the equation. The Rayleigh damping coefficients, α = 0.5573 and β = 0.0045, were obtained from analysis of the vibration mode and a time increment of 0.005 s was used.
Numerical simulation results
The time history of the vertical displacement of the observation point OP located at the middle lining can be seen in Figures 14 and 15. The acceleration time history of the point OP and the corresponding Fourier spectrum are illustrated in Figure 16. The “W” shape of the displacement–time history obtained from the numerical model has a decent arrangement with the model test results which proved that a displacement peak of the lining was generated by the two axles of the bogie together. This conclusion is in agreement with the model test conclusion. The peak value of the vertical displacement was 0.12 mm when the first bogie left the tunnel and the acceleration of the point OP reached at the peak value of 0.03 m/s2. The acceleration frequency spectrum is presented in Figure 16. It is indicated that the dominant frequency lied in range between 0 and 20 Hz due to the moving-axle loads of the train.
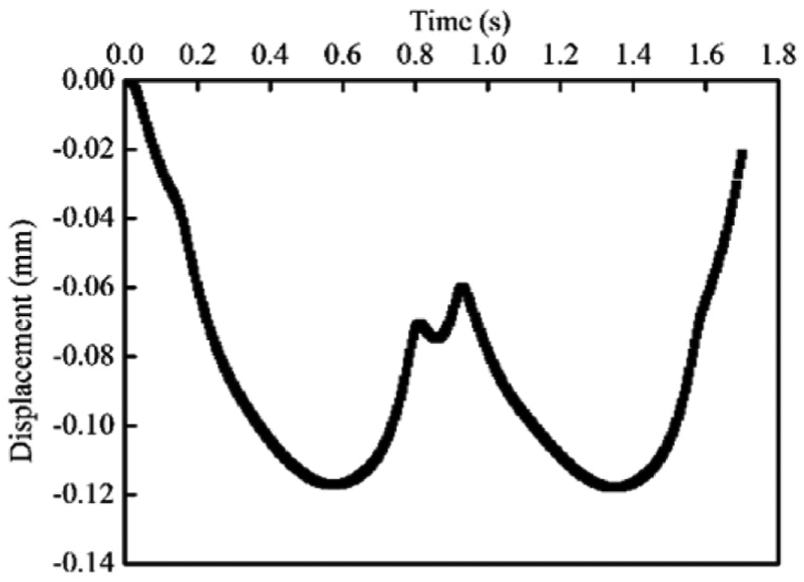
Time history of the vertical displacement of the point OP.

Acceleration time history of the point OP and corresponding Fourier spectrum.
Conclusion
The primary aim of this study was to introduce a new testing method for application of moving-axle loads of subway train on track structure. The vertical displacement and acceleration of the lining induced by the moving-axle with different axle loads, wheel speeds, and cover depths of shield tunnel were measured. The following conclusions can be drawn from this study:
The time history curve of the vertical displacement presents a “W” shape, which means a displacement peak of the lining was generated by two axles of the bogie together. Due to the elastic deformation of the lining under short-term loading, the displacement gradually returned to zero after the past of the second bogie.
The peak value of the vertical displacement increased linearly with the axle load. The response time of the displacement decreased with the increase in the wheel speed, but the peak values remain stable at the same level. The peak values gradually decreased with the increase in the cover depth because of the restriction of the covered soil above the tunnel.
The “W” shape of the displacement–time history obtained from the numerical simulation agreed well with that of the model test results. The dominant frequency range of the lining lied between 0 and 20 Hz due to the moving-axle loads of the train.
Footnotes
Acknowledgements
The authors sincerely appreciate the reviewers’ valuable comments and suggestions which helped the authors to improve this paper greatly.
Handling Editor: Hongyan Ma
Declaration of conflicting interests
The author(s) declared no potential conflicts of interest with respect to the research, authorship, and/or publication of this article.
Funding
The author(s) disclosed receipt of the following financial support for the research, authorship, and/or publication of this article: This research was supported by the National Natural Science Foundation of China under grant no. 41172238. China Railway 20 Bureau Group Co., Ltd. has also given a lot of practice guidance in the study of the paper.