
Abstract
There are many natural conditions in the world, such as floods and earthquakes that cause major accidents. The actual question is how to anticipate and predict such events, which enables us to prepare ourselves in advance. We are interested in the advance classification of incoming calls to the smart city 112 public safety system for Ljubljana, the capital city of Slovenia, and the whole country. We used open Internet of Things data for Ljubljana and the whole of Slovenia for the years 2013–2016. Using different classification methods, different models were obtained and compared with each other. We have provided a report on how accurate the forecasts are and what classification result differences occur when different models or data of the capital city or the whole of Slovenia are used. The results obtained are a sound basis for further work on improving the classification in advance of incoming calls to the smart city 112 public safety system.
Introduction
There are many natural conditions in the world, such as floods, earthquakes, and tsunamis, which lead to major damage and casualties. Information on such events is collected by 112 public safety systems and next-generation systems of 112 systems (NG112).1,2 A significant amount of research has been invested throughout the world in efforts to predict, monitor, and help involved people both in the control rooms and on the ground.
Public safety is also a topic dealt with in smart cities initiatives. 3 Current research is used to improve situational awareness 4 for various events and dangers. The growing use of social media during crises offers new information sources from which the right authorities can enhance emergency situational awareness. Crowdsourcing platforms, such as the 112 public system, 4 are becoming increasingly interesting. In Sakaki et al., 5 they investigate the real-time interaction of events and propose an algorithm to monitor tweets and to detect a target event. They devise a classifier of tweets based on features such as the keywords in a tweet, the number of words, and their context.
The first question of interest is how to establish such a system for the natural crisis and disaster, but also for other various events with the aim to increase the situational awareness. The answer has been sought by engagement of social media, 6 and depicting ways to deal with crisis management. 7 The second question that arises is how to anticipate the range of events, disasters and accidents in advance as we do not know to what extent these disasters and various events will occur in society and nature.
One way to address these questions is using open Internet of Things (IoT) data to increase situation awareness. The area of open IoT data has not yet been explored exhaustedly so far. The advantage of such sensors (open IoT data) is that they are already there, and their data can be used.
In this article, we explore how these disasters and various events will affect the number of incoming calls to 112 public safety system. In contrast to the case in Sakaki et al., 5 where they use social networks and tweet analysis, we will in our case use open IoT data for this purpose and classify incoming data according to the volume of incoming calls.
The goal of the research is to find out to what extent we can use open IoT data for forecasting of 112 calls and what is the accuracy of such forecasts. The obtained information will be helpful for special services, as it will allow to mitigate risks in advance and plan the usage of available sources at hand. Based on this, the ambulances, the police, and other involved parties can be prepared in advance for disasters. Hence, the proposed solution can improve the situation awareness.
Our goal is to define a classifier for forecasting the number of incoming calls to the 112 public safety system of the capital city Ljubljana. We will use open IoT data for the city and also the whole of Slovenia for the years 2013 till 2016. Using different classification methods, we prepare different models and then compare them with each other. We are interested in how accurate the forecasts are, and what the classification results differences are when we use different models or data for Ljubljana, the capital of Slovenia, and for the whole country.
Related work
The current work on the topic of smart cities and public safety has attracted a lot of attention in the world and is ongoing. In Santa Cruz, California, USA, local authorities analyze historical crime data. 8 Each day, the analytical tools generate a list of 10 places where property crimes are more likely to occur; police efforts are then focused on these places even if the officers are not responding to a specific emergency. In 2015, Natal, a city in north-eastern Brazil, joined the IEEE Smart City initiative. This smart city initiative 9 aims to improve public safety. A Blueprint for Smart Public 10 by the National Institute of Standards and Technology (NIST) also contains public safety as an essential element of a smart city. It deals with firefighters, emergency, and rescue teams.
The issue that is currently increasingly relevant is climate change since it is very likely 11 that extreme heat waves and heavy rainfall events will become more frequent. In Jabareen, 12 conceptual frameworks for resilient urban and other communities with the goal of making cities more flexible are covered.
IoT for smart cities is studied in Abreu et al. 13 In Brookes and Hutton, 14 various aspects of Public Safety and Emergency Services regarding IoT are presented. Another increasingly relevant dilemma is the use of social networks. The detection of events for emergency calls to 112 using social networks in real time is given. 15 The issue of obtaining data can be solved using crowd-sensing data, as discussed in Sakaki et al. 5 Researchers are also working to increase situational awareness. A social media crisis mapping platform and statistical analysis were used in Middleton et al. 4 to generate a real-time crisis map. Crisis management is studied in Middleton et al. 7 How to increase situational awareness is discussed in Yin et al. 6
Prediction and risk modeling are also topics of investigation. Natural disasters, such as floods, are one subject. In Hossain et al., 16 a 5-day forecast of river levels inside Bangladesh was presented. The risk model for a short period (2 or 3 days) is given in Ma et al. 17 In Duan et al., 18 a model of regional flood risk assessment with factors including rainfall, topography, water density, and population density is presented, and gross domestic product (GDP) was selected to build the model. Other prediction models were also studied. In Ballesteros et al., 19 the authors evaluate the ability of existing forecasting techniques to predict future safety values: predicting crime, safety indexes, and personalized context safety. An emergency call center with a fuzzy-based decision support system that aids in resource planning is presented in Barrientos and Sainz. 20 In Merkuryeva et al., 21 the state-of-the-art in flood forecasting and simulation applied to a river flood analysis and risk prediction is presented.
Traffic modeling is also covered when dealing with call centers, such as the 112 public safety system. There are traffic models for calls to the first level (where all the calls are collected) and models for calls at the second level (calls forwarded to firefighters, ambulances, and police). The general model for a given hour using the Poisson model is given in Tandberg et al. 22 In Aschenbruck et al., 23 a traffic study and modeling of calls to the 112 public system based on real-time data are made. In Jasso et al., 24 linear regression was used for traffic prediction. Similarly, in the case of the Portland Oregon area (USA), 25 by additionally using spatial distribution of calls and attribute selection (stepwise regression), regression is used. Traffic models for calls to the police are given in the literature.26–28 In Olligschlaeger, 26 weapons-related calls are dealt with, with the city being split into smaller parts. Traffic models for rescue calls are given in Zuidhof 29 and Viglino. 30 In Zuidhof, 29 Poisson’s call distribution is used. In Viglino et al., 30 attributes such as day of the week, holidays, holidays, times of epidemics, and longer time trends were used for forecasting, with 17 attributes together. The model was applied to 1.8% of the French population.
This article is organized as follows. First, the public safety system in Slovenia is described. Then we explain the used data sets and the classification techniques. Finally, we provide the results from the classification and conclude.
Public safety system for the smart city
112 Public safety system sin Slovenia
112 System in Slovenia
112 is the common emergency telephone number that can be dialed free of charge from any stationary or mobile phone. In addition to the conventional 112 system, 2 the system may include other features, such as eCall and NG112. eCall provides automated emergency calls from cars. NG112 1 enables calls using VoIP, text messaging, instant messaging, real-time text, pictures, and videos; it can also provide emergency services with more data, such as telemetric and health data.
The 112 system operates in two levels. On the first level, the operator in the control room accepts a call to the 112 system. On the second level, if necessary, this operator transfers the call to one of the emergency services, such as firefighters, ambulances, and police. At present, there are 13 regional 112 public safety system centers in Slovenia. Figure 1 shows the distribution of these regional centers.

Map of Slovenia with regional 112 public safety centers. 31
Public safety system architecture for smart cities
The public safety system architecture 32 for smart cities integrates different types of incoming incident and emergency requests, external interfaces, and warning devices. Incoming requests can be from eCall, 112 calls, video surveillance systems, and open data or from various types of sensors or IoT devices. In addition, the telephone information is considered as information generated by a human sensor. Such a system can be operated for different use cases for the given integrated solution (e.g. safe city, smart city, 112 emergency system). Within the system, there are parts for receiving the input signals (event handling), prediction modules (e.g. module for prediction of numbers of incoming calls to 112 system), the Public Information and Notification System (PINS) and the operators’ workplace. The public safety system architecture is shown in Figure 2.

Public safety system architecture. 32
Incoming data
In general, any sensor or external system can be used as an input to the system. Depending on the data received, the system or the operator checks the extent of the danger. In the next step, the relevant scenario is to be executed manually or automatically; if notification is necessary, it is made.
The system can accept data from different sensors intended for floods, for example, water level, the amount and intensity of precipitation, the type of precipitation, wind speed and direction, the temperature and relative humidity of the air, as well as absolute and relative atmospheric pressure. The data can be obtained directly from the sensors, or from organizations that collect sensor data. In addition, the system enables the accepting and processing of data of other types of sensors that are not intended for floods, such as sensors for natural gas, fire, and earthquakes. Data can be received from systems for eCall, 112 calls, NG112 calls, and others.
Working operator
112 operators in the control room, working at the first level, receive and process all types of incoming requests in the system. They enter the main characteristics of the incident into the system database, perform analysis, and transfer the data on the accident, including the incident report, to appropriate emergency dispatch services. The operators’ dashboard is shown in Figure 3.

Operator dashboard: (a) incoming emergency request and (b) warning zone with warning devices on GIS map.
Prediction module for the 112 system
With the prediction module for the 112 system, we wish to predict (including conducting classification, regression, etc.) the number of calls to the system for different cases (e.g. for rain, floods, mild weather, summer, winter, etc.). With this, we can prepare the plan for the emergency system (number of employees) as well activities for risk mitigation. With its prediction system and more accurate assessment, this module provides an improvement for public safety.
Notification system
Public warning is the capability to bring to the immediate attention of all people who might be directly impacted following the onset, or predicted onset, of an emergency, so that they can take action to mitigate the impact of this incident. The PINS is intended for mass communication for national, regional, and local approaches.
Data preparation for the simulation
Predispositions for the data preparation
We began with these starting points for the data preparation:
We are interested in the data for the smart city of Ljubljana, but we will also use the data for the whole country. The city’s population is 15% of the total population of the country. The number of incoming calls to the system 112 is 25% of all calls.
In our case, the real data observed were the statistics about the total number of all incoming calls to the regional 112 centers per day. Due to the purpose of unification, the number of incoming calls for the whole country will be taken as the dependent attribute. Based on this, classification is made.
We obtained data from publicly available sources; these were open data sources.31,33,34
We left the data retrieved as they were. However, from the obtained IoT open data, we removed for each data instance the data about the year, the month, and the day within the month. Instead, we added information about the day of the week and whether the data are taken during the working day or the weekend.
Incoming calls to the 112 system
The most significant damage caused by natural disasters in Slovenia in recent years has been due to floods, fires, drought, storms (strong wind), and a series of landslides and heavy snow; sleet was also a significant factor. For example, in 2013, the damage due to drought was estimated at 0.3% GDP (106 million Euro) and due to floods estimated at 2% GDP (650 million Euro) in 2014. On this basis, we have defined the parameters for the data sets. In addition, other data parameters were added, such as day data and traffic accidents data.
The main data used were the number of incoming call to the 112 emergency system for the whole of Slovenia. Since Slovenia has 13 regional 112 centers, we attempted to evenly allocate the data according to the centers. Figure 4 shows a map of Slovenia with (a) weather stations 33 and (b) rivers with stations. 33

Open IoT data
We classify the open IoT data into four groups: day data (G1), weather data (G2), river discharge data (G3) and accident data (G4). Each group contains multiple attributes. In Figure 4, maps of Slovenia with weather stations and rivers with stations are shown.
Day data
We used day data: weekday (1—Monday, 7—Sunday), and weekend classification (1—Workday, 2—Saturday, 3—Sunday).
Weather station data
We chose weather stations from places where the 112 regional centers are located. In 2015, these 112 regional centers had about 90% of all incoming calls within the state. Weather stations with statistics for the year 2015 are shown in Table 1.
Weather stations observed with statistics for 2015.
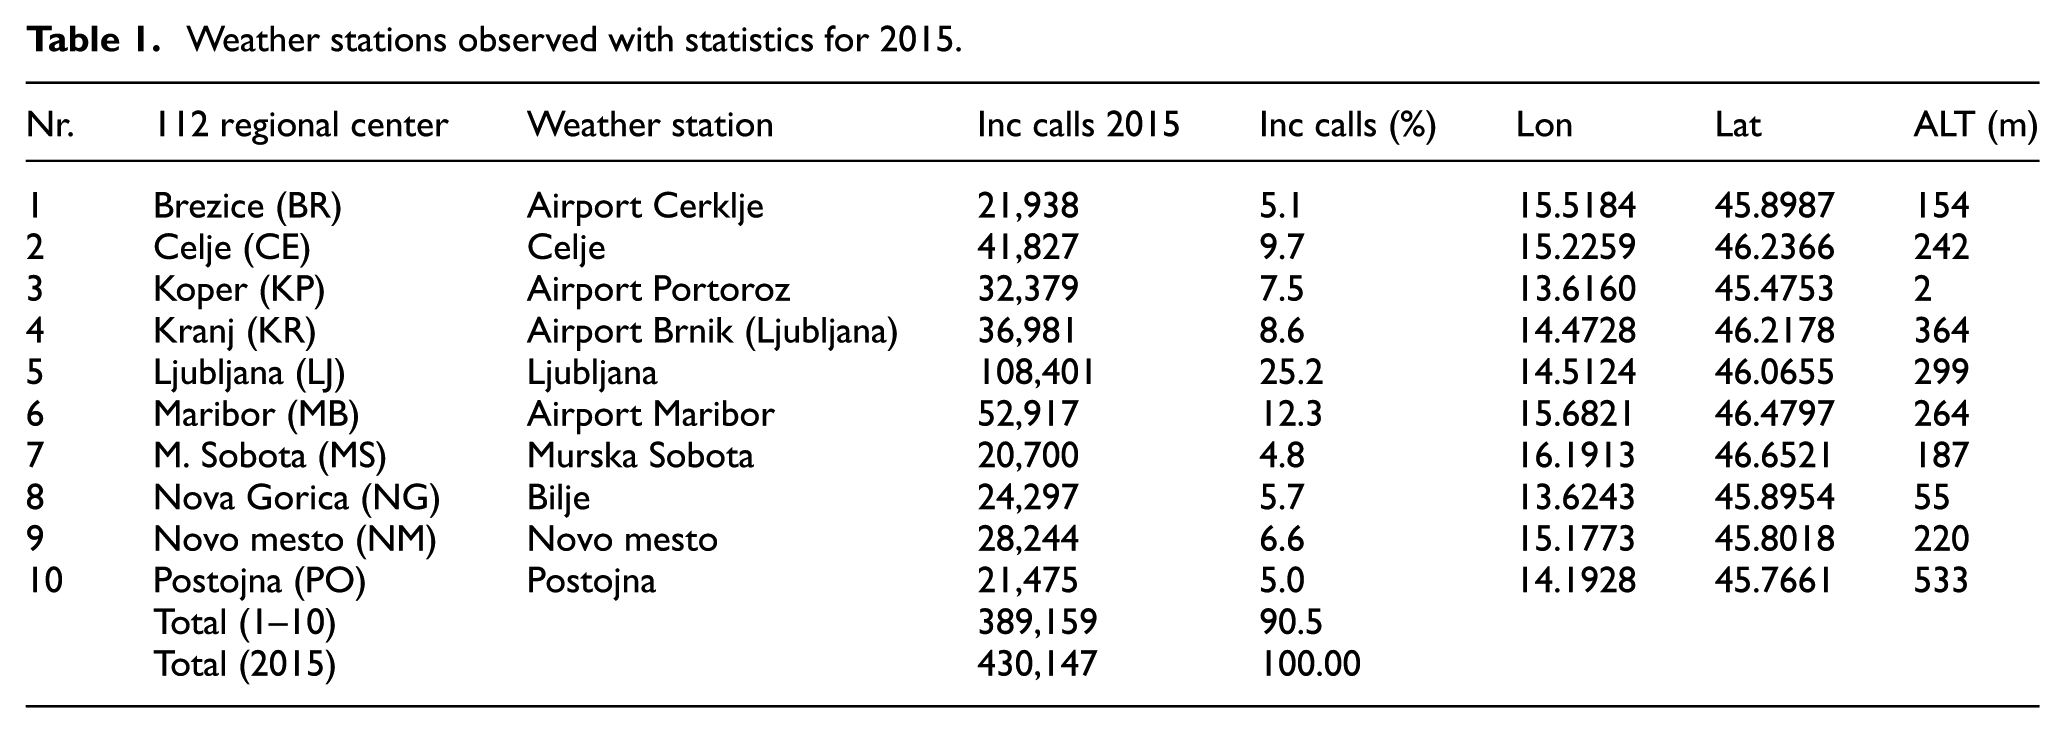
For each station, we have prepared 16 parameters for each day: average, maximum, and minimum daily temperature (C), average wind speed (m/s), cloudiness (%), humidity (%), amount of rainfall (mm), height of snow (cm), height of new snow (cm), sunshine duration (h), flag for strong and stormwind (0—no, 1—yes), flag for thunderstorm (0—no, 1—yes), and flags for freezing rain, hail, or frost (0—no, 1—yes). Weather data were obtained from the open data system of the National Meteorological Service of Slovenia. 33
When we checked all the data, we found that some data do not exist (height parameters of new snow and sunshine duration, for the weather stations at Brezice and Kranj), so we removed these two attributes. This did not significantly affect the final results.
River discharge data
Data on river discharge were obtained from the open data accessible system 33 of the National Meteorological Service of Slovenia. We took the data from rivers and stations with the highest discharges. The data are presented in Table 2. For each station, longitude (Lon), latitude (Lat), and altitude (ALT) in meters are given. In addition, hinterland (Hint) for the entire Slovenia territory (in %) is given. It can be seen that the sum of the hinterland is 54,159 km2, which is more than twice the whole surface area of Slovenia, which is 20,273 km2. This is because some rivers’ hinterlands are in neighboring countries: the Mura River also flows in Hungary, the Drava in Austria, and some of the hinterland of the Sava River is in Croatia.
River stations observed.

From the open data source, 33 the data for each station were available: mean monthly discharge (daily average), the smallest monthly discharge (daily average with day present), and the highest monthly discharge (extreme discharge with day present). We used the mean monthly discharge for each day in the month, with corrections for smallest and most extreme discharges for the given day and the day’s close. The discharge was measured in m3/s.
Traffic accident data
We obtained traffic accident data from the Slovenian police force. 34 Only total data were available: statistics for the distribution of traffic per month and days of the week. We distributed month data for each day evenly. Since statistics show that accidents are distributed differently depending on the day of the week, we additionally corrected each day’s traffic data. Specifically, about 15% accidents are on each day from Mondays to Thursdays, 16.7% on Fridays, 13.3% on Saturdays and 10% on Sundays. We use two parameters of statistics: the number of accidents and the number of people involved in accidents.
Preparing data for classification
The last stage of data preparation is to prepare data for classification. The classification task is performed as follows:
We take open IoT data for the period from 2013 (January) to 2016 (March). Each data record represents one day of data. In total, the obtained data consist of 1186 data instances.
The minimum number of incoming calls per day in that period for the whole of Slovenia is 890; the maximum number is 9538; the average is 1478.90.
For each data record, we defined two classes according to the number of incoming calls. We defined one class with two different values (class2: regular, urgent) and another class with four different values (class4: small, normal, bigger, urgent). There are two values in class2 in order to distinguish regular traffic from urgent traffic, when the operators are informed that urgent incoming traffic is on the way. In the case of the four values in class4, we further distinguish regular traffic into small, normal, and bigger traffic. In such a way, the operator can additionally distinguish the incoming traffic. The boundaries between the individual classes were set to 1250, 1450, and 1700 incoming calls.
From all the data obtained, we have defined two data sets. One for Ljubljana, which we called the LJ data set; it consists of 20 attributes of data. The other is the SLO data set, which consists of all the prepared data attributes; it consists of 176 data attributes. Table 3 shows the structure of both data sets used. All the attributes that are included in the LJ data set represent a subset of the SLO data set. The LJ data set is only a subset (containing 20 attributes) of the SLO data set (containing a total of 176 attributes).
Data sets with attributes used.
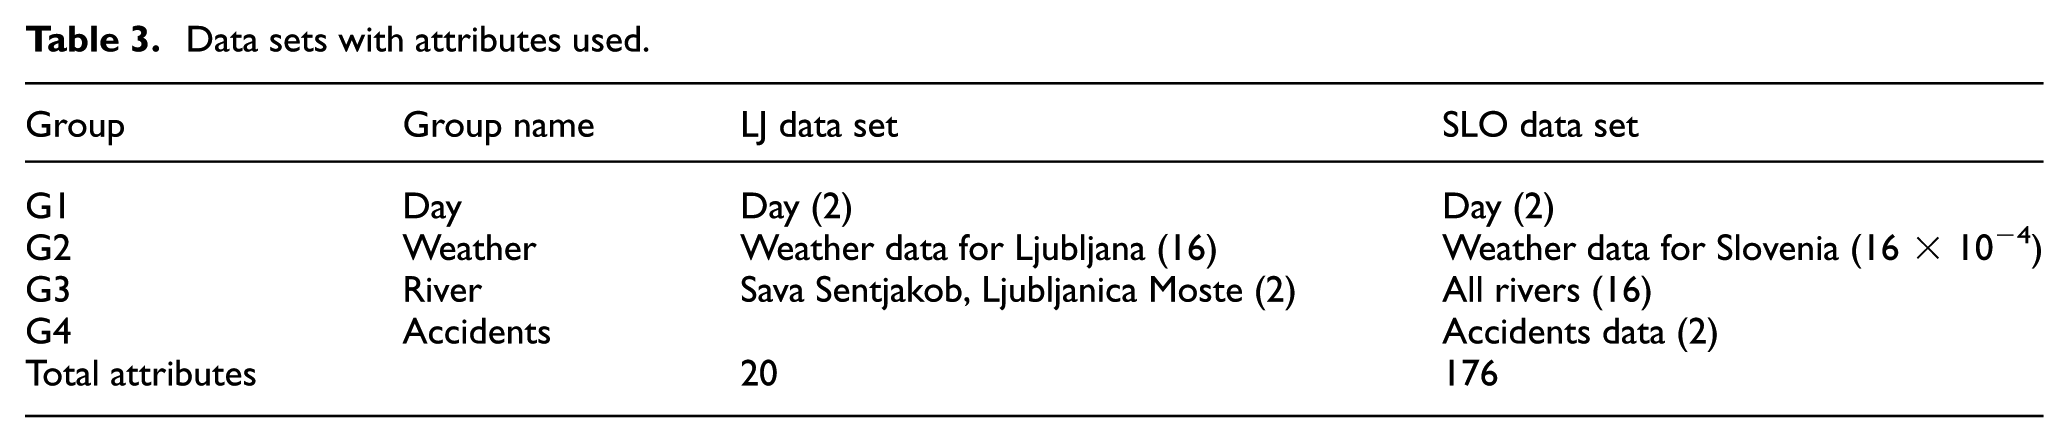
Figure 5 shows the distribution of incoming calls per day for the whole country for the period 2013–2016. The x-axis of the histogram starts with the minimal number of calls, which is 890 and ends with the maximal number of daily calls which is 9538. The y-axis indicates the number of days from 2013 to 2016 when the certain number of incoming calls was achieved. For example, 890 calls per day happened 11 times during 2013–2016. Figures 6 and 7 show the distributions of incoming calls converted into four and two classes, respectively, for both LJ and SLO data sets.

Incoming calls distribution from minimum to a maximum number of calls per day for the whole country for a given period 2013–2016 (x-axis: distribution of calls according to the volume of calls; y-axis: how many times the given number of calls has been made).

Incoming calls converted into four classes (classes from the left to the right: small, normal, bigger, and urgent) for both LJ and SLO data sets. Numbers represent the number of incoming calls for given classes.

Incoming calls converted into two classes (classes from the left to the right: regular and urgent) for both LJ and SLO data sets. Numbers represent the number of incoming calls for given classes.
Simulation by classification
Classifications used
For the classification,35,36 we have used the Weka tool.37–39 Classifiers used and compared to each other are Naïve Bayes, Support Vector Machines (LibSVM), boosting classifier (AdaBoostM1), tree classifier J48, and a class for constructing a forest of random trees (Random Forest). In addition, we used the zero rule (ZeroR), which relies on the target and ignores all predictors.
For each classification method, we have used 10-fold cross-validation. The data pool for a given fold was the same for examining different classifiers. Therefore, the results are comparable.
Simulation results
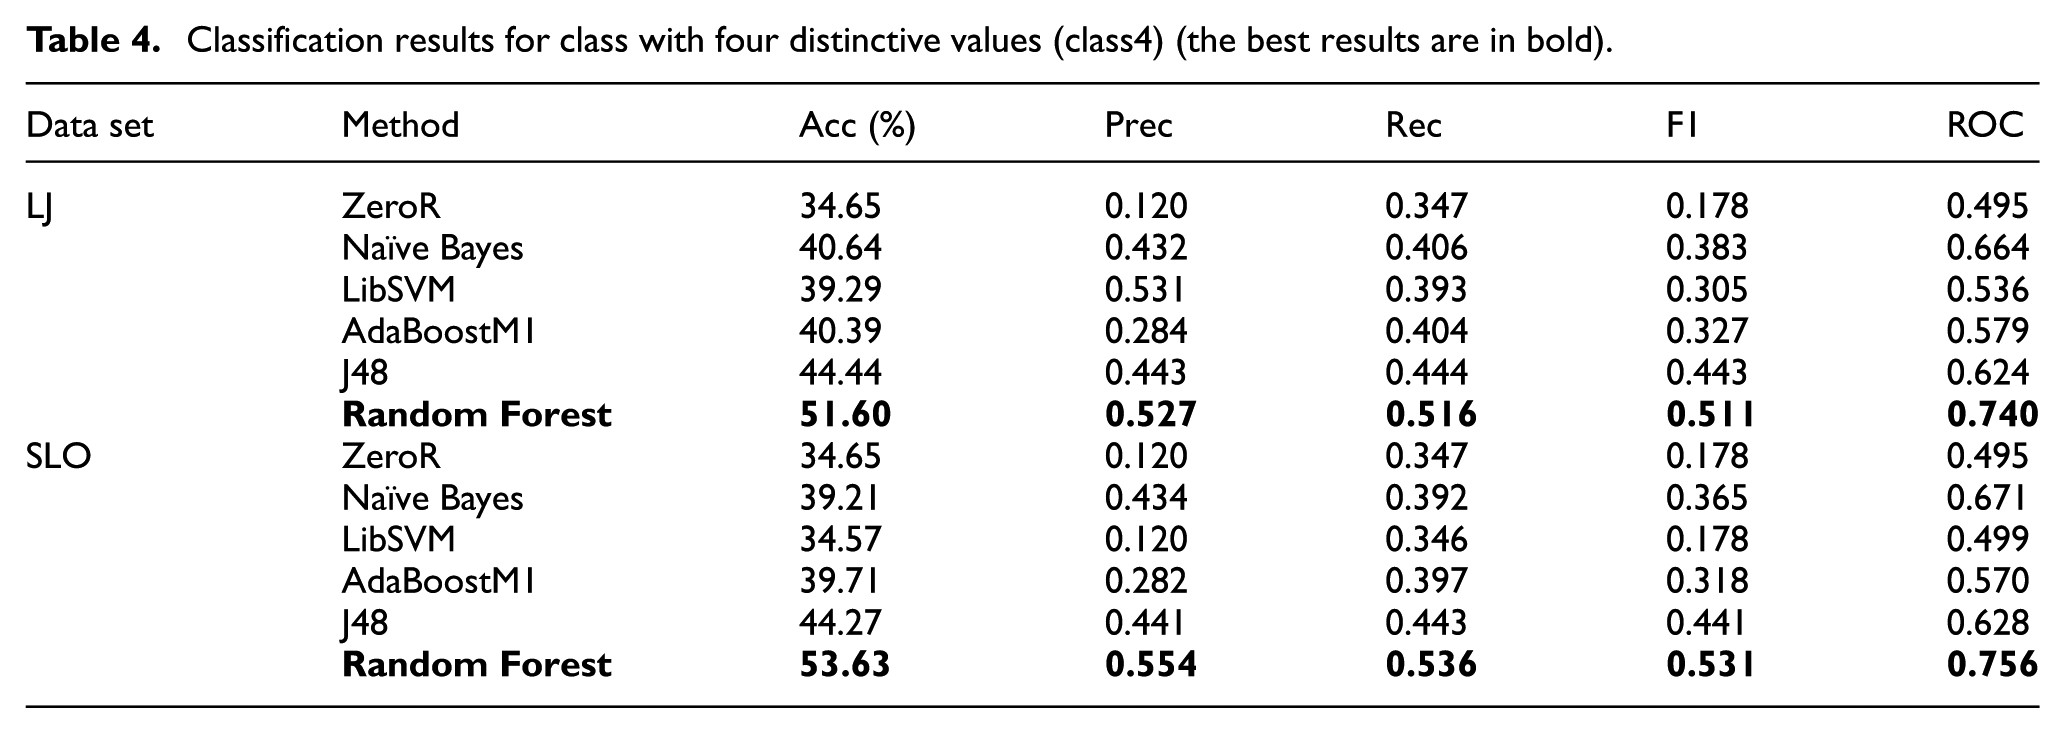
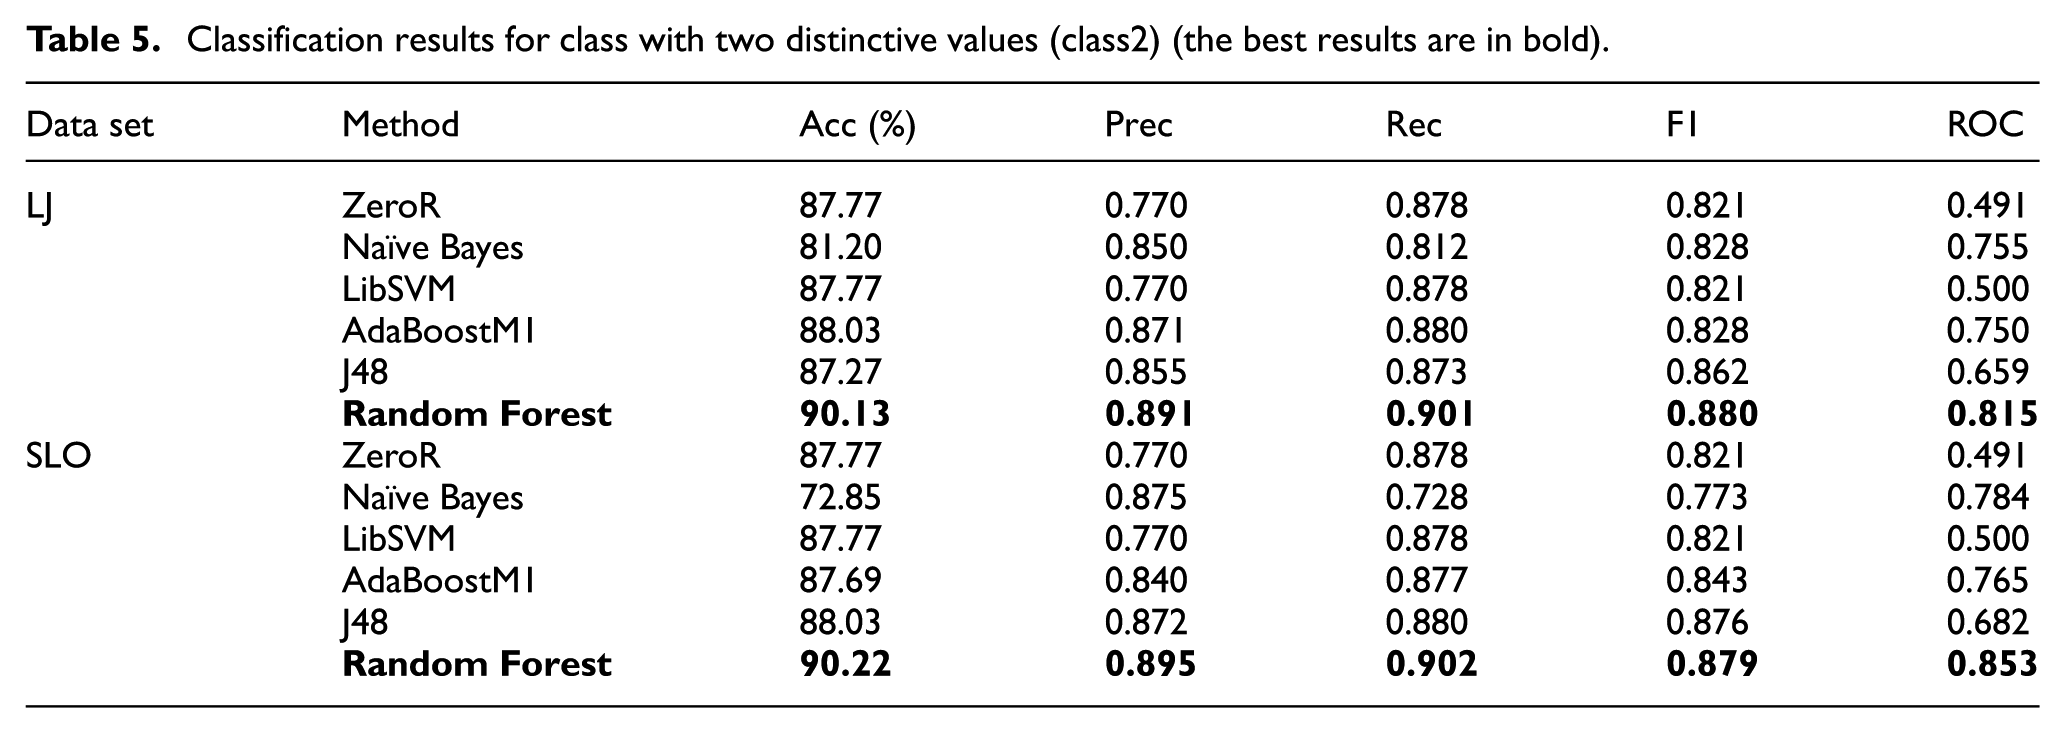
The results of the simulation are presented in Tables 4 and 5. For each simulation case, we have checked the cost function values: accuracy (Acc), precision (Pre), recall (Rec), F1 measure (F1), and receiver operating characteristic (ROC) curve.
Classification results for class with four distinctive values (class4) (the best results are in bold).
Classification results for class with two distinctive values (class2) (the best results are in bold).
Classification accuracy (Acc) is the ability to predict categorical class labels. It is the simplest scoring measure. Accuracy calculates the proportion of correctly classified instances. The evaluation measures used were based on TP (true positive), FP (false positive), and FN (false negative). TP is a rate of true positives, that is, of instances correctly classified as a given class. It means that the value of the actual class is yes and the value of the predicted class is also yes. FP is a rate of false positives, that is, of instances falsely classified as a given class. It represents cases when the value of the actual class is no, and the value of the predicted class is yes. FN is a rate of false negatives, that is, instances falsely classified as negative. It represents cases when the value of the actual class is yes, and the value of the predicted class is no.
Precision is the number of correct results divided by the number of all positive predicted results. The formula is precision = TP/(TP + FP). Recall, also called sensitivity, is the ratio of the correctly predicted positive observations to all the observations in the actual class—yes. The formula is recall = TP/(TP + FN). The F1 measure is the weighted average of precision and recall. Therefore, this score takes both false positives and false negatives into account. The formula is F1 measure = 2 * (recall * precision) / (recall + precision). ROC curve depicts the performance of a classification algorithm as the classification threshold is varied. ROC area approaching 1 means the best classifier and 0.5 means random guessing.
Discussion of the simulation results
The basic questions for the discussion of the simulation results are which class type (class2, class4), which data sets (LJ, SLO), and which method are better to use. There is not one answer, but many; there is not one best solution. However, there are situations when the best solutions differ.
It seems that in general, binary classification (class2) gives better results than multiclass classification with four classes (class4). The accuracy is better for binary classification, but also other parameters behave similarly. From the classification methods, Random Forest provides the best results in all the cases. For different situations, J48, AdaBoostM1, and Naïve Bayes also give good results.
From the results obtained with ROC, we conclude that it is the best to use only the class with two values (class2) and with more data attributes (SLO data set). The best performer when using ROC is always Random forest.
Conclusion
In this article, the classification of incoming calls for the smart city 112 public safety system based on open IoT data was presented. We describe the system, the procedure of data preparation, and the simulation. We confirmed that it is possible to carry out classification based on open IoT data. The main contribution of the paper was the classification of the incoming calls. We showed that method and class type are also relevant. As the best data set has been shown to be the one for the whole country, not only the capital city, and the best class type was with two values only. The Random Forest method has proved to be the best method for all the scenarios.
Because the field of data mining is still evolving, it is to expect that there will be more and more proposals and new possibilities in the direction of public safety for smart cities. New challenges are how to further increase the accuracy of the classification. Another interesting topic is how to expand the forecasting of incoming calls toward police and rescue services, for example, with data about epidemics and crime. As a whole, the results obtained are a good basis for further work on improving the classification in advance of incoming calls to the smart city public safety system.
Footnotes
Handling Editor: Aitor Almeida
Declaration of conflicting interests
The author(s) declared no potential conflicts of interest with respect to the research, authorship, and/or publication of this article.
Funding
The author(s) disclosed receipt of the following financial support for the research, authorship, and/or publication of this article: The authors acknowledge the financial support from the Slovenian Research Agency (research core funding “Algorithms and Optimization Procedures in Telecommunications”), the Ministry of Education, Science and Sport of Slovenia (project ≫Ekosmart≪ - Smart City Ecosystem) and the Ministry of Economic Development and Technology (project ≫5G Safety≪ - 5G Enabled Public Safety Services and Applications). We also acknowledge funding from the Slovenian Research Agency via program Complex Networks P1–0383.