
Abstract
Service recommendations help travelers locate en route traffic information service of interest in a timely manner. However, recommendations based on simple traffic information, such as the number of requests for the location of a facility, fail to consider an individual’s preferences. Most existing work on improving service recommendations has continued to utilize the same ratings and rankings of services without consideration of diverse users’ demands. The challenge remains to push forward the modeling of spatiotemporal trajectories to improve service recommendations. In this research, we proposed a new method to address the above challenge. We developed a personalized service-trajectory correlation that could recommend the most appropriate services to users. In addition, we proposed the use of “congeniality” probability to measure the service demand similarity of two travelers based on their service-visiting behaviors and preferences. We employed a clustering-based scheme, taking into account the spatiotemporal dimensions to refine the trajectories at each spot where travelers stayed at a certain point in time. Experiments were conducted employing a real global positioning system–based dataset. The test results demonstrated that our proposed approach could reduce the deviation of the trajectory measurement to 10% and enhance the success rates of the service recommendations to 60%.
Keywords
Introduction
To improve both traffic and travel, it is necessary to address the challenges presented by the increasing number of motor vehicles, while at the same time satisfying increasing demands for more and better traveling, and dealing with traffic dislocation due to so-called “retroactive” control. With the rapid development of the Internet and wireless communications, service recommendation systems have proven to be valuable tools for sorting through the large number of available traffic information services (TISs) while traveling. Traditional TIS offerings have been enhanced, making individual trips easier and more enjoyable. To promote the use of TIS, focus should be concentrated on satisfying personalized travel needs, so that finding information will be user-friendly, convenient, and the results will be tailored to each requester’s requirements. To accomplish this objective, the design of intelligent traffic service systems must take into account traveler preferences and the diversity of traveler behaviors.
Numerous options have been offered that attempt to provide information to travelers, including websites and phone applications. With the increasing number of alternative traffic services, improving the ability to provide effective recommendations for travel services has become an important research issue.
Most applications that recommend travel services are based on static information, such as the positions of the traveler and the service, the service type, and the communication channel. Existing recommendation systems provide only a list of nearby service providers. Users are compelled to review the simple and limited profiles of these providers and then make choices that have no link to their personal travel behavior, interests, or habits.1,2 It would be preferable to use physical context (such as location-based service-visiting behavior) to improve further the quality of personalized recommendations.
One active research area in this field focuses on leveraging the explosively increasing availability of trajectory-based data (e.g. global positioning system (GPS) logs) and rich contextualized data for personalized recommendations. Over the last decade, there have been many studies done both in industry and academia to develop new approaches for service recommendation systems that can utilize such rich data. 3 However, to date, very few studies have been conducted on personalizing TIS recommendations in this manner.
Previous work has relied solely on the use of logs created or held by GPS tracking for suggesting the next optimal destination for travel. 4 These approaches have ignored the richness of location-based TIS, which can provide information that addresses the user’s needs immediately, for example, by providing warnings of heavy traffic, locating the nearest gas station or source of road side assistance, or suggesting restaurants or hotels. Moreover, prior approaches have not given sufficient consideration to the choices and motivations of users that would influence the type of services recommended, the quality of services, and planning.
In addition, users’ geographic movements should be considered as reflecting their potential needs for TIS. The more similarity we find between the logs of two users, the more likely they are to have common travel needs. For example, if two individuals both make frequent visits to the same market after work, they may have the same travel routine. Moreover, a recommendation from a more congenial user might be more easily accepted. Mining individual mobility patterns combined with advising from congenial sources is a promising combination for creating quality personalized recommendations.
In the case of two individuals with similar trajectory histories, we might conclude quickly that recommending nearby services along similar routes would be straightforward as well as highly desirable. 5 However, the following issues need to be addressed:
Erratic trajectories in the real world. It is difficult to recognize the personal nature and complexity of an individual’s travel movements. Although millions of sensors can capture different aspects of an individual’s changes of location, the huge amount of heterogeneous data associated with rich semantic information presents serious difficulties for discovering and summarizing knowledge. Most of the existing tools that model movement information are designed to track the trajectory by having the user carry a GPS receiver in a car or as an application on a smartphone. These tools are based on topological structures of a road network, campus, or other constrained areas. This prior work demonstrates the continuing difficulty of capturing complex semantic information and transforming that information into usable knowledge. Existing methods seldom consider personalized influence of users who may change their minds, or who might have changing, inconsistent needs when traveling.
Service and trajectory correlation. Individual trajectories are useful for allowing quick classification of mobility patterns, but beyond that, we need the user’s service-visiting behaviors to tell us exactly what he or she prefers. We have the unique opportunity to record the trajectory along with the real behavior of every user, and a correlation that reveals the user’s preferences. Therefore, we need to explore how to mine the positive correlation between users’ service-visiting behaviors and their trajectories in order to make the best recommendations.
Congenial recommender mining. Existing approaches to development of service recommendations provide the available information based on searches for similar individual users. To date, there has been almost no consideration of whether people would accept these suggestions more often from others who have proven to be more congenial and dependable in their general service recommendations. Therefore, the acceptability of the recommendations should also be considered.
In this study, we proposed a personalized TIS recommendation method to address the above challenges. Our approach aimed to provide the most appropriate services to travelers in the most effective way possible. We used “congeniality” probability to measure the demand similarity between two users in the real world based on their service-visiting behaviors. The more congenial a user was, the more acceptable his or her suggested recommendation would be. Inspired by this observation, we developed a novel approach to provide interested users with nearby recommendations for travel services in traffic environments by considering real-time physical location proximity and similar service-visiting behaviors in the past. Our contributions are as follows:
Existing work has focused on route or landmark recommendations instead of the nearby personalized TIS recommendations. We proposed to use the trajectory histories and service-visiting behaviors in the real world, instead of simple and limited “Yellow Pages” offerings, in order to recommend instantly the best nearby services in traffic environments.
We were able to mine the diversity of trajectories for the users. To address the challenge presented by erratic patterns, we employed a clustering-based scheme that considered the spatiotemporal dimensions to refine the trajectories with the time at each spot where users stayed. Meanwhile, we could detect indirectly the two-dimensional (2D) correlation between service and trajectories, accounting for service-visiting behaviors by associating their trajectory histories with the major POS (points of TIS).
We proposed the use of “congeniality” probability to measure the similarity of demands for TIS between two users in the real world based on their service-visiting behaviors. To discover the congenial user, we collected the numbers of recommendations accepted from each user in the past, and further derived an available recommendation.
The remainder of this article is organized as follows. Section “Related work” introduces the preliminary knowledge of our approach. The trajectory patterns for the users are identified in section “A trajectory pattern in travel.” In section “Approach to establishing recommendations for nearby services,” we present our approach for providing nearby TIS recommendations instantly for users by considering their service-visiting behaviors. Section “Case study” describes the evaluation of the experiment and its results, and section “Conclusion and future work” concludes the article.
Related work
Recommendations for TIS
TIS for individual users has developed quickly for application with smartphones. Traffic information meets the needs of users and has mobile application features. If you know the patterns of the individual’s life, a location-based TIS can give the user an effective recommendation at the right time. 6 For example, if a user usually goes to the supermarket to make purchases on a weekend afternoon, the system proactively could provide the user with the supermarket’s discount information. If the system has knowledge of popular leisure areas and classic tourist routes, the system would recommend the surrounding attractions according to the current position of the user, the specific route, or the next attractions after visiting some spots.
User requests for information about traffic control and management occur mainly before traveling, such as, driver information service, personalized information service, and road route guidance service. The recommendation mechanism can meet the above requirements of the traveler. 7 Dynamic traffic assignment (DTA) 8 is an application of TIS in industry and commerce. It predicts traffic system states and provides the natural mechanism for driver route choice, 9 or for travel mode choice. As Bulusu et al. 10 mentioned, the recommendation should be based on the understanding of likely usage contexts such as user’s customary behavioral tendencies, past experiences, situational factors, and the ambient traffic environments. In this way, it is possible to track the movements characterized by what otherwise might appear to be unexpected trajectories and develop a more effective mode to identify the credible users to carry out the service analysis and prediction.
Position trajectory pattern
Using an artificially simulated random traveler to build a movement model has been a major research approach, as in literature.11,12 However, models developed this way still exhibited minor differences from reality because the artificial simulation used data types that were too idealized, such as travel time, departure place, destination, and distance of travel. Although this type of model had advantages, including simple data processing, minimal outside interference, and a good interactive platform, the model had disadvantages as well. The results were not persuasive because they were based on an unrealistic “physical” environment, which was only a theoretical artificial simulation. Sommer et al. 13 pointed out that simulating movement traces should consider that buildings or obstacles on the road might cause signal loss
In response to this challenge, in our research, we performed a study based on communication devices held by each of the volunteers, as will be explained further in section “Case study.” We collected each volunteer’s location information. Through analysis of the traveler’s historical GPS data, we obtained his or her movement trajectories. This allowed us to develop the travel mapping knowledge in order to analyze and forecast travel behavior further to serve the research areas.
User similarity
With the advent of big data, services and application systems in many fields are providing recommendations by tracking similarities among users. User similarity is also very important in modern traffic information. In addition to tapping into the relation between users, user similarity can reflect real-life needs and preferences to provide travel reference advice for each user. 14 Similarity measures the degree of likeness between objects, and it is a basic calculation in data mining and natural language processing. There are two key aspects: feature representation and the similarity relation of the object. 15 In social networks, the measure of users’ similarity is used to find a potential friend or interesting content. 16 Tang et al. 17 employed similar micro-blogs as the basis for issuing a friend recommendation by measuring the interactions between users and topics that a user posted. However, because the independent item is evaluated using cosine similarity and Pearson correlation, this approach is not applicable for measuring the similarity of travel sequences. For this article, we utilized the users’ trajectory patterns to filter the similarity and further treated them as a decision factor for recommendation.
A trajectory pattern in travel
Constructing patterns of a trajectory
A pattern is proposed to organize, store, and identify the mobility trajectory in the form of a sequence. In our research, the sequence was identified as a set of stay points, as defined below, considering the spatiotemporal dimensions.
Definition 1
Stay points describe a user’s characteristic behaviors, thereby revealing indirectly the user’s preferences in various areas. The behaviors have the unique characteristic of temporal and spatial (latitude/longitude) correlation. Thus, a stay point can be structured as a 2D matrix.
We focused on users in the traffic environment, considering not only their personal attributes but also the ambient conditions in which they were visiting the TIS. Personal attributes, especially a user’s preferences and demands, would influence the decision whether the TIS is functionally complete or not. Accordingly, we constructed the trajectory patterns by identifying the resident behaviors indicated with a set of stay points in temporal order.
Given the special appearance for different stay points on GPS, we were concerned with two types:
Delayed points: if the GPS signal disappeared within a certain period of time, it could be treated as blank GPS data. We assumed that the user stopped for a while inside a signal-free zone, such as a building.
Marked points: if the GPS signal repeated in a special area within a certain period of time, it was considered as a significant variance on GPS records. In such cases, we assumed that the user moved around in the area of such landmarks.
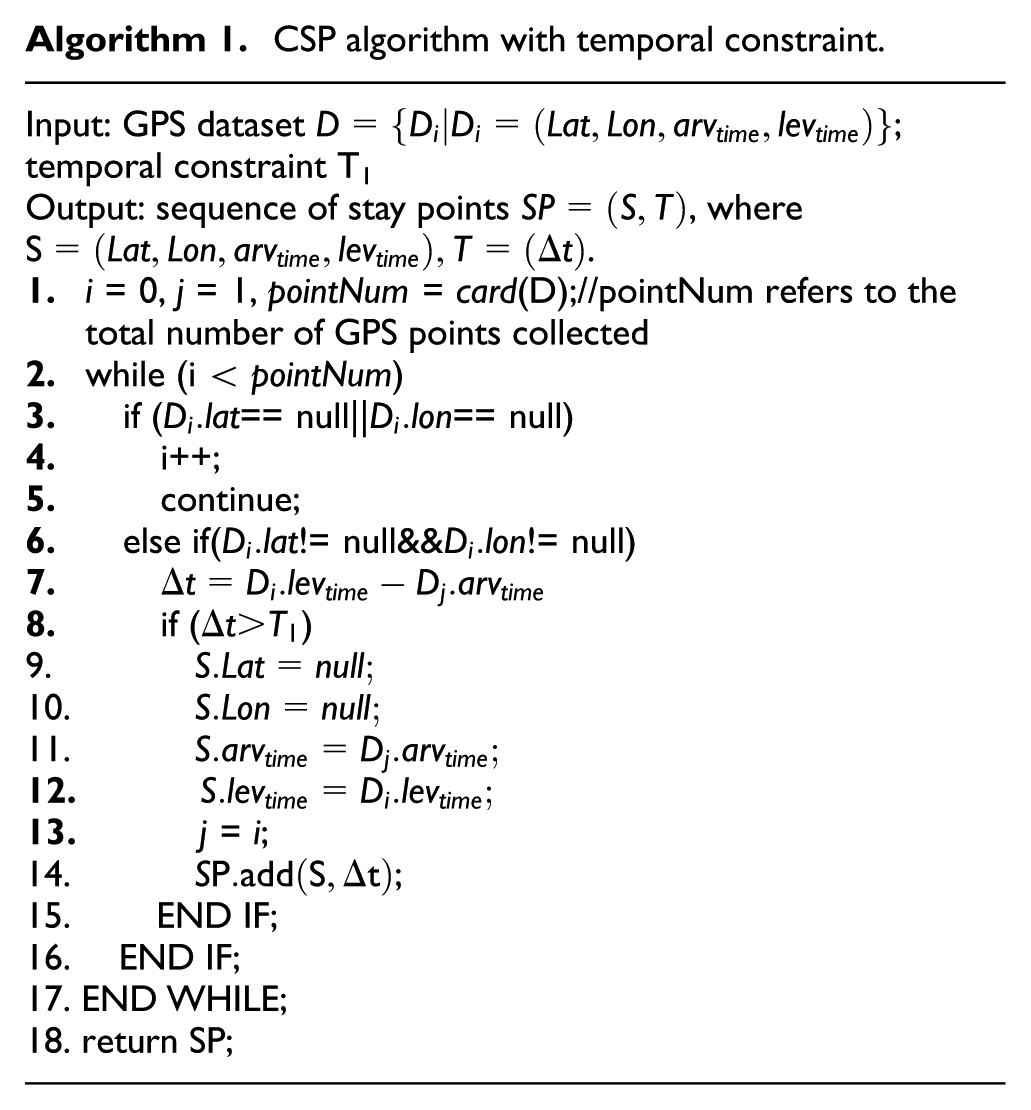
In this research, we proposed a constraint-based stay point (CSP) algorithm to identify the stay points. Depending on delayed points, the constraint was related to dwell time. The algorithm can be described as Algorithm 1.
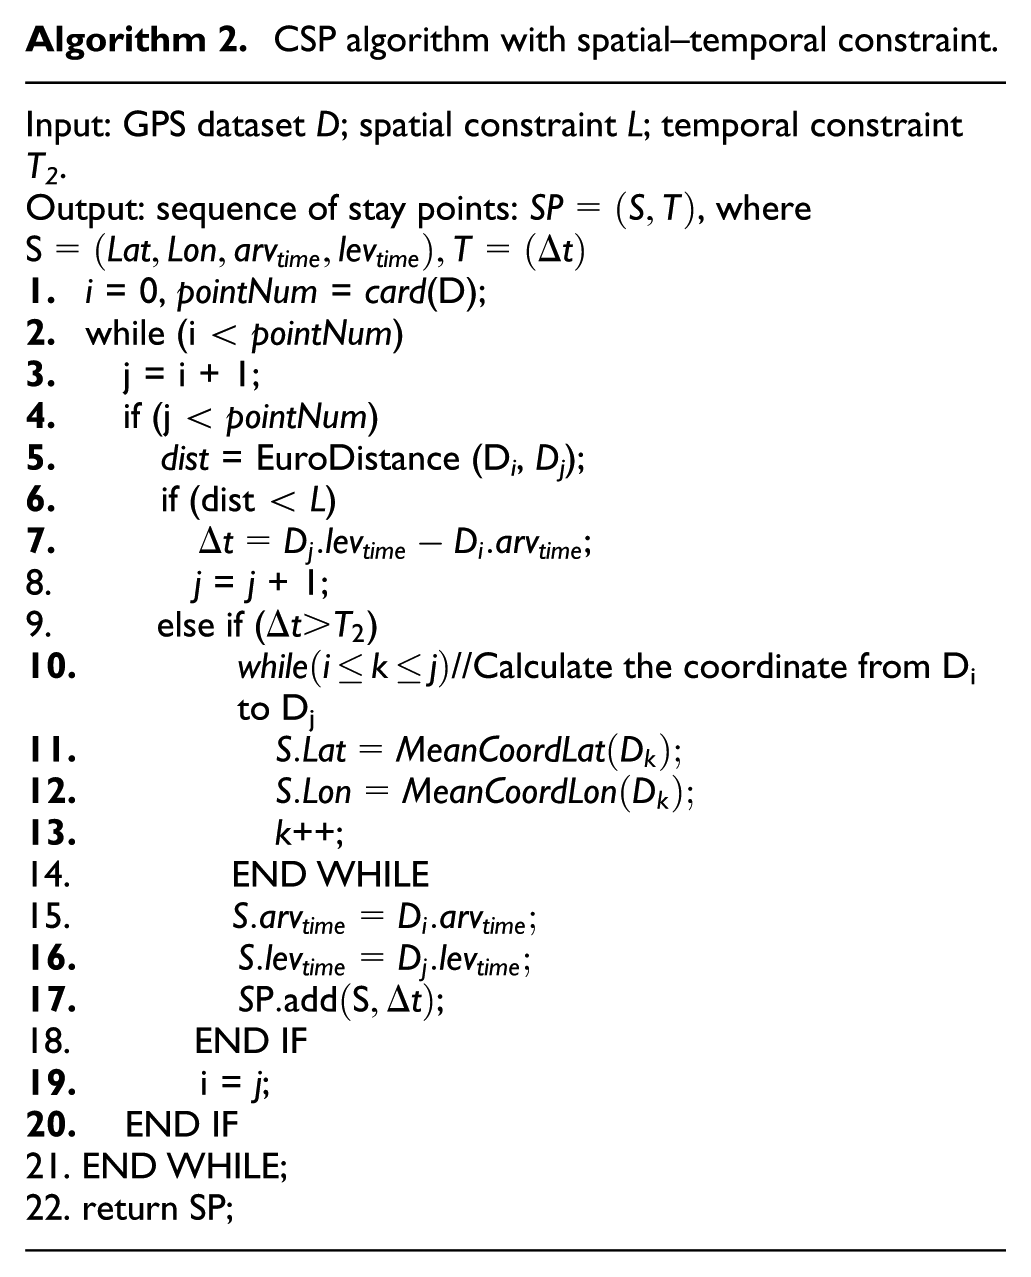
For the marked points, we set the constraints as two types: distance between two spots (before-and-after) and dwell time. Similarly, the algorithm can be described as Algorithm 2.
Exceptional stay point
Due to the low sampling frequency of GPS signals, it is reasonable to expect that there would be occasional deviation on the same spot in the physical world. The response to the weaknesses of low precision recognition has been used to correct the exceptional stay point and further refine the aforementioned trajectory patterns.
We borrowed the concept of clustering to propose a limited stay points (LSP) algorithm. In order to find out the available numbers of stay points in a specific area, LSP was designed to introduce two types of constraints: clustering radius and minimum number. Because the accuracy of trajectory patterns is demonstrated by the clustering radius, which is proportional to a user’s movement, we chose the following two factors for identifying the clustering radius:
We associated the user’s interest in particular places with his or her personal experiences. In other words, when a traveler had higher interest and richer personal experience, he or she would like to move in a greater area around the spot. Consequently, the clustering radius would be much larger.
We utilized the geographic information of landmarks. The larger the area that was occupied by a landmark, the more a traveler’s movement was magnified, and the larger the clustering radius as well.
The LSP algorithm is described as Algorithm 3.

Approach to establishing recommendations for nearby services
As stated previously, a user’s characteristic behaviors were identified by associating the structured trajectory patterns with a large number of real-time geographic data. In this section, we present our approach to create a recommendation that can find out nearby TISs of interest to users instantly by considering their service-visiting behaviors.
First we constructed a category of service information, namely, POS, to detect indirectly the 2D correlation between the service and trajectories, accounting for service-visiting behaviors. Then, we proposed to use the “congeniality” probability to measure the demand similarity for travel services between two users in the real world based on their service-visiting behaviors. To discover the credible user, we collected the number of recommendations accepted from each user in the past and derived an acceptable recommendation.
Service-visiting behavior
POS represents a region with a three-dimensional Spot-Category-Spatiality matrix. For example, a known POS is described as ((Yanta District in Xi’an; leisure entertainment; (108.954895, 34.227373)). With the POS, a service category can be determined for a given spot. Therefore, it is possible to detect service-visiting behaviors by mining the service information from a proposed trajectory pattern. Consequently, the sequences representing service-visiting in a travel can be recognized by associating trajectory histories with the major POS. For example, given a user’s characteristic behaviors identified as a 2D stay points matrix, for example, (108.954895, 34.227373, 20150504120556), the corresponding service-visiting behaviors can be identified as a POS-based model, for example, (029710061, 03, 108.954895, 34.227373), where “029710061” represents “Yanta District of Xi’an” and “03” represents “entertainment and leisure.” Each of these regions has a corresponding POS, and to each POS, there corresponds a service-visiting behavior.
Definition 2
A service-visiting pattern describes that a user visited a sequence of categories most frequently in his POS-based model. To establish a pattern for a user, there should be more than three visits for such sequences during travel.
Method for discovering congenial recommender
A user’s trajectories combined with his or her prior use of TIS hold the richness of the user’s preferences. The first law of geography states that everything is related with other things, but things are more related if they are closer in distance. Therefore, the stronger the similarity between two users’ travel logs, including the spots visited and services they used in the past, the more likely it is that they have common needs and requirements for TIS. In other words, the recommender with the strongest similarity is considered the most congenial, and we expected that his or her recommendations would be more easily accepted than recommendations from others with a lesser degree of similarity.
First, we used “congeniality” probability to measure the demand similarity for TISs of two users in the real world, and then further discovered the congenial recommender. Given a user represented as ui, we derived the congeniality of a recommender uj to him in symbols as
In this work, we employed collaborative filtering to calculate the similarity. However, given the independent, less-related object evaluated in the traditional similarity analysis, we did not apply such analysis to determine the similarities of travel trajectories that continue for some time. Therefore, we introduced the following factors to analyze this kind of similarity among users:
The sequence in which users’ activities are carried out. Not only did we need take into account whether users were visiting the same spots, but we also had to consider whether they were accessing the spots in the same order, that is, using the same trajectories and service-visiting behaviors. The trajectory pattern was divided into several sequences, which included three spots accessed contiguously. Similarly, the sequences including three types of service categories that would be generated from the POS-based model.
Position and service information. The distinction between a user’s position and his or her service-visiting information was taken into account in our research by generating the numerical weights.
With regard to time, we focused mainly on the delay between the starting times for similar movements: the smaller the time lag, the greater the similarity between users. A smaller time lag was taken to mean that the users would get to the same point in the same order, and their arrivals would be very close together in time. For example, three users had the same trajectories including points A, B, and C. The first user arrived at eight o’clock in the morning, the second one arrived at nine o’clock in the morning, while the third arrived at eight o’clock in the evening. For our research, we considered that the first two were more similar.
We applied the POS-based models to evaluate the probability that the historical recommendations for TIS were accepted. It turned out that the numbers gathered via TIS statistics in an adoption window worked quite well for calculating this probability. Here, 3 months had become the default for the temporal adoption window.
In summary, the congeniality of a recommender indicated as

where
We were able to get a set of recommenders ordered by their congeniality.
Personalized TIS recommendations
A personalized recommendation could be produced closely following a user’s guidance. First, we derived a set of candidate TIS recommendations from each recommender and then exhibited the best candidate by grading each one.
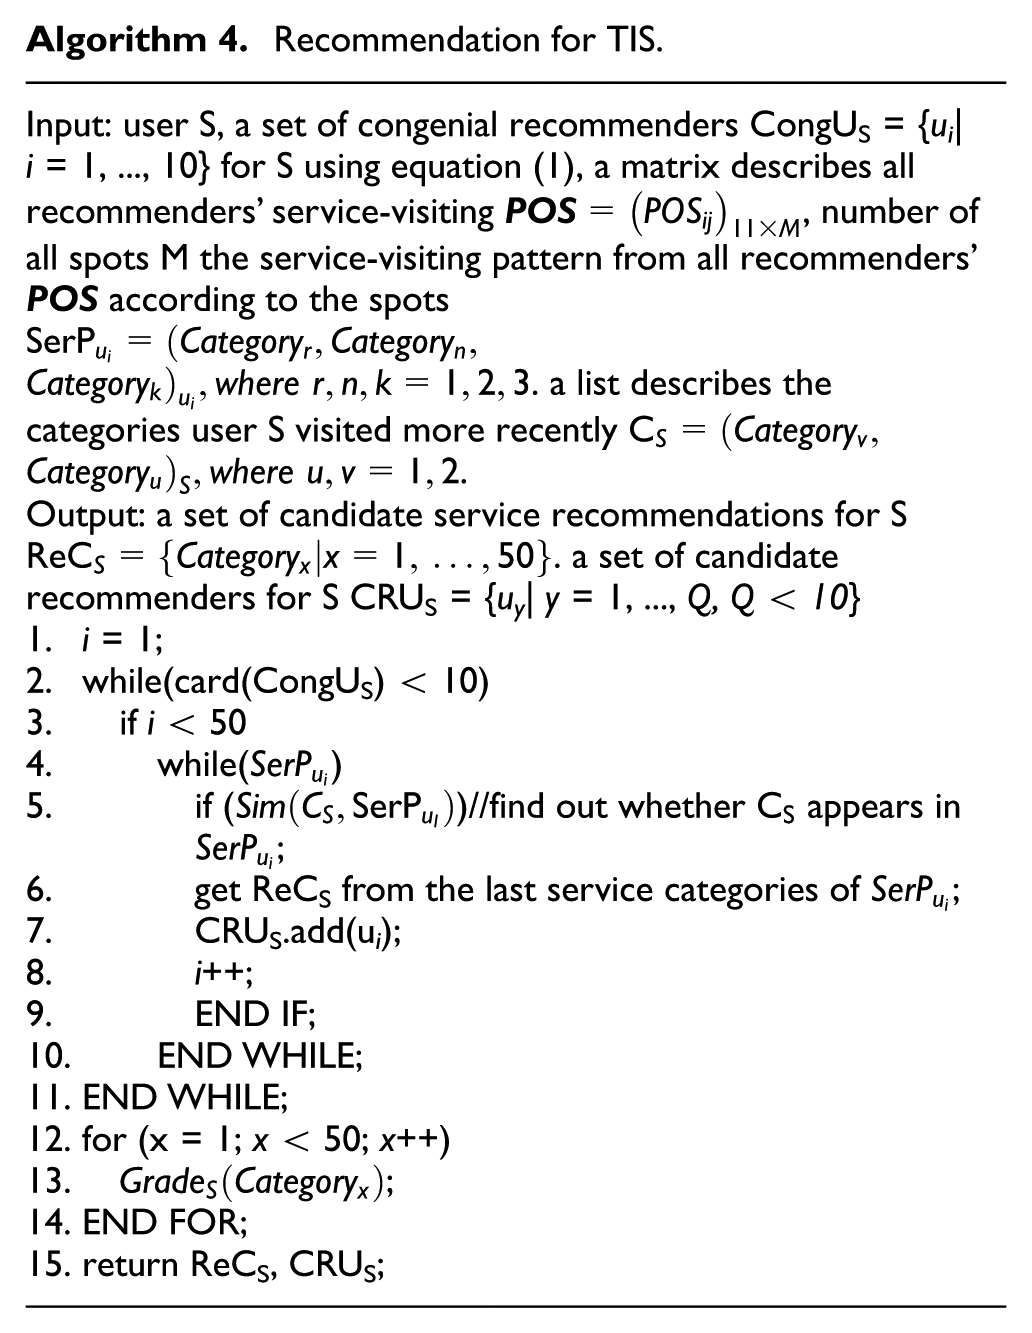
The TIS employed by the user in this article was associated with the user’s position. The proposed recommendation was able to satisfy the requirement of the travel activity, namely, to meet the individual traveler’s planning activities. A user was asked to extract his service-visiting patterns related to the spots he accessed. The congenialities of each recommender were then calculated. As shown in Algorithm 4, the grading mechanism was used to implement accurate recommendations using the service rate as shown in equation (2). The grade was considered to be a preference for candidate services and thus used to predict the demands and issue available recommendations.
A candidate service category recommended by the traveler uj to the traveler S was estimated in equation (2)

where
Case study
To validate the effectiveness of the proposed approach first, we used a real GPS-based dataset with eight volunteers traveling for 12 days. The Yanta district of Xi’an was selected as the activity zone. Testers held mobile devices equipped with a real-time GPS sensor able to provide the related data, including user, longitude, latitude, time, and so on. In terms of the real field being investigated, Figure 1(a) shows nine stay points with five delayed points, and four marked points. Figure 1(b) shows ten stay points with six delayed points, and four marked points. All stay points in Figure 1 are labeled as  .
.
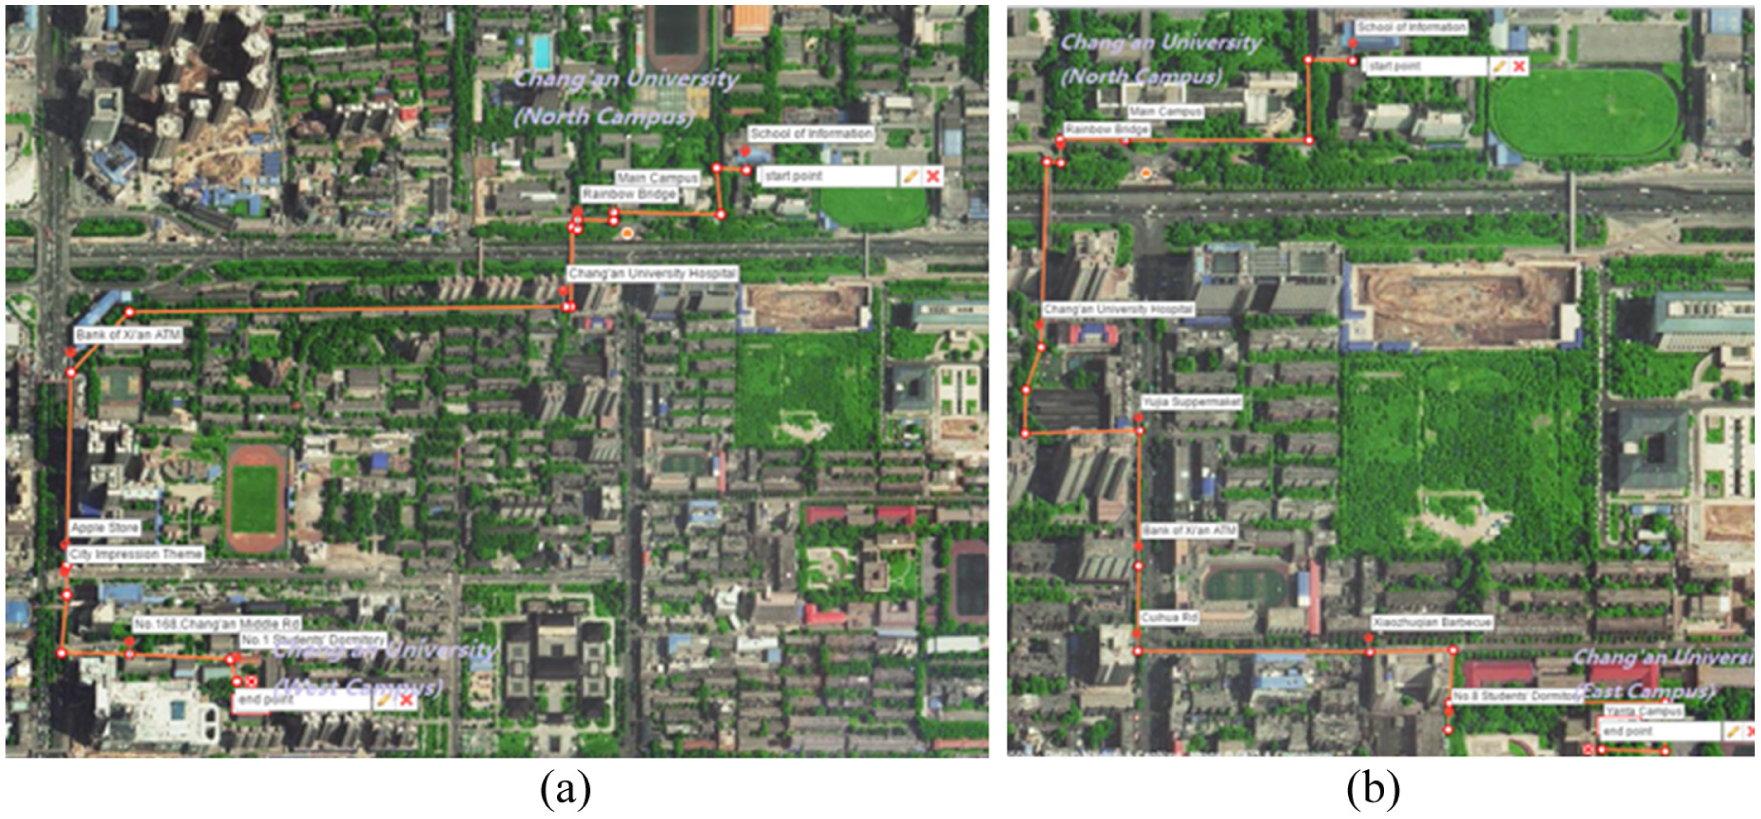
Routes on maps: (a) route 1 and (b) route 2.
Experimental setting
With consideration for the completeness of experimental data (e.g. maximum data size) and the electricity consumption of sampling, the sampling frequency was set to 0.2 Hz.
There was some concern over parameters in the CSP algorithm, for example, the volunteers’ behaviors and rituals, their ability to access the spots marked on the routes, and the time interval of data sampling. For the delayed points, the time threshold was set to be 1200 s, which means that the volunteer stayed at a spot if there was occurrence of the same data exceeding the 1200 s. As a result of the sampling error from the GPS (about 10 m), the time interval of sampling (5 s), as well as the person’s pace (1 m/s), the distance threshold was set as 15 m, and time threshold was set as 20 s. Figure 2 shows the trajectories in the form of a sequence of stay points recognized by the CSP and LSP algorithms. As we can see from Figure 2, the CSP algorithm was able to reflect the user’s movements accurately.

Comparison of a sequence of stay points: (a) user’s movement, (b) stay points identified by CSP, and (c) refined trajectories identified by LSP.
In accordance with the volunteers’ preferences regarding the spots marked on the routes and the size of these spots, parameters (i.e. the cluster radius and minimal number) in the LSP algorithm were set to be 20 m and 14, respectively. Figure 2(c) shows the refined trajectories after handling with the exceptional stay points. It turned out that the LSP algorithm was able to achieve better results compared with the results shown in Figure 2(b).
Performance evaluation
We collected GPS data on route 1 and route 2 for 12 days. The performance of the CSP, LSP, and velocity-based 18 algorithm was investigated using the indicators shown in Table 1.
Performance indicators of recognizing stay points.

Due to the constraint of a person’s pace (1 m/s) in the velocity-based algorithm, we first evaluated the different LSP-K algorithm which refines the CSP algorithm, where the spatial and temporal constraints were set as K (m) and K (s), respectively. Given different Ks, F-measure was then used for the comparison in equation (3)

Figure 3 illustrates that the LSP-10 and LSP-15 do best in the comparison. We select LSP-10 as the candidate for subsequent performance analysis because of its quick convergence. Figure 4(a) shows the results according to the spatial constraint. We found that the precision of LSP-10 is superior to others and reached up to 97%. However, the recalls of CSP and LSP-10 are relatively low and are maintained at a level of 70%–88%. Also, the precisions gradually rise with an increase in the constraint, while the recalls decrease. The reason lies in an increasing number of points recognized. Although the velocity-based algorithm fared relatively better in recall, it experiences recognition errors, which have implications for personalized recommendation.

F-measure of different LSP algorithms according to K.
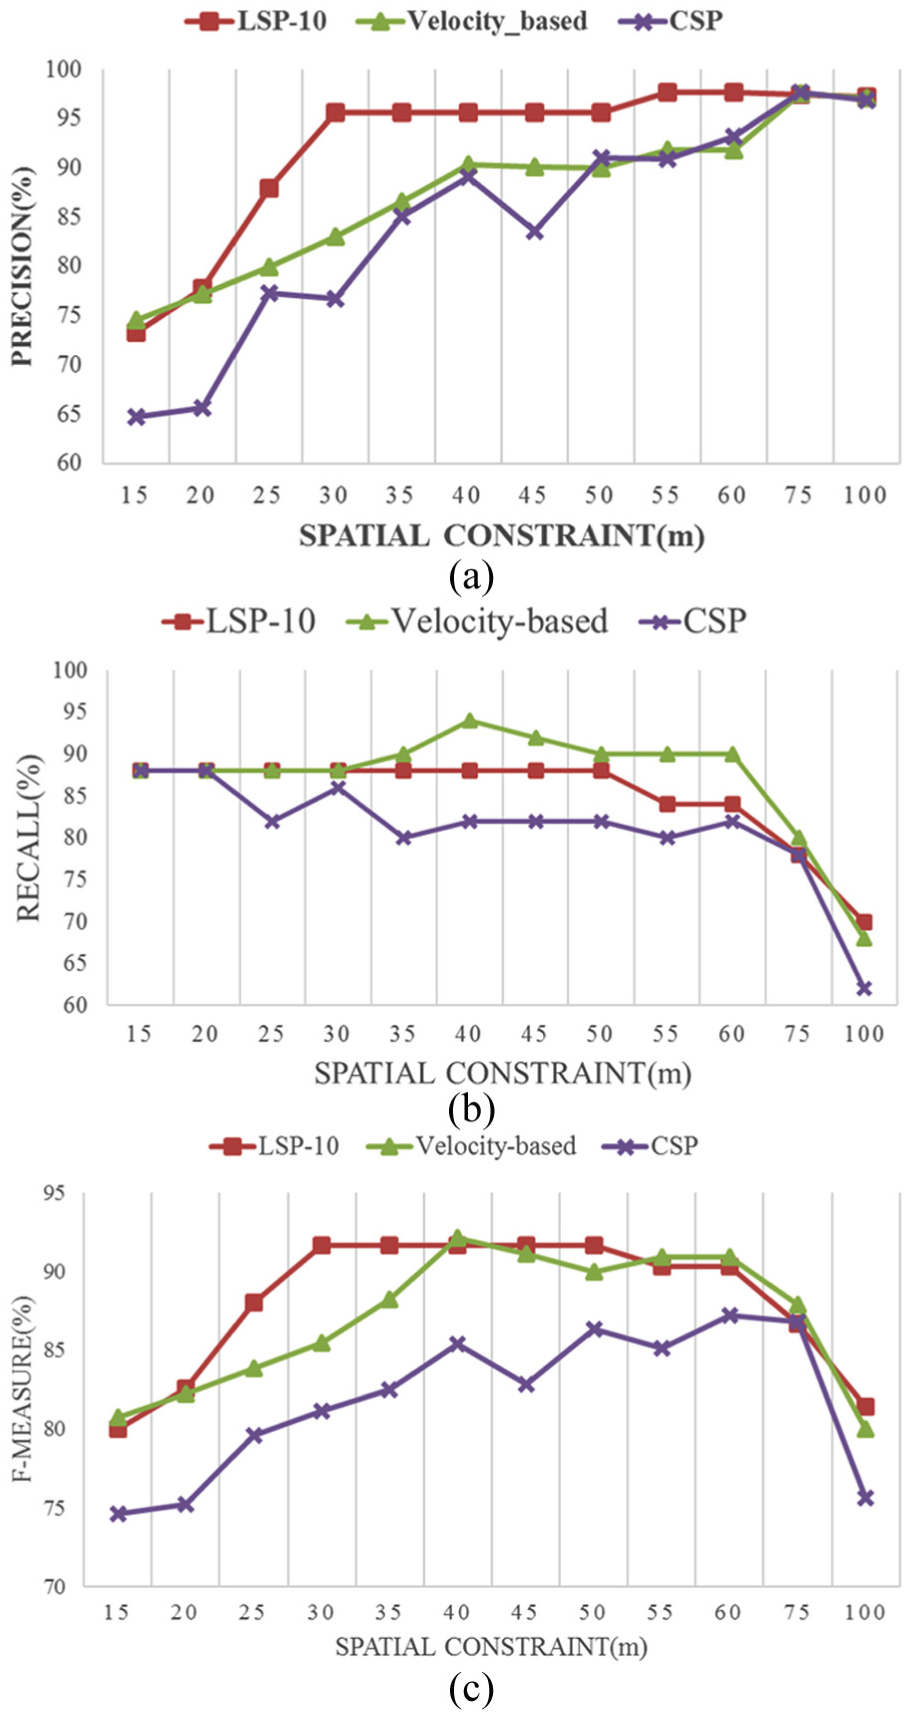
Comparison of (a) precision, (b) recalls, and (c) F-measure.
For the recommendation algorithm, we took Microsoft GeoLife as the public dataset, made Beijing City the main activity area, and tracked 182 volunteers in this area for 5 years. We extracted 3891 stay points and obtained the dataset consisting of 528 service-visiting patterns related to the above points. These patterns demonstrate that the services each volunteer selected in the past years. We split the dataset of patterns into training and test ones, that is, the whole data for last 8 months are used for two testing sets, namely, as Set A and Set B, and the remaining are for training. Figure 5(a) shows a user’s walking route from 1 p.m. to 7 p.m. Figure 5(b) shows the stay points identified by the CSP algorithm. Figure 5(c) shows the sequence of stay points handled with the LSP algorithm.

(a) Original routes, (b) sequence of stay points identified by CSP algorithm, and (c) sequence of stay points obtained by LSP algorithm.
The patterns in training set were used for predicting the grades of services selected by each volunteer in the Set A. We then analyzed the precision (i.e. the ratio of relevant TISs accepted to the total number of TISs recommended) and recall (i.e. the ratio of relevant TISs accepted to the total number of TISs visited) of recommendation.
The PR (precision recall) curve was used to measure the performance of the proposed recommendation algorithm and the other two generic algorithms, that is Meta-Path-based 18 and Cosine-based. Figure 6 illustrates the advantages of our proposed algorithm over the others, where TOP-N identified the number of categories recommended. The precision of our algorithm was up to 52%, but the precision of each of the others was around 30%, failing to think about the way people access the spots and services chronologically. The precision reduced as the recommendations grew in size. However, we found that an increment in the recommendations that may get low grades will likely interfere with the satisfaction of users, bringing further loss of accuracy. However, the user might get what he or she wants if more available services are recommended, that can be reflected in the comparison of algorithms in the recall ratio. Our algorithm performed far better than the others and reached a recall ratio of over 95%.

Comparison of the PR curve for three recommendation algorithms without considering whether the recommendations for TIS were accepted by users or not.
We believed that congenial recommenders could be identified by determining whether their historical suggestions were adopted, which makes the recommendations more effective. To demonstrate, we selected 4 months as the temporal adoption window and updated the probability that TISs adopted by each volunteer according to the last experiment. The precisions of the proposed algorithm with adoption analysis and not, for recommending services in the Set B, were compared. Five users were randomly selected from Geolife dataset. Figure 7 indicates that a recommendation using adoption analysis would be more effective because the historical experiences are introduced, which are a way of ensuring better recommendations.

Illustration of the congenial recommenders with adoption analysis.
Discussion
We found that there is a loss of diversity in TIS recommendations. There are two reasons for this result. First, the limited types of travel services make it difficult to link some spots with special TIS offerings and to structure a complete POS-based model. Second, there may be a larger number of ways of defining a service of interest near a spot, which means there is not a unique element in the trajectories assigned to each service.
The proposed algorithm was shown to be superior to the generic recommendations that are based only on the similarity of users’ movement. However, this research took both the order of users’ locations visited and the semantic information of the TIS into account. This approach allowed us to take into account the movement between the two users, as well as their service-visiting behaviors in the past, to calculate the similarity among the users.
Conclusion and future work
As distinct from the generic service recommendation, we considered the users’ movements and their service-visiting as important physical context. Thus, we proposed to use “congeniality” probability to measure the demand similarity of two users and further to produce an approach for personalized recommendations. To address the challenge of erratic or inconsistent behavior, we employed a clustering-based scheme that considered the spatiotemporal dimensions to refine the trajectories with time at each spot where users stayed. The experimental results demonstrated that our proposed approach was able to reduce the deviation of the trajectory measurement and enhance the success ratio of the TIS recommendation.
In the future, we would like to extend our work by collecting user feedback to optimize the user experience for different travelers. We also plan to analyze the way to recognize the customary and service-visiting behaviors by introducing different indicators to extend the dimensions. To improve the performance of CSP and LSP, we will collect the available dataset to construct the effective set of POSs. The weighting of similarities will be improved by consideration of mode of transportation. For example, in a bus station, the similarity of users looking for the same route to the same place was higher than that of users looking for other routes. In addition, the temporal adoption window will be constructed to refine itself continually to respond to both change in users and changes in the physical world.
Footnotes
Handling Editor: Aitor Almeida
Declaration of conflicting interests
The author(s) declared no potential conflicts of interest with respect to the research, authorship, and/or publication of this article.
Funding
The author(s) disclosed receipt of the following financial support for the research, authorship, and/or publication of this article: This work was funded by the Project of the National Natural Science Fund of China under grant no. 61303041; Industrial Research Projects of the Shaanxi Province under grant nos 2015GY002 and 2016GY-078; and the Key Science and Technology Innovation Team of Shaanxi Province under grant no. 2017KCT-29.