
Abstract
Connection looseness phenomena of steel grid structures might induce issues of lowering integrity, large deformation, even total collapse of the structures. The goal of this article is to propose an evaluation method for bolt-sphere joint looseness of steel grid structures using piezoceramic guided wave–based method through experiments and numerical simulations. A single bolt-sphere joint looseness experimental model is established and tested, considering grid member connection angles of 0°, 45°, 90°, and 180°, respectively. Then, multiple bolt-sphere joint looseness detection tests by selecting six kinds of cases for a steel grid structure model are performed. Piezoceramic patch arrays bonded on the surface of grid members are used as transducers to generate and receive detection guided waves, and external torques are applied to indirectly simulate the bolt-sphere joint looseness effect. The experimental results show that the bolt-sphere joint looseness impact on the ultrasonic wave energy attenuation has a nonlinear regularity. Based on the regularity, an evaluation method and key techniques for the bolt-sphere joint looseness detection based on guided wave energy are proposed and experimentally validated. To further clarify the bolt-sphere joint looseness detection mechanism, the ABAQUS software is used for a finite element analysis of the single bolt-sphere joint looseness evaluation. The numerical and experimental results match well, verifying the feasibility of the proposed method.
Keywords
Introduction
Steel grid structures (SGSs) with bolt-sphere joints (BSJs) are widely used in civil engineering. An SGS is usually composed of steel tubular members and bolt-sphere (or welded-sphere) joints. BSJ looseness in SGSs might be generated in long-term services due to certain factors, such as exterior loading, environment impacts, dynamic actions, and human activities, causing structural reliability decreases or even full collapses of structures if undetected. So far, the damage detection of SGSs is mostly being focused on steel tubular members by reducing the modulus of elasticity for simulating damages, and the damage detection of joint connections is rarely reported. The BSJ looseness mechanism and detection methods are required to be further researched. 1 To prevent SGSs from the BSJ looseness–induced damage, the BSJ looseness degree detection is required to be studied for early understanding the structural health state. The research on the BSJ looseness detection and structural health monitoring (SHM) is of great importance.
Bolt and weld connections are the two typical types for SGSs. Bolt looseness is one of typical nonlinear structural interface issues. It is reported that wind load is the main reason inducing the long-time vibration of SGSs and the looseness of BSJs. The results of the bolt looseness may reduce the bolt connection force, decreasing the structural connection effect, even generating the entire collapse of the SGS with BSJs. Nowadays, several researches on the bolt looseness detection in civil structures are reported. Ghasemi et al. 2 indicated that the fastening bolt has a significant effect on the stiffness of the structure through the experimental study of a double-layer grid structure. It is difficult to control a false tightening phenomenon in the BSJ during the design and construction. In the construction of the Dalian TV Tower in China, the method of inserting the endoscope into the hole of the screw cap is used to check the bolt tightening degree, however resulting in significant increase of the cost. Therefore, it is necessary to develop an SHM method for bolt looseness damage detection to solve this problem.
In recent decades, nondestructive testing (NDT) methods, such as the infrared thermal image technology 3 and the laser detection technology, 4 have been successfully applied to the structural interface damage detection. Moreover, the passive structural vibration–based SHM technology is also applied in bolted grid structures. 5 The Lamb wave–based method is applied in the experimental assessment on ultrasonically welded thermoplastic composite joints. 6 Since the bolt looseness reduces the stiffness of the structure, inducing changes of the structural dynamic behavior such as frequencies and mode shapes, it can be used for damage identification and health monitoring. However, the structural dynamic vibration–based technology is insensitive to the looseness of a small number of bolts, especially difficult to locate the loosened bolt position. Therefore, the bolt interface looseness detection technology needs further improved. Since the smart material–based ultrasonic technology plays an important role in NDTs and SHMs for pipe-like structures,7–9 it is expected to be used in the BSJ looseness detection.
At present, piezoceramic-based guided wave techniques are widely used in NDTs and SHMs. Most of researches in the field are focusing on pipe-like structures, few interested in the joints, which connect the pipe-like structures. Aristegui et al. 10 studied the ultrasonic guided wave damage detection in the liquid filled pipeline and carried out the research on the damage detection of the pipeline using the non-axisymmetric mode, and the guided wave propagation theory and the damage detection method are applied in this article. Shin and Rose 11 and Rose et al. 12 successfully induced the guided waves of the axisymmetric mode and the non-axisymmetric one in a pipeline. Hong et al. 13 detected the loosening degree of tapered thread connections by piezoceramic transducers. At present, the NDT and SHM technologies for symmetrical and uniformly distributed pipe-like structures have been successfully developed due to the approximately linear propagation of the guided wave. However, for guided wave propagation–based NDTs and SHMs, the nonsymmetrical and unevenly distributed structural connections like BSJs are less researched, and guided wave propagation performances and the sensitivity to the looseness are required to be developed.
The smart piezoceramic material–based active sensing technology is a rapidly developed NDT method.14–17 Piezoceramic material is widely used in NDTs and SHMs due to its prominent properties of low cost, fast response, simple structure and good reliability, and so on. 14 Piezoceramic-based NDT and SHM technology, which can not only detect local damages, but also locate the damage and characterize the damage degree, enables to overcome shortcomings of the traditional sensor–based technology. Lead zirconate titanate (PZT) as the most typical piezoceramic material can be used as transducers to be embedded in the structure or pasted on the surface of the structure to generate detection signals.
The PZT-based damage detection method can be classified into the PZT-impedance-based one and PZT-wave-based one, respectively. For the PZT-impedance-based method, local bolt looseness level can be successfully identified by comparing the electrical impedance change induced by the bolt looseness.18–22 But the method is only sensitive to the local damage, and it is required to install the PZT transducers near around the bolt, which may lower the efficiency of the detection. However, the active PZT-wave-based method can be applied in a relatively large range using guided waves propagating along the pipe-like truss members.23,24 The guided wave can travel through the loosened bolt, carrying the information of the bolt and identifying the bolt looseness situations by data processing methods.25–29 The usefulness of the piezoceramic ultrasonic–based bolted connection interface loosening detection of pipe-like structures has been demonstrated by both numerical and experimental methods.23,30–32
This article aims to perform a further study on detecting the BSJ looseness of SGSs. A PZT wave energy–based method is applied in the BSJ looseness detection research under several common conditions, to establish the relationship between ultrasonic wave energy attenuations and bolt loosening levels by both experimental validation and numerical finite element analysis (FEA) simulation. In addition, an algorithm based on the proposed relationship is set up, which may lay a solid foundation for piezoceramic guided wave based SHMs in SGSs.
Grid structure damage detection experiment
To propose a BSJ looseness damage detection method, an experiment of a BSJ model based on PZT guided waves for the damage detection is performed, focusing on the BSJ looseness detection mechanism, main influencing factors and rules, and the signal energy–based algorithm.
Experimental method
To realize the research goal, two kinds of experimental setups, a single BSJ model and an SGS model with multiple BSJs, are established. The test setup for the two experiments is shown in Figure 1 and described as the following. A BSJ model and an SGS model with multiple BSJs are manufactured, respectively. A double channel function/arbitrary waveform signal generator named RIGOL DG10×2 is selected to generate the required detection signals. It enables to output five types of basic waveforms and arbitrary waveforms with the frequency range from 1 μHz to 5 MHz, which fully meets the requirement of the damage detection. A PZT signal amplifier is sometimes applied as requiring amplifying the detection signal voltage amplitudes. A RIGOL DS1000B digital oscilloscope is used as the signal acquisition device in this experiment. It is used for triggering, collecting, storing, and calculating the signal, as well as carry out 1 GSa/s real-time sampling and 25 GSa/s equivalent sampling. In addition, the random signal automatic compensation function and the digital filtering function of the equipment itself will make the extraction of received signal and the analysis afterward much easier. A computer is used for data processing and analysis.

The schematic and test setup of the single BSJ in an SGS for looseness damage detection.
Figure 1 also clearly shows the process of the test. First, the selected pulse signal is input into the function generator after setting up the frequency, amplitude, and phase. The output of the function generator is connected with the input of the signal amplifier, and the signal amplifier output end and the piezoceramic transducer (PZT) patches for activating excitation signals are connected, so that the input pulse signal can be selectively amplified. The PZT patches and the digital oscilloscope are connected for receiving a signal. The set of a test system is completely established for use. Then, detection signals are activated using the inverse piezoelectric effect of the PZT material, and a stress wave is generated in the grid member. As the generated stress guided wave propagating in the grid member and passing through the joint, a further attenuation phenomenon will occur as touching with the joint looseness damage. One part of the wave will continue spreading along other grid members, and the other part will be reflected back. The transmitted guided wave will finally be received by receiving sensors at the other side. Using the piezoelectric effect of PZT material, the guided wave will be converted by sensors into electrical signals and exhibited and restored by the digital oscilloscope. Finally, the received signal is processed and analyzed by an electronic computer to obtain signals containing the looseness damage information. Thereby, the joint looseness detection of the grid structure is completely identified using a beforehand designed algorithm.
The ultrasonic guided wave propagates featuring non-changeable phase speed and group speed during the propagation in an intact pipe-like structure, and reflections and refractions as well as mode conversions will occur when encountering interfaces like cracks, holes, weld seams, and end sections in the structure. The received signal energy will be largely decreased after such interfacial interactions. Therefore, the guided wave energy level is closely associated with the bolt interfacial situation, which can be used to define an index to establish a bolt looseness damage detection algorithm. The signal energy–based algorithm should have properties of the clear mechanism, the high sensitivity to looseness damages, conveniently obtaining and the high identification precision.
The BSJ looseness is closely related with external applied force situations and environmental conditions. To simplify the looseness detection process, the BSJ interface situation is simulated by changing bolt applied torques in this experiment. For the research model, the torque of 60 N m is set for the health status, which can be used as a baseline for comparing bolt. Additionally, a five-peak wave with the center frequency of 70 kHz is selected as the excitation signal, and the excitation signal waveform and frequency spectrum are shown in Figure 2.

The waveform and spectrum of the excitation signal: (a) in time domain and (b) in frequency domain.
Based on the energy of the received signals, an energy-based index is defined and calculated using equation (1)

where x(n) is the discrete sequence of the signal, and n is the sampling point. Since the signal in time domain is the original signal received by sensors, it contains a large amount of information. However, it cannot get the frequency information of the received signal. In this article, the frequency of the received waveform is analyzed by Fourier transform to compensate the frequency information of the discrete time domain signal. The received energy is compared with the energy of excitation signal to obtain a named reception—excitation energy percentage, which can be abbreviated as the energy ratio.
Single BSJ looseness damage detection experiments
According to the research of Gazis33–35 and Lowe et al., 36 longitudinal mode guided waves are the most suitable for inspecting pipe-like structures; therefore, an L(0, 2) mode guided wave with the frequency of 70 kHz is chosen as the excitation signal in the test. In this article, L(0, 2) mode guided waves are excited in a steel grid member by bonding the selected PZT patches on the surface of the member, and the guided waves are propagating along the longitudinal direction of the member and passing through the BSJ. To avoid interferences of other mode guided waves during the signal excitation, restraining the flexural mode guided waves, a number of PZT patches should be greater than the maximum modes of the guided waves in the pipe-like member. The specific method is selected as follows: 16 PZT patches with the size of 12 mm × 6 mm × 1 mm and the type of d31 piezoceramics are used as an array to excite the signal by being bonded along the circumferential direction in the middle of the member (point A). At the same time, in the middle of the other side of the grid member (point B), four PZT patches with the same size and type are arranged as the receiving array to receive the corresponding signals. The schematic of the PZT transducer placement and the experimental setup are shown in Figure 3.

The schematic of the transducer placement and experimental setup: (a) PZT patches, (b) the PZT actuation array in detail, and (c) the experimental setup (mm).
Four different configurations of single BSJ
Four different connection types of single BSJs are shown in Figure 4. The first one is the joint with an angle of 0°, which is a straightly connected chord joint in SGSs, as shown in Figure 4(a). The second and third are those with angles of 45° and 135°, respectively, which are obliquely connected chord joint in SGSs, as shown in Figure 4(b) and (d), respectively. The fourth is the one with angle of 90°, which is the perpendicularly connected chord joint in SGSs, as shown in Figure 4(c). The four types of single BSJs are ready for bolt looseness damage detection experiments using the PZT guided wave–based method.

Four different connection types of single BSJ: (a) the connection angle of 0°, (b) the connection angle of 45°, (c) the connection angle of 90°, and (d) the connection angle of 135°.
Experimental results analysis
To clearly describe the relationship between the received signal energy and bolt looseness, a signal energy–based index named the energy percentage is defined
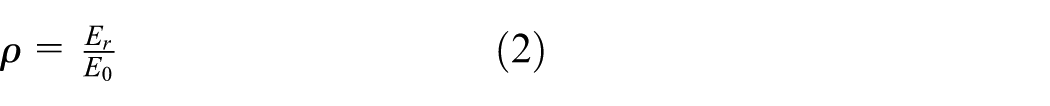
where ρ is the signal energy ratio,
Under these four experimental conditions, the relationships between the externally applied bolt torques and the signal energy ratio are obtained, as shown in Figure 5. It can be seen that with increase of the applied bolt torques, the signal energy gradually increases. The signal energy values are closely associated with the applied torques and the development trends are almost the same if the chord angles keep unchanging. However, the signal energy absolute values are greatly affected for different chord angles, and the signal energy values become less as the chord angles changing from 0° to 135°.

The signal energy ratio versus applied bolt torque under the frequency of 70 kHz for the single BSJ.
According to the experimental data, a curve fitting function is used to fit the experimental data. Three-dimensional fitting is carried out in the light of the two applied independent variables of the applied bolt torque and the connection angle and the one applied dependent variable of the percentage of the received energy. The curves in Figure 5 show that the function of the energy ratio is influenced by the bolt torque in the form of a power function with an influence factor of the connection angle of α. The least square method is applied to obtain the undetermined coefficients. The three-dimensional fitting diagram of the relationship among the signal energy ratio, the bolt torque, and the connection angle of the single BSJ (shown in Figure 6) is given by the fitting formula

where

The single sphere joints energy ratio–bolt torque in three-dimensional fitting.
Multiple BSJs looseness damage detection experiments
The location of PZT generator and receiver is usually determined by the expected monitoring BSJ joint and placed the pair of the PZT generator and receiver at the different sides of the joint. The evaluation for which BSJ joint should be monitored is basically based on the importance of the joint and easy loosening place evaluation such as the seriously vibrating location from the theoretical or numerical analysis. However, in order to reduce the number of PZT transducers and lower the cost-efficiency in practical SGSs, the transducers may be placed as far as possible, so the generated guided waves will pass through multiple BSJs to reach the other side sensors. The multiple BSJs looseness damage detection test is performed using the same method as in single BSJ looseness damage test, aiming at investigating the propagation behaviors as the PZT guided wave passing through two BSJs, and establishing the relationship among the received signal ratio and the applied bolt torque as well as the connection angle. The schematics of the PZT transducer placement and experimental setup are as the same as those in Figure 3. Six typical connection types of the multiple BSJs are selected for the experiment, as shown in Figure 7.

Six different connection types of multiple bolt-sphere joints: (a) 0°–0° connection angles, (b) 0°–45° connection angles, (c) 45°–45° connection angles, (d) 45°–135° connection angles, (e) 90°–90° connection angles, and (f) 135°–135° connection angles.
Experimental phenomena
The same five-peak wave with the center frequency of 70 kHz is selected as the excitation signal. After the experimental data processing, the received signal energy ratios are calculated using formula (2), and the relationship between the energy ratio and the bolt torque is shown in Figure 8.

The energy ratio versus the blot torque of multiple BSJs for the central frequency of 70 kHz.
Experimental results analysis
Figure 8 shows the relationship between the received signal energy ratios and the applied external bolt torques. In general, the energy ratios are increasing with the increase of the external bolt torques for the almost the same trend but the absolute values are different for the different connection angles. The experimental data are fitted using the same least square method as in the single BSJ looseness damage test. The fitting formula is shown in formula (4), and the three-dimensional fitting diagram is shown in Figure 9

where

The multiple BSJs energy ratio versus the blot torque and connection angles in three-dimensional fitting.
According to the relationships between the received energy ratio and the external blot torque for the signal central frequency of 70 kHz under the given connection angles for both single BSJs and multiple BSJs, some of conclusions can be made as follows:
For the signal with the central frequency of 70 kHz, the received energy ratios are reduced as lowering the external bolt torques, indirectly indicating that the bolt connection situation could be developed toward the loosening direction. The result can be used to establish a signal energy–based algorithm for BSJ looseness damage detection of SGSs.
It is observed that the relationship between the received signal energy ratio and the external bolt torque complies with an exponential fitting function form. As the connection angle increasing, the received signal energy ratio decreases correspondingly.
SGS looseness damage detection test
The researches on the ultrasonic guided wave propagation in the whole grid structure and guided wave–based bolt looseness damage detection are of great significance. However, SGSs are more complicated than a single BSJ or multiple BSJs due to several pipe-like members passing through one BSJ and forming a spatial structure. Meanwhile, the guided wave could pass through different ways to reach the observation sensors, making the PZT arrangement being a dominant issue. To validate the efficiency of the proposed method from both single BSJ and multiple BSJs bolt looseness damage detection, a spatial SGS model is manufactured and tested in a laboratory, as shown in Figure 10. The setup of the experimental model is shown in Figure 11. The same method including the experimental setup, dimensions, and material parameters of the structure and PZT transducers is adapted during the test.

The schematic of BSJ connected grid structure and the member numbers.

The setup of BSJ connected grid structure and the member numbers.
To simplify the description of joints and members, the top joints are represented by capital letters and the bottom joints are denoted by lowercases. Three terms are defined. The joint can be represented by the connection location such as the joint F. The member can be denoted by two near joints, taking the member EF for example. The artificial bolt looseness location can be defined from the loosened member and the connected joint, for example, the bolt EF-F means that for the bolt connected member EF, the joint F is artificially loosened.
A five-peak pulse wave with the frequency of 70 kHz is also selected as the excitation signal. A group of 16 PZT patches is uniformly bonded along the circumferential direction in the middle of the member EF to excite the detection signal; meanwhile, the members GH, CD, and Cd are selected as the observation members with four PZT patches at the middle of each member as sensors. The signal energy ratios of the three members are measured by changing the applied torques from the bolt EF-F. Then, by changing the torque of the bolt FG-F, the signal energy ratios of the three members of GH, CD, and Cd are measured, respectively. The bolt torque is increasingly applied by six steps, as shown in Table 1. The situation of the sixth step is supposed to be a “healthy” state as a compare baseline.
The applied bolt torques.

Experimental phenomena
The test method is as the same as the previous one and the looseness damage levels of the joints are simulated for different bolt torques and the signal energy ratios are extracted. The results for the energy ratios under different torques and working conditions are shown in Figures 12–14, respectively.
The energy ratios versus blot torques for the member GH.

The energy ratios versus blot torques for the member CD.

The energy ratios versus blot torques for the member Cd.
It can be seen that the changes of the applied torques from the bolt EF-F and the bolt FG-F have little influence on the relationship between the bolt torque and the energy ratio for the member CD and the member Cd, as shown in Figures 13 and 14, respectively. But, for the member GH, the changes have an obvious impact on the signal energy ratio, as shown in Figure 12. It can be imagined that there are many kinds of ways for signal propagating along the member CD and the member Cd after the detection signal is excited from the member EF. It is difficult to locate the looseness damage joints. And the propagation situation from the member EF to the member GH is relatively simple, so the member GH is selected as the receiving one. It also shows that when the loosening detection of the whole grid structure is carried out, the best PZT arrangement way is placing them in members in a straight line, resulting in a relatively simple and precise identification.
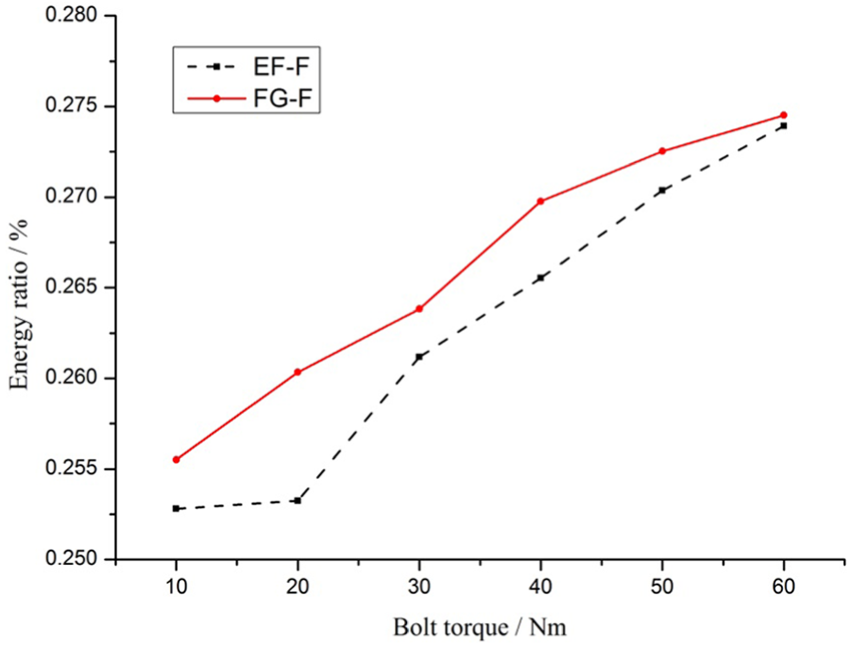
After the excitation and reception members are confirmed, the second step is performing the damage test. First, the damage test from gradually loosening the bolt FE-F is carried out to obtain the signal energy ratio. Then, the energy ratio by gradually loosening the bolt FG-F is obtained. The similar test processes using the same method are performed by loosening the bolt FG-G and the bolt GH-G, respectively, as shown in Figure 10.
Experimental results analysis
The results for these four groups of tests are shown in Figure 15. With increase of the applied external torques, the received signal energy ratios gradually increase. It is clear that the energy ratio values are obviously divided into two groups. The upper two lines represent those that come from the bolt FG-F and the bolt FG-G, called the secondary bolts; the low two lines denote those from the bolt EF-F and the bolt GH-G, named the main bolts. This can be easily explained from the perspective of wave energy attenuations. During the bolt looseness damage detection, as the ratio of energy attenuation is relatively large, it is suggested to check whether the main bolts are damaged or not; when the proportion of energy attenuation is small, it is suggested to detect whether the secondary bolts are loosened or not.

The energy ratios versus blot torques for different bolt looseness damages.
Numerical simulation on looseness damage detection of SGSs
FEA of structures is powerful in investigating a relative complex structure in a complicated situation. In this article, a large-scale finite element analysis software ABAQUS is used as a simulation platform to analyze the looseness damage mechanical behavior and numerically realize the damage detection of a single BSJ model of the SGS. The goal of the simulation is to investigate the propagation behaviors as the guided wave passing through the BSJ, based on which the mechanism of the signal energy–based bolt looseness damage detection can be clarified. Additionally, the simulation results can be validated by the experimental results.
FEA modeling of single BSJ
First, the Revit software is used to model several parts for the BSJ of the SGS and then the model is imported into the ABAQUS software for assembly. The main modeling parts are the hollow tubular members, nuts, sealing plates, and bolts. The specific dimensions of the finite element model are shown in Table 2. The entire model structure is made of steel, and the steel material parameters are selected in the simulation, as shown in Table 3.
Dimension of the finite element model (mm).

PZT: lead zirconate titanate.
Material parameters.

The contact area between the nut and the sealing plate will be altered to simulate the looseness of the BSJ. In the finite element model, in order to equalize the input and output of the excitation signal, the piezoelectric elements are used for the simulation of PZT patches, coupling together with the host steel BSJ. The implicit dynamic finite element model is used in the analysis. A dynamic voltage is applied on the PZT array, which is pasted in the middle of the left steel member model, and the signal reception position is arranged in the middle of the right member, as shown in Figure 16.

The schematic of the finite element model.
After the model is established, the model is meshed, and the member element type is C3D8R. Along the circumferential direction of the hexahedron unit, a total of more than 10,000 units are used. The sphere joint element type is also used C3D8R, dividing into more than 20,000 hexahedral elements. Figures 17 and 18 show the specific mesh size and the number of meshes in detail, and the parameters are shown in Table 4.

The FEA model: (a) PZT array arrangement and (b) the entire FEA model.

The schematic of the model meshing: (a) bolt-sphere model meshing and (b) the entire model meshing.
The table of model meshing.

To compare with the experimental results, the mechanical and electrical properties of the PZT transducers and the mechanical properties of the host BSJ are selected as the same as those in the above-mentioned experiment. In the middle of the left side member (point A), a group of 16 PZT-4 type patches with the size of 12 mm × 6 mm × 1 mm are bonded. Meanwhile, in the middle of the right side member (point B), another group of four PZT-4 type patches are also bonded on the surface of the member, as shown in Figure 17. The simulation process can be described as follows: (1) A dynamic voltage with the central frequency of 70 kHz is simultaneously applied on the PZT actuation array for simulating a five-peak impulse. (2) The dynamic vibration of PZT actuators generates a guided wave in the member. (3) The guided wave is traveling through the bolt contact area to the joint and through other contact area again into the other side member. (4) The guided wave induces the vibration of the PZT sensors and transfers into electrical signals, which are restored by the computer. Therefore, the received signal contains the information of the contact area reflecting the bolt looseness situations.
Simulation results analysis
The sensor received signal in time domain is shown in Figure 19. It can be seen from Figure 19 that the amplitude of the first arrived wave package is larger and clearly shows the property of the five-peak impulse waveform. The subsequently received signal packages have smaller magnitudes and more cluttered phenomena due to signal reflections and refractions in multiple interfaces and superimposing together. The first received signal is usually called the first wave which is usually be used for damage identification analysis. By changing the contact area, the bolt looseness phenomenon can be indirectly simulated. However, in the experiment, the BSJ looseness damage is simulated by changing the bolt applied external torques. Unfortunately, the modeling of the bolt connection issue in the ABAQUS simulation is so complicated that it needs a plenty of time to realize, so the simplification is required. It is supposed that the contact area of the bolt has a relationship with the applied external torques. By changing the bolt contact area, the applied torque action can be indirectly but efficiently simulated.
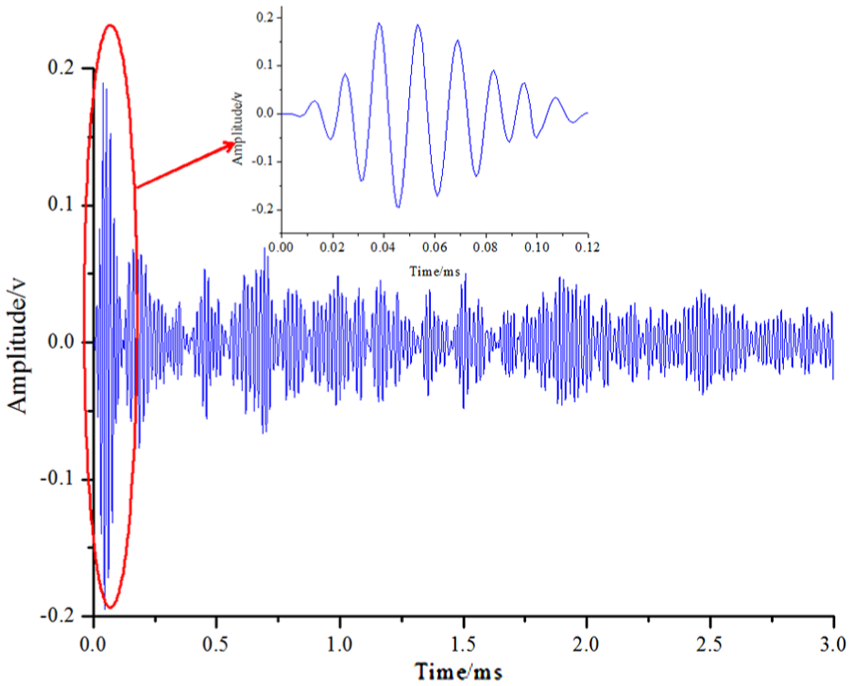
The received signal propagating through single BSJ in SGS model.
Finite element analysis and compare with experimental results
To investigate the behaviors of the PZT-based guided wave propagating through the BSJ and the influence of looseness areas on the received signal energy ratios, the FEA simulation is performed. The bolt contact area between the nut and the sealing plate is carefully meshed to simulate the looseness damage by changing the tied element number. After filtering the received signal, the first arriving wave signal is extracted and analyzed, and the relationship between the bolt contact area and the signal energy ratio is shown in Figure 20(a) where the solid line represents the simulation result. The variable is defined as the contact area percentage, which is the ratio of the contact areas in two kinds of situations. The first situation denotes the bolt looseness one in which the nut and the sealing plate areas are considered. The second situation represents the healthy state in which the nut and the sealing plate are considered in a tight contact. The solid line in Figure 20(a) shows the signal energy ratio gradually increases with the increase of the contact area percentage in an approximately exponential function form.

The compare of numerical and experimental results for BSJ in SGS model: (a) the numerical results and (b) the compare between the numerical results and the experimental ones.
To compare the simulation result with the experimental one, the data of the experiment for the connection angle of 0° in Figure 5 are applied and drawn together in Figure 20(b). But for the experiment, the variable is the external applied bolt torques, which is represented by a solid line with the blue experimental dots. It should be paid attention to that the compare range in the yellow dash area, as shown in Figure 20(a), is corresponding to experimental range, as shown in Figure 20(b). It can be observed by compare in Figure 20(b) that the FEA simulation is consistent with the experimental result of the single BSJ with the connection angle of 0°; however, the signal energy ratio calculated in the simulation is lower than that in the test. The reason could be analyzed as follows. Since the experimental grid structure has multiple interfaces for the single BSJ, including these connections between the sealing plate and the pipe-like member, the nut and the sealing plate, and the nut and the bolt sphere. However, these interfaces are considered as ideal conditions in the simulation. Therefore, the attenuation effect of the signal energy propagation in the simulation might be greater than that in the experiment, causing a decrease of the received energy ratio in the simulation.
Conclusion
The PZT-wave-based bolt looseness damage detection for SGSs is investigated in both experiment and FEA ways in the article. Some conclusions can be made as follows:
It is feasible to identify the looseness damage situation of the BSJ of the grid structure using the piezoceramic guided waves.
The received signal energy is closely associated with influencing factors of the looseness damage degree, the passing routes of the guided waves representing by connection angles, and the passing joint numbers.
Both experiment and simulation results show that the received signal ratios gradually decrease with the decrease of the contention areas, which are represented by external applied bolt torques in the experiment and contact area percentages in the simulation, respectively. The received signal energy changing rule can be described in an exponential function form using the function fitting method.
The signal energy–based algorithm is proposed to identify the BSJ looseness in SGSs, which is verified by both the experiment and the numerical simulation.
Footnotes
Handling Editor: Zhi-Bo Yang
Declaration of conflicting interests
The author(s) declared no potential conflicts of interest with respect to the research, authorship, and/or publication of this article.
Funding
The author(s) disclosed receipt of the following financial support for the research, authorship, and/or publication of this article: The reported research was partially supported by Liaoning Education Department Science and Technology Foundation of China with grant no. LJZ2016029, Liaoning Province Higher Education Fundamental Research Project of China with grant no. LJZ2017002, and National Natural Science Foundation of China with grant no. 51278313.