
Abstract
Since the communication network of the cyber-physical power system is responsible for communicating information, which guarantees the operation of the cyber-physical power system, researchers focus on the stability of the communication system. This article analyzes the risk of the communication transmission link interruption based on the network structure and characteristics of service transmission and proposes a path optimization method. First, we analyze the impact of link disruption on network structure and service, respectively, and quantify the impact as link interruption risk. According to the risk analysis, we propose an optimization method utilizing the Dijkstra’s algorithm and the genetic algorithm to reconfigure service paths, which aims to minimize time delay and realize the equilibrium of service distribution. Through a particular situation, we calculate the link interruption risk and use the optimization method to configure service path for affected service. The results show that the time delays of the optimized service paths are in the acceptable level as well as the balance index of the service distribution is decreased obviously. The simulation experiment reveals the operability of the risk analysis method and the effectiveness of the path optimization method, which provides a technical reference for risk analysis and service path configuration.
Introduction
Power system and information and communication technology are integrated into Smart Grid, or so-called “cyber-physical power system.” 1 Also in Smart Grid, a lot of wireless sensors is distributed to monitor equipment status information. 2 Smart Grid is established on the basis of the high-speed, duplexing, real-time, and integrated communication system. With the development of the complicated Smart Grid, the power grid and communication system are more and more inseparable. The communication system provides fast and reliable communication of data or service from distributed units. The control and management information is carried on the service, which maintains the power grid stable operation. 3 Both mal-operation and shortages in the communication system directly affect the operation of the power grid. Thus, we need to analyze the risk source and risk impact, and put forward a security strategy, like path optimization method to maintain the stable running of the power grid. Given this, it is important to assess the risk of the communication system in Smart Grid.
At present, the communication system of China’s State Grid can be divided into two parts, the backbone communication network and the access network, in the horizontal direction. The backbone communication network covers the control center, 220-kV substations, 500-kV substations, and so on. The access communication network is between the backbone communication network and information terminals. It is responsible for data acquisition, transmission, and management. Furthermore, the backbone communication network is divided into transmission network, data network, and support network in the vertical direction. The transmission network provides the transmission channel for the services. The common transmission technologies are PDH (pseudo-synchronous digital hierarchy), SDH (synchronous digital hierarchy), OTN (optical transport network), and so on. The data network is carried on the transmission network. It utilizes data switching technology, such as Internet protocol (IP) technology, to transmit service between two terminals. And the support network is a special network to ensure the regular operation of the transmission network and data network. In our article, we focus on the transmission network of the backbone network and the services carried on it. The service on the communication network is usually transmitted point-to-point and the service path is fixed. Thus, we can propose an algorithm to optimize the service path.
The communication system in Smart Grid utilizes optical fibers to transmit information. Then, the transmitted information, or so-called “service,” is carried on the optical channel–employed technologies such as SDH and WDM (wavelength division multiplexing). 4 At present in China, the types of widely used optical fibers are OPGW (optical fiber composite overhead ground wire) and ADSS (all dielectric self-supporting optical fiber cable). By the end of 2014, the usage amounts of OPGW and ADSS has been about 227,000 and 341,000 km, respectively with a broad range of distribution. 5 In the actual communication system, the occupied area of a single communication station is small, so it is easier to protect and control the station. On the contrary, the communication cables are exposed to harsher and more complicated environment, so that they are more vulnerable to natural disasters and human-made destruction. Then, it is more practical to study the risk of link interruption.
Currently, there have been some references to explore the risk of the communication network in Smart Grid. Some researchers assessed the risk of communication network utilizing the reliability of the nodes and links in the network. In the study of Peng et al., 6 a risk assessment method is proposed to the communication backbone network (CBN) in wide-area measurement system (WAMS). In order to get the final comprehensive risk value, the risk event probability and the risk impact value were calculated by reliability analysis and analytic hierarchy process (AHP), respectively. And a risk assessment method in the study of Fan 7 combines the complex network theory and the features of communication network risk. It studies the threat of link and loss of link destruction according to the link importance. Some researchers based on the service to assess the network risk and proposed service path optimization. In a service routing optimization algorithm,8,9 the service average risk degrees and service risk balancing degrees are taken as the reliability evaluation indexes of power communication network. The algorithm uses the non-dominated sorting genetic algorithm (NSGA-II) for communication service routing optimized allocation. Jiang et al. 10 refers a service-based comprehensive assessment method for the communication network. It gains two risk indicators: network risk value and network risk balancing value considering service importance and link importance. And some researchers studied the relationship among three-level topological structure: the physical layer, the network topology layer, and the business layer. Guo and Ming 11 analyzes the reliability of optical transmission equipment and optical fiber links based on the three-level topological structure of the power communication network. It builds up service path risk assessment model. Shao et al. 12 also analyzes the risk caused by different level service fault in the physical link layer, network topology layer, and service layer. In conclusion, there are many methods of risk assessment and path optimization for the communication network, but the research on the impact of link destruction caused by external factors and analysis of its impact on the network itself structure were focused away, so we can pay attention to this point to guarantee the stable operation of the communication network.
Figure 1 shows the risk assessment and optimization process of this article and is also the relationship between section “The risk assessment of link interruption communication network” and section “Path optimization method.” In section “The risk assessment of link interruption communication network,” we derive the risk impact index considering the impact of link interruption on network structure and service operation, and further establish the risk assessment model of link destruction and obtain the link interruption risk index. In section “Path optimization method,” we propose a path optimization method utilizing Dijkstra’s algorithm and genetic algorithm (GA) to reconfigure the service paths after link destruction, which aims to decrease the transmission delay and network service balancing index. Besides that section “Simulation and analysis” is to calculate the link interruption risk and configure the service paths using the optimization methods in section “Path optimization method” in a particular scenario. This particular scenario is excerpted from the communication system topology of a district in China. The final section, section “Conclusion” concludes this article, indicates shortages of the article, and points out the future research directions.

The schematic diagram of risk assessment and optimization process.
The risk assessment of link interruption communication network
In the common communication network, the covered area of communication cables is bigger than that of communication stations. The cables are applied in a complex and adverse environment, and the maintenance of these cables is quite inconvenient and challenging so that the communication cables are likely to be threatened by factors like lightning, ice, improper construction, and so on. If a link breaks down suddenly, the network structure will be changed, which will damage stability of the network. Also, the services carried on the broken link cannot be transmitted.
According to the definition of risk,7,13 the link interruption risk is the product of the link interruption probability and the link interruption impact index, as follows

where R is the link interruption risk, P is the link interruption probability, and I is the link interruption impact index. We have studied the link interruption probability in the study of Zhao et al., 14 so in this article, we will focus on the link interruption impact index.
The link interruption impact index
To analyze the impact of link interruption on the communication network, we evaluate the impact from two aspects: (1) impact on network structure and (2) impact on service.
Impact in network structure
In the Smart Grid communication network, the link interruption will cause the loss of communication between two adjacent nodes. And the loss is related to the node connectivity degree. If the connectivity degree of one node is 1, the number of link connected with the node is 1. When the only one link breaks, the node will not communicate with the other nodes and become a cut point of the network. The structure of the communication network is changed. Thus, we can quantify the impact of link interruption using the ratio between the number of cut points and the total number of network nodes. However, when the connectivity degrees of the two nodes are both larger than 1, the broken links may not make the nodes separated from the original network to become cut points. Under this case, we quantify the impact of link interruption using connectivity degree of the two nodes at the end of the interrupted link.
We define the connected graph as G (V, E), where V is the set of nodes, E is the set of links. The number of nodes is |V| = m, and the number of links is |E| = n. Assume the number of broken links is x.
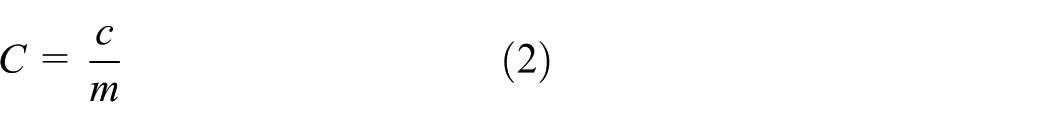
First, we need to determine whether there are cut points caused by the link interruption. The number of cut points is c and the number of the failure links is x1. Then, we define C as the ratio between the number of cut point c and the total number of the nodes m in the network to quantify the impact
If x1 < x, then there still are some broken links which do not create the cut point. Then, we quantify the impact S using the balance degree of connectivity degree for the adjacent nodes. The number of the rest broken links is x2 = x–x1

where di and dj are the connectivity degree of the nodes vi and vj which are the end of link xij, and
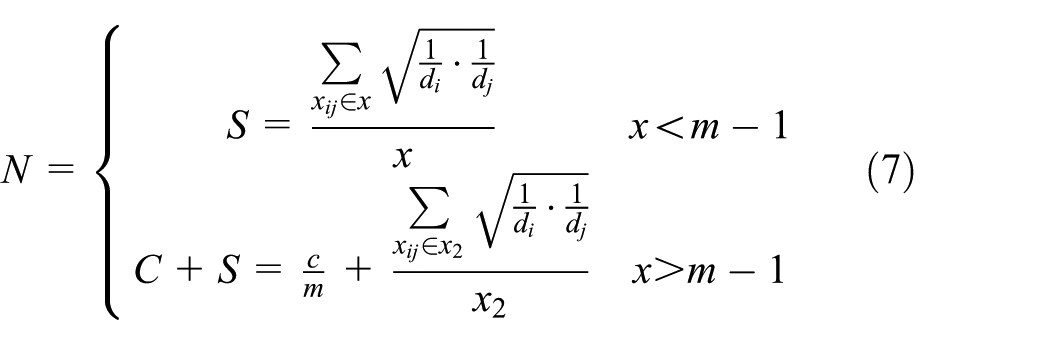
Then, the impact value N of x link interrupted on network structure is shown here

We analyze the impact of link interruption on three different network structures, which are star, tree, and net network structure.
Star network.
For the star network, the Control Center directly connects with all Area Control Unit. When the network is running normally, the management range of the Control Center includes all Area Control Unit. The minimum spanning tree of the network is equal to the whole network as shown in Figure 2.

A star network.
When one link between Control Center and Area Control Unit 1 broke down, the Area Control Unit 1, one end of the link, will be separated from the network and become a cut point. The Control Center cannot schedule the Area Control Unit 1 anymore. Then, for the star network, there is a relationship between the number of nodes and links: m = n + 1.
When x links of star network interrupt, the number of the cut points is c = x, then

Tree network.
The tree network, or the multi-star network, is composed of a plurality of hierarchical star networks. Its minimum spanning tree also coincides with the network itself. The traditional WAMS can be abstracted as a tree network shown in Figure 3. WAMS mainly includes global positioning system (GPS) providing a high-precision clock for synchronization, phasor measurement unit (PMU), phasor data concentrator (PDC), high-speed communication network, and the Control Center for schedule. 15

A tree network.
We illustrate the impact of link interruption in the case of three-level tree network. The bottom Class-A star network is defined as GA (VA, EA). There are a GA networks to form a Class-B star network GB (VB, EB). b GB networks compose a Class-C tree network GC (VC, EC). The relationships between different class networks are shown here

Since the tree network itself is its minimum spanning tree, there is only one path from the Control Center to the bottom node in Class-A, like PMU. When a link of the path interrupted, the lower node will be separated from the network. Thus, the higher the level of the link, the stronger the impact on the network.
Interrupted links at the same class of the star networks.
At the Class-A network
When the links to the Class-A network are broken down, the impact value N is
At the Class-B network
When only the links in the Class-B network are discontinued, the connected Class-A network is entirely cut off from the whole network and becomes a private star network. Then, the impact value N is
At the Class-C network
If the link between the Control Center and Class-B network is broken down, the entire Class-B network will be divorced from the network. The control range of the Control Center is changed to |VC|–|VBi,| so the impact value N is
Interrupted links at the different classes of the star networks
If link interruptions occur in different levels, the high-level network failures will cause the low-level network to separate from the whole network. Then, the impact value N is
Net network.
In one net network, the nodes are connected to each other through the communication transmission lines (Figure 4). Then, each node is connected at least two nodes, whose connectivity degree is larger than 1. We evaluate the impact on a complete graph as an example. Since any two vertices in the complete graph is connected, the connectivity degree of each node is m–1. The relationship between the nodes and the links is

A net network.
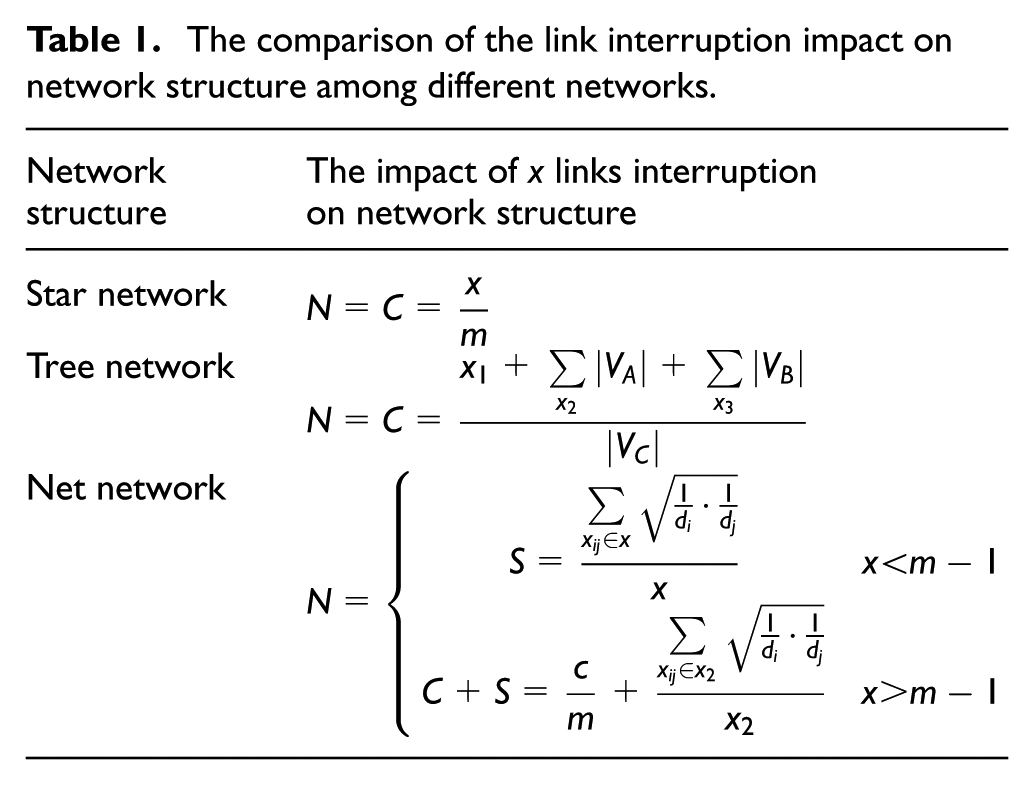
The impacts of x links interrupted on the above-discussed networks are summarized in Table 1.
The comparison of the link interruption impact on network structure among different networks.
Impact on service
The communication network is dedicated for the power grid to exchange information or services like relay protection and firm control. The link interruption will not only change the network structure but also affect services carried on the links. Thus, we analyze the impact on service from the two aspects: average cost of time delay and network service balance degree.
Average cost of time delay.
To prevent an accident, the service running on the communication network always has two paths. One is the main path and the other is the backup path. When the link of the main path is interrupted, the service will be transmitted through the backup path. The time delay of the service will be changed. For one service, we define the cost of the time delay between the main path and the backup path as Δt, then

where
The paths of the all affected services will change to the backup paths which creates the cost of time delay, then we can calculate the average cost of time delay shown here

where L is the number of services carried on the interrupted link and
Cost of network service balance degree.
Network service balance degree is an index to evaluate the distribution of service on the communication network. The large value of the network service balance degree indicates the services are distributed unevenly. Some communication links carry too many services, but few services are transmitted through some communication lines. However, if the index is smaller, close to 0, the distribution of the service is more balance and the communication network is more stable. The number of the service carried on each communication link will be changed if the original main path is switched to the backup path. Then, the service distribution will be changed, resulting in the change of network service balance degree. Therefore, we use the difference between the network service balance degree before and after the communication link interruption to assess the impact on service. The network service balance degrees for the original and the updated service distribution are defined as BD and BD′. ΔBD is the cost of the network service balance degree or the difference between the two network service balance degrees


where Li is the number of the service carried on the ith link,
Then, we can obtain the link interruption impact index I combining together with above impact values

where W1, W2, and W3 are the weights of each impact factors, respectively.
Link interruption risk
The calculation of the link interruption risk should consider two different situations where the link interruption may create a cut point or not. We also assume the number of interrupted links is x, where x1 links generate c cut points and the number of the rest is x2 which do not create cut points. We suppose that the links are independent of each other.
Only when all links connected to a node are broken down together, can the node become a cut point. Or the number of the interrupted links on a node ci is
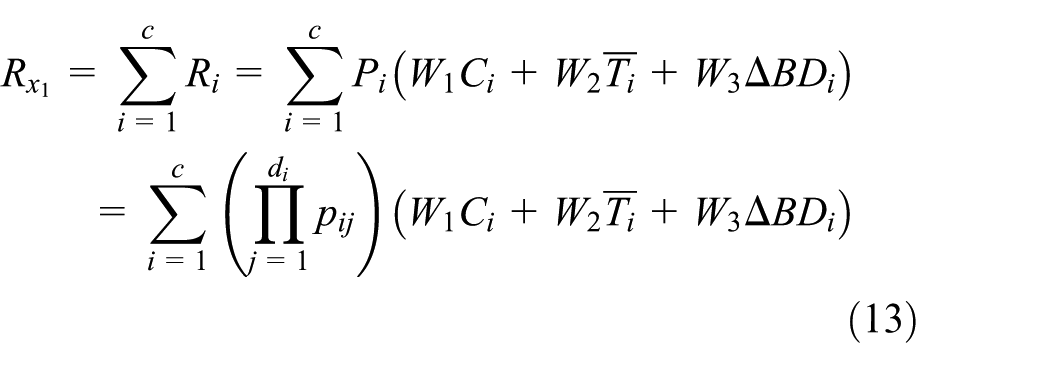
where Pi is the probability of generating the cut point i, and pij is the failure probability of the link j connected with the cut point i.
Then, for the link without generating cut points, the impact on network structure is just concerned with connectivity degree, that is, N = S. Then, the link interruption risk

In summary, when x links are interrupted, the total link interruption risk in the communication network is

Path optimization method
Objective functions
As the communication network structure is difficult to be changed in practical, the link interruption risk can be decreased only when the impact values on service are reduced. Thus, we propose an optimization method to reconfigure the service paths to lessen the impact of link interruption on service. In the analysis of the impact on service, we consider the impact on time delay and network service balance degree. Then, in the optimization method, we construct the minimum weighted sum of the time delay and network service balance degree as the objective functions of the optimization method. And the capacity of each link should be limited so that the service can be distributed on the network evenly. Then, the path optimization model of the communication network is shown here

where
Description of path optimization method
To solve the path optimization model, we first utilize the k-shortest path algorithm 16 to find the shortest time delay k paths for each service. And then, the improved GA is applied to select an optimal solution from the all optional paths. The flowchart of the method is shown in Figure 5, and the specific steps are following:
Step 1. Initialize network G (V, E, W), where V is the set of nodes, E is the set of links, W is the weight of each link: time delay. Set the service list S (sj, j = 1, 2, …, n), sj = (vjs, vjd) including the affected services, where vjs is the service j start node, vjd is the service j end node, and n is the number of affected services;
Step 2. Delete the interrupted links X in G and get a new network G
Step 3. Utilize the k-shortest paths algorithm to find the shortest time delay k paths for each service j in service list S, and the optional service paths set P (Pj, j = 1,2, …, n) is formed, where Pj = {p1, p2, …, pk};
Step 4. Utilize the improved GA with iterations to select an optimal service path set Poptimal from the optional paths set P;
Step 5. Calculate average time delay and network service balance degree of the optimal service path set Poptimal.

The flowchart of the path optimization method.
The process of the GA
The GA is a method to search the optimal solution by simulating the natural evolution. In GA, all the individuals of the population are treated as a single object. To initialize population, we need to determine chromosome coding method and fitness function. The first population generates the second population through selecting, crossing, and mutating. Using the same way, the second population generates the third population …, until the number of iteration is up to the limit. By decoding, the optimal solution can be obtained from the chromosome in the last population. The improved GA flow is shown in Figure 6, and the relevant processes are as follows:

The flowchart of the genetic algorithm.
Chromosome coding
In our article, the chromosomes are encoded with natural numbers. A path of one service is regarded as a gene of the chromosome. The paths of all services compose a chromosome. In the traditional natural number coding, a natural number represents a node, and the service path is coded into a string of natural numbers. Then, the chromosome composed of service paths is quite long and uncertain, and the crossing and mutation processes based on coding position cannot be carried out. Thus, we encode one service path or one gene with one natural number, and the length of the chromosome is the number of services, which is a certain value. Then, the crossing and mutation processes based on the location can realize. The service paths are the shortest time delay k paths obtained from the k-shortest path algorithm. And the natural number is ranged from [1,k].
Population initializing
We randomly generated the first population, and the size is popsize.
Fitness function
The fitness function is used to distinguish the merits of the chromosome in the population. The larger the fitness value, the better the chromosome. In our article, the fitness function is
Selection, crossing, and mutation
The selection function is Roulette selection method and the selected probability of chromosome i is
The GA used in our article is shown in Figure 6.
Simulation and analysis
The case study is carried on a communication network shown in Figure 7, which is excerpted from a communication system of a district in China. We simplified the stations into nodes. In the communication network, the number of nodes is 17, and the number of links is 25. Suppose the number of the service on the network is 9. The main paths and the backup paths of each service are configured using the Dijkstra’s algorithm, and the weight of each link is time delay. The main path of one service is disjointed with the service’s backup path. The data, like the time delay of each link and the failure records of each link, used in the article is obtained from the network management system applied to the communication network.

A communication network topology schematic in an area.
Analysis of link interruption risk
Suppose Link 13–14, Link 13–17, and Link 01–14 were interrupted due to the intense snowstorms. Then, we analyzed the link interruption risk under this circumstance.
The link interrupted probability for the three links can be obtained from the study of Zhao et al.: 14 Link 13–14: p1 = 0.03442, Link 13–17: p2 = 0.02137, and Link 01–14: p3 = 0.03442. From Figure 7, there will be a cut point Node13 due to the interruption of Link 13–14 and Link 13–17. And the interruption of Link 01–14 will not generate any cut points. Thus, p12 = p1p2 = 0.0007356, which means Link 13–14 and Link 13–17 are broken down at the same time.
The weight of each impact factor
The extent of different impact factors may be different. Then, based on AHP,
6
we will establish a judge matrix and calculate its eigenvectors to determine the weights of each impact factors. We also calculate the consistency indexes to ensure the credibility of the weights. First, we use the rule of a judge between every two factors shown in Table 2 to create the judge matrix

The rule of judge between two factors.
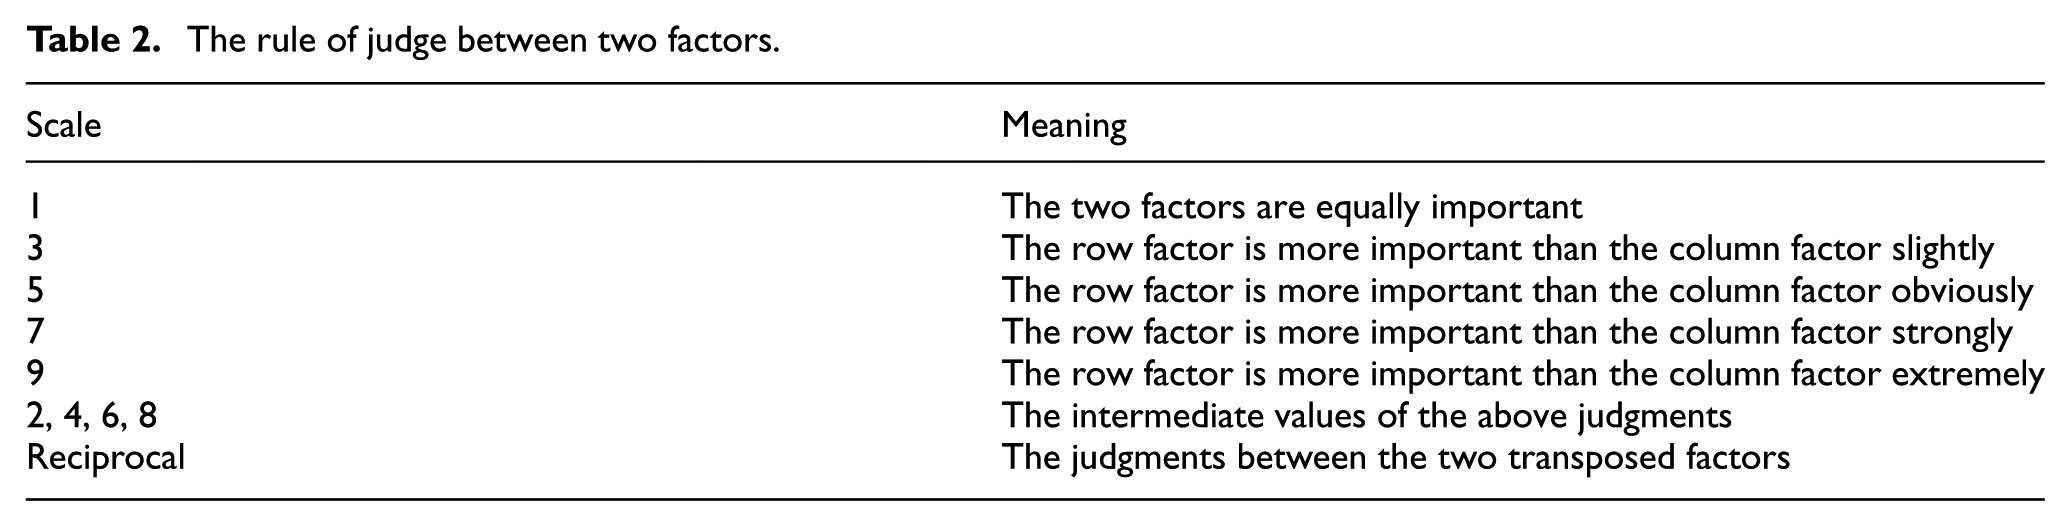
where a, b, and c represent the three impact factors we analyzed before: the impact on network structure, the impact on time delay, and the impact on network service balance degree, respectively. The element Aij of the judge matrix
The eigenvectors of the matrix
The calculated eigenvectors are mapped on [1,10], then the weight Wj of each impact vectors is W1 = 9.048, W2 = 1.35, W3 = 4.038.
The consistency indicator IC, the random consistency indicator IR, and the consistency ratio RC are used to verify the rationality and objectivity of the judge matrix. If the judge matrix cannot satisfy the consistency constraints (RC < 0.1), the eigenvectors will not reflect the relative importance degree of the impact factors
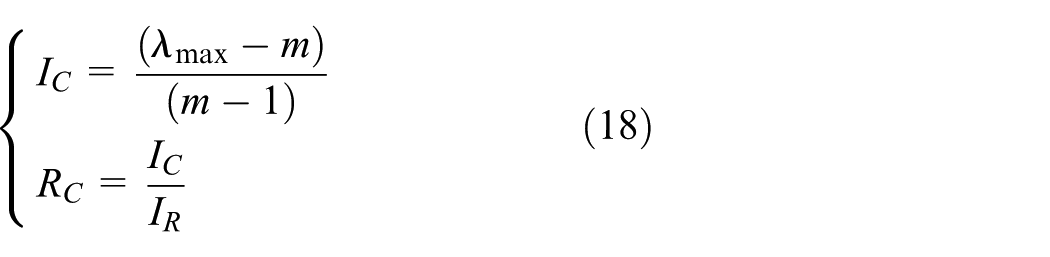
where m is the matrix order. The value of IR is shown in Table 3.
The values of random consistency indicator IR.

When RC < 0.1, the judge matrix has a right consistency. If not, we need to adjust the judge matrix.
In this article, RC = IC/IR = ((3.0858–3)/(3–1)]/0.58 = 0.074 < 0.1, thus the calculated eigenvectors can reflect the relative importance degree of the three impact factors.
The link interruption risk of Link 13–14 and Link 13–17
The disruption of Link 13–14 and Link 13–17 will generate a cut point Node13. The impact of network structure from equation (2) is C1 = 1/17. Then, the services carried on the two links will not be transmitted and the backup paths will replace its corresponding main paths to transfer the affected services. In the service list, the end node of one service is Node 13, so the service cannot be sent anymore. The average cost of time delay

The link interruption risk of Link 01–14
The interruption of Link 01–14 will not generate any cut points, so the impact on the network structure from equation (3) is

In conclusion, the link interruption risk R of the three links is R = R1 + R2 = 0.107144 ≈ 10.71%.
Path optimization
We use the path optimization method to find the optimized paths for the affected services when Link 13–14, Link 13–17, and Link 01–14 were interrupted. The node 13 is a cut point now, so the service whose end node or start node is Node 3 cannot be transmitted. The number of the service is 8 now, then in the GA, the length of the chromosome is 8. Suppose the population size is 100. The number of iteration is 500, the crossing rate is 0.7, and the mutation rate is 0.1. And for the fitness function, α = β = 0.5.
From Figure 8, the fitness of the chromosome in the initial group are in [1.0,1.7] because the original group is created randomly. And after 500 iterations, the fitness is in [1.5,1.8], and in this 500th group, the fitness of 61% of the chromosomes is about 1.75, which shows the effectiveness of the path optimization method.

The distribution area of the original group and the 50th group.
In the 500th group, the gene of the optimal solution is [3,2,3,1,2,3,4,1]. After decoding, we can obtain the optimized paths of each service, which is shown in Table 4. We also utilize the Dijkstra’s algorithm to rearrange the service paths for the affected services, and the new service paths all have the shortest time delay. Table 4 compares the service path, average time delay, and balance degree in the three cases.
The comparison among original service paths and optimized service paths utilizing two different algorithms.

GA: genetic algorithm.
From Table 4, the average time delay of the improved GA is the largest among the three cases, but still within the acceptable range. The other two cases just take time delay into consideration, so that the average time delay is smaller. However, the constraints in the optimization method are both time delay and service balance degree. Because of the link interruption, the number of the links in the communication network is decreased. Thus, the average time delay of the optimized paths, which is still in the acceptable range, is increased. As for the service balance degree, that of the improved GA is the smallest, and is decreased by 27.69% compared with the Dijkstra’s algorithm, which reflects the effectiveness of the improved GA.
Figure 9 shows the optimal solution of the group after each iteration. In this case study, the maximum number of the iteration is 500. And when the number of the iteration is around 100, the optimal solution is almost stable, which shows the optimization method has good convergence.

The optimal solution of each iteration.
Conclusion
To evaluate the impact of link interruption on the communication network in Smart Grid, this article builds a risk analysis model of link interruption and proposes a path optimization method for the services carried on the broken links. First, we analyze whether there is a cut point created by link interruption to evaluate the impact on network structure. Second, we analyze the impact on service from communication cost and service balance degree. Furthermore, the link interruption risk is obtained according to the risk definition. For the affected service, we utilize GA to reconfigure paths with time delay and service balance degree as constraints. Through the simulation experiment, we verify the effectiveness of the algorithm, where the services’ time delays are all in the acceptable range, and the service balance degree is decreased obviously.
However, there are some imperfections in this article. For path optimization, we utilized a simple method of selection, crossing, and mutation in the GA, which has shortages like “premature convergence.” In our future research, we will improve our algorithm to reduce the negative impact and increase the algorithm efficiency. In our article, we analyze the impact of communication transmission link interruption on network topology. In order to reduce this impact, the network topology needs to be transformed. Then, in our future research, we will study how to optimize the communication network, with the service path optimization. And the evaluation indexes about the impact of communication link interruption on service are time delay and service load, which are the fundamental Quality of Service (QoS) indexes. In our future, we can consider other QoS index to analyze the impact to set up a more comprehensive assessment model.
However, with the continuous development of Smart Grid, the interdependence between the communication network and the power grid is stronger. The communication link interruption affects not only the communication network but also the power grid. In the future, we will study the interruption impact both on the communication network and power grid.
Footnotes
Handling Editor: Suparna De
Declaration of conflicting interests
The author(s) declared no potential conflicts of interest with respect to the research, authorship, and/or publication of this article.
Funding
The author(s) disclosed receipt of the following financial support for the research, authorship, and/or publication of this article: This work was supported by Project of State Grid Corporation of China—Research on Communication Architecture and Hardware-In-The-Loop Simulation for Real-Time Wide-Area Stability Control of Electric Power System (SGGSXT00GCJS1600065), the 863 Program (grant no. 2015AA01A705), and National Natural Science Foundation of China (NSFC) (grant no. 61271187).