
Abstract
In this article, an improved malicious code intrusion detection method is presented based on the target tree for space information network, so as to adapt to the characteristics of space information network and the security requirements. The satellite system could realize the quick determination of the malicious code attacks formed by joint cooperation behaviors step by step, with the help of attack roadmap analysis at ground and malicious code behavior analyzing process at satellite. The simulation results show that the proposed method has the advantages of high detection rate, low satellite resource consumption, low latency, and in-depth analysis to those malicious code behaviors. It is demonstrated that the proposed detection method of malicious code is suitable for the space information network.
Introduction
In recent years, the space commutation is at the stage of rapid development. As is known, space information network, which can achieve the connectivity of space and ground network, would become a basic technology foundation in the future information war.1,2 However, there are many security threats in the space information network due to the lack of physical isolation. Large differences are existed in variable environment, platform, resources, and tasks between space and ground network. The network performance could be unavailable or decline if the existing security technologies are introduced directly to space information network.3,4 Therefore, it becomes an important question to make sure the safety of space information network.5–8 Malicious code, as an important factor influencing the space information network security, has become a focus of space information security research.
Malicious code can cause instantaneous state changes to system by accessing to unauthorized system resources according to the references.9–11 There are numerous approaches about intrusion detection of malicious code proposed in latest network security papers.12–14 For example, L Liu and DP Li 12 adopted the BM algorithm to match attack behaviors with malicious code signature through a virus signature library, Y Li 13 et al. proposed a method which utilized deep belief network learning method to detect malicious code by reducing the dimensionality of data first, and X Yu 14 designed a malicious code algorithm based on network behavior analysis. The aforementioned traditional intrusion detection methods based on malicious code on the ground can achieve high detection efficiency. However, the general detection algorithms are quite complex and time-consuming. Thus, these methods are not suitable for space information network.
A malicious code detection method based on target tree is presented based on the further study of behavior characteristics and perniciousness of the malicious code.15–17 Such method is first employed in the algorithm for local invasion and entire invasion by MY Huang et al. 18 and then referenced and improved by W Yin et al. 19 and L Xie and Y Ping. 20 This method has higher detection speed and rate, whereas it could only detect intrusion behaviors according to the target tree structure and cannot do a deeper level of data mining21,22 and analysis. In addition, there is no limit to the demand for memory for the existing analysis methods. However, it should be noted that the resource of space is extremely lack.23–25 In this article, we improve the traditional intrusion detection method based on target tree, combining with the characteristics of space information network and security requirements.26–28 The traditional intrusion detection algorithm based on target tree can be described as follows: according to the built target tree, do pattern matching between the tree node behavior and the captured attack behavior and then mark the nodes which have happened and use the bit operation and the target tree structure like “and,”“or,”“ordered-and” to judge whether the target is formed. We improve the detection mechanism and analysis method with the most likely attack roadmap algorithm. The most likely attack roadmap could be achieved by doing depth data mining to possible attacks through four indexes: time, cost, impact, complexity. Besides, we optimize cache mechanism by building the pending pool with the maximum effective time. Then the intrusion detection behaviors are determinated by the satellite and ground system. The efficiency of intrusion detection is improved in this way.
This article consists of two parts (section “Improved malicious code detection based on target tree” and section “Simulation”), as follows: the first section describes the improved malicious code intrusion detection method based on target tree for space information network in detail from two aspects: design of intrusion detection architecture and the realization of improved intrusion detection scheme based on target tree. In the second section mentioned above simulations are conducted to compare the detection method proposed in this article and the traditional detection method based on target tree from three aspects: time consumption, detection rate, and improvement of cache optimization mechanism.
Malicious code detection based on improved target tree
We can explain the method in two aspects: detection architecture and detection scheme.
The design of intrusion detection architecture
The main parts of the method are attacker, satellite node, and ground station. Note that attacker sends data packets with malicious code to satellite node. Meanwhile, the method completes jointly with satellite and ground system, which includes detection mechanism (section “The intrusion detection mechanism”) and analysis mechanism (section “The analysis method”). This architecture diagram is illustrated in Figure 1.

The design of intrusion detection architecture.
The realization of improved intrusion detection scheme based on target tree
The realization of improved intrusion detection scheme based on target tree consists of three parts: target tree modeling, intrusion detection mechanism, and analysis method.
Target tree modeling
Ground station establishes a matchable tree model according to three basic operations (“and,”“or,”“ordered-and”) and the characteristics of malicious code. First, ground station collects data sources N and malicious code sequence A. Then, we make target tree model according to the traditional and common target tree generation (TTG) algorithm. 29
The main process of this algorithm is explained as follows: firstly, extract features from data sources, and sort out all the attack behaviors. Next, classify them into different intermediate process of different layers. Then, create a target tree. At last, test whether it can describe such malicious code attacks exactly.
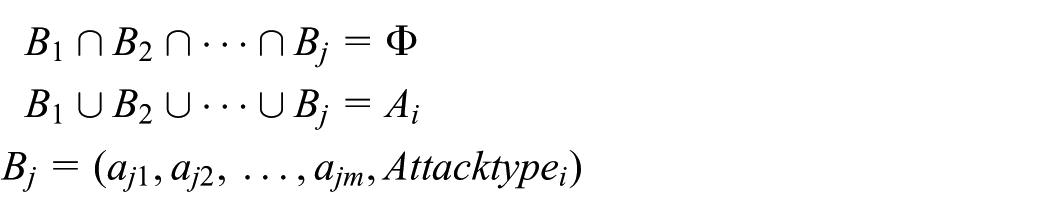
We can describe the data sources as

In this,
Therefore, the process of TTG is shown as follows:
Input:
Output: target tree.
For
Step 1. Set
Step 2. We can divide
Step 3. Sort out all the elements in
Step 4. Calculate
Step 5. Add other intermediate process or subgoal into branches of “or” or “ordered-and” node, repeat step 4 then the algorithm is over. Else go to step 3, and do another classification process.
After finishing TTG algorithm, we get a target tree model, which can describe all types of attack in N.
The intrusion detection mechanism
We design the improved malicious code intrusion detection mechanism based on target tree in detail, as shown in Figure 2. The buffer or databases used in this system is explained in the following.

The improved intrusion detection mechanism based on target tree.
Pending_B Buffer pool
We establish a cache optimization mechanism, which is a buffer pool of malicious code behavior with maximum effective time. It is used to save the malicious code behaviors which had been detected, but are not yet complete the target tree matching. Every behavior will start the timer when it enters the Pending_B Buffer pool. Once the time is over the maximum effective time, buffer pool immediately deletes the timeout behavior, which can maximize the utilization of the limited resources in space information network. The introduction of cache optimization mechanism has many advantages, avoiding determining the malicious code attack only by single-attack behavior and avoiding that some attack behaviors occupy memory space for too long time, making a full use of resources in space information network, and reducing resource utilization, to name a few.
Malicious code_B Database
Target tree modeling can create the target tree of every kind of malicious code attack. The subgoal node is the behavior features of malicious code, the intermediate node means the intermediate process completed by subgoal node, and root node represents every kind of malicious code behavior. According to the tree structure after target tree modeling or relationships between tree nodes, extract the behaviors in each node of the tree to establish database of malicious code behavior and each behavior is saved with a unique number.
Malicious code_R Database
Include target tree matching rules, which refers to the level traverse node sequence set of every target tree after target tree modeling. In addition, the database includes the most likely roadmap of each kind of malicious code as an ordered sequence which is updated by ground station. The rules in Malicious code_R Database is adopted for determination of malicious attacks. The formation process of the most likely roadmap is shown in part 1, in section “The analysis method.” By this way, the traverse sequences set and the most likely roadmap are actually formed by the sequence of malicious code behavior number with relationship symbols in Malicious code_B Database. These symbols include interval symbol between layers, relationship symbol between nodes. Relationship symbols between nodes are also divided into three kinds: node behaviors happen at the same time, node behaviors happen in order, and node behaviors happen without order.
Step 1. Check the satellite system regularly, capture the data packets with abnormal behaviors, and do pattern matching between abnormal behaviors and common malicious code attack behaviors in Malicious code_B Database.
Step 2. Put the data which have been matched into the Pending_B Buffer pool. Extract data from the Pending_B Buffer pool. Next, we go through Malicious code_B Database to find the numbers of the behavior and go through Malicious code_R Database to determine which target tree each pending behavior belongs to and find out the corresponding most likely roadmap and the level traverse knot sequences set of the target tree, then do Roadmap matching.
Step 3. As for Roadmap matching, first according to the detecting time of each behavior in pending_B pool, we compare the corresponding most likely roadmap namely the knot sequence including relationship symbols with the behavior numbers one by one and judge whether each one of behaviors happens by comparison. If it happens, then change the logic value of the node to “1” and get the happened behavior nodes sequence. Next, determine whether the attack has formed by the analysis method described detailedly in the first half of part 2 in section “The analysis method.” If the attack has formed, alert. Else do the target tree matching.
Step 4. As for target tree matching, in a similar way as above, first we compare every kind of level traverse knot sequence of the target tree with the behavior numbers one by one according to the detecting time of each behavior in pending_B pool to judge whether each behavior happens; if it happens, then change the logic value of the node to “1” and get a set of the happened behavior nodes sequences. Next, determine whether the attack has formed by the analysis method described in detail in the last half of part 2 in section “The analysis method.” If any one kind of sequence matches the behavior numbers in pending_B pool, then it represents the attack has formed, alert. Else go to step 5.
Step 5. Wait for subsequent behaviors which can form attacks with the other existing malicious code behaviors.
Step 6. If subsequent behaviors are not detected within the maximum effective time, that is to say, run out of time, delete the failure behaviors which have timed out and release memory.
The analysis method
The intrusion detection method completes jointly with two parts.
Part 1: Attack roadmap analysis at ground
According to the built target tree, ground station does deep analysis on malicious code behaviors, in order to assist satellites in detecting attacks more quickly. It is realized by finding the most likely roadmap of each attack and putting them into the database. Meanwhile, ground station updates Malicious code_R Database and Malicious code_B Database timely. The algorithm of finding the most likely roadmap is shown as follows in detail.
According to the built target tree, for each tree node, first, set
Definition 1
Define four attributes including
Definition 2
Define w as the weight of attribute of each tree node, thus as for the four attributes which are referred in Definition 1, their weights are
Thus, we can get the formula of risk of tree node

In the formula above, as for (1),
Then, through the above formulas, after going through intermediate nodes via different routes and reaching the root node or accomplishing the attack, we can get all the risk values
The purpose of ground station analysis is to find the most likely roadmap of each attack, which means that we have to get the max value of
It is a recursive problem in multi-way tree to find the most likely roadmap; the most likely roadmap is a set of sequence of subgoals. Start from the root node and traverse the entire target tree, it is noted that as for every node per layer in the target tree, they follow the traverse order from left to right. First, judge the type of the node including “and,”“or,”“ordered-and,” and ”subgoal.”
If it is the subgoal, put this node into the most likely path list. If it is “and” node, regard its child nodes as the root node of the next recursive, repeat this function and until its child node is the subgoal, put this node into the most likely path list one by one.
If it is “ordered-and” node, it is similar as “and” node; however, the difference between them is that the subgoal nodes are put into the most likely path list with symbols; the symbols represent the relative order of two nodes.
If it is “or” node, just regard its child node of biggest risk value (
Part 2: Malicious code behavior analyzing process at satellite
The malicious code behavior analyzing process at satellite can be divided into two parts: on one hand, in Malicious code_R Database, we have saved the most likely roadmap as a knot sequence with relationship symbols, which can represent the ordered and unordered relationships between node. Thus, according to the sequence with symbols, we can create a directed graph to analyze and determine whether the attack has formed, we put the unordered nodes as one node set into the same node and put the ordered nodes into different nodes in order in the directed graph. After changing the logic value of nodes, compare the happened behavior nodes with the nodes of directed graph. If the occurrence order is consistent with the directed graph sequence, we can determine whether the attack happened in space information network.
On the other hand, we can make an analysis of target tree. There are three relationships of tree nodes, “or,”“and,”“ordered-and.” As for “or,” any one of subgoals can complete the intermediate process. In other word, if there is a node whose logic value is 1, then the logic value of intermediate process is 1. As for “and,” each subgoal should happen and then the intermediate process can be completed, which means the logic value of intermediate process is 1 only if all subgoals are 1. As for “ordered-and,” each subgoal should happen in a certain order. We can regard it as a more advanced “and.” After changing the logic value of nodes and the analysis of target tree, we can determine whether the attack happened in space information network.
Simulation
Simulation environment
In this article, we simulate the intrusion detection scheme using vc++6.0, run time infrastructure frame, and snort. Attack effect display module and intrusion detection module are shown in Figures 3 and 4. In the two modules, we can see links between satellites and ground station with the background of 2D figure of the earth in the satellite topology figures.

Attack effect display module.

Intrusion detection module.
Attack effect display module
Topology display area can display current attack effect in real time from Figure 3. When the attack happens, the red dotted line between the attack and the anti-attack in the topology display lasts about 5 s. In addition, we can set parameters in parameter settings area (right-hand side of Figure 3). For malicious code attacks, they are including attack source, destination, and code number which refers to malicious code sequences used in the simulation. Log display area shows the type of real-time attacks and timestamp.
Intrusion detection module
Figure 4 depicts the topology display area. It can be seen that the detected corresponding attack effect from the figure. Once the malicious code attacks are detected, the red dotted line between the attack and the anti-attack in the topology display could last about 5 s. Alarm display area illustrates alarms which are made up of timestamp, detected type of attack, the ID of the attack, and the anti-attack.
Simulation result
Time consumption
In order to analyze the limiting case of the proposed method, it is assumed that the maximum effective time is infinite. With different situations of variable attack behaviors, we simulate and analyze the total detection time and the analyzing time through the method mentioned in this article. In the simulation, the results can be obtained by recording or counting the start time of attack (


As shown in Figure 5, the light part represents the total detection time, and the dark part denotes the analyzing time. The average total detection time is 2.665 s, and the average analyzing time is 0.120 s. As the number of attacks increases, the total detection time and analyzing time expand but not so fast. From the figure and calculation, it is clear that the analyzing time accounts for only 4.84% of total detection time, the improved comprehensiveness and high efficiency of detection can be achieved.

Time consumption.
Detection rate
In order to analyze the effect of the introduction of target tree on malicious code detection, it is assumed that the maximum effective time is infinite, which means that the cleaning of cache would have no influence on malicious code detection. We assume that attacker sends one packet with malicious code every second. From the experimental analysis, it is obtained that the detection rate of improved malicious code detection method with target tree is 94.65%, and the detection rate of malicious code detection method without target tree is 27.7%. Therefore, the introduction of target tree can make system detect the malicious code attack which is collectively completed by various attack behaviors. However, it should be noted that the method without target tree can only detect the single attack behavior, which has significant limitations. The detection rate analysis and comparison are tabulated in Table 1.
The detection rate analysis and comparison.

Improvement of cache optimization mechanism
In the simulation, we send an attack per second and use 20 s as the maximum effective time to realize the simulation of detection time and memory optimization rate. Then, we compare the method with traditional malicious code detection method which is the most commonly used. The traditional method can only detect intrusion behaviors according to the target tree structure. The comparison is shown as follows.
In Figure 6, the curve with triangular and the curve with the point represent the detection time with cache optimization mechanism (marked in the legend as improved target tree for short) and that without cache optimization mechanism (marked in the legend as common target tree for short), respectively. We can obtain from the figure that the detection time of the curve with cache optimization mechanism is in a steady state basically as time progresses. At the same time, the mean time to detection is about 2.5 s. However the detection time of the curve without cache optimization mechanism increases continuously and detection efficiency decreases greatly over the time.
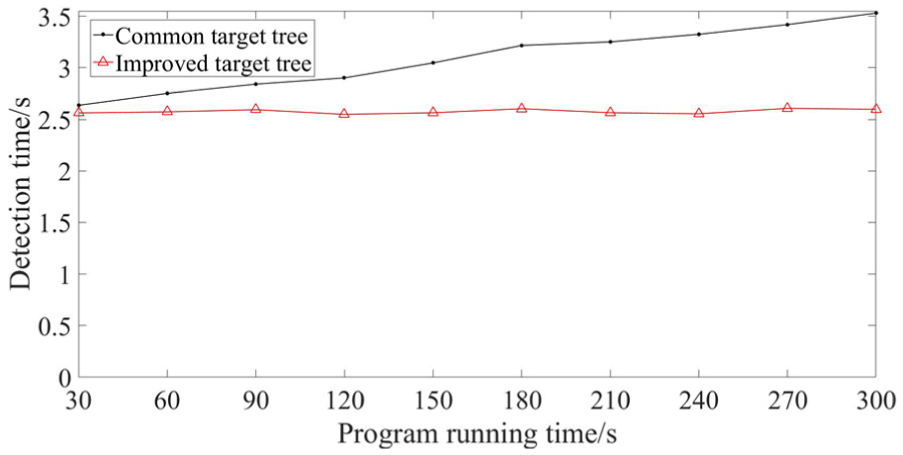
Detection time.
In order to show the optimization of memory using cache optimization mechanism as time progresses, we count the total memory of attacks with cache optimization mechanism (

As time progresses, the optimized rate of memory improves from 36% up to around 100% which can be seen from Figure 7. Compared with the traditional method, this cache scheme has a great optimization.

Memory optimization rate.
As shown in the simulation, compared with the traditional method, the proposed method has low time consumption, high detection rate, and memory optimization rate. However, it is inevitable that the introduction of cache optimization mechanism would bring an effect on the detection rate of malicious code. In the real-life situation, we can set effective time according to the security requirements, resource limitations, and malicious code attack behaviors, in order to make the greater optimization effect in the premise of guaranteeing security.
Conclusion
This article proposes an improved malicious code detection method based on target tree according to the behavior characteristics of the malicious code. This method completes jointly with satellite and ground station based on the extraction of malicious code, not only can identify simple single malicious code intrusion behavior, but also can detect malicious code attacks formed by joint cooperation behaviors step by step. In addition, the ground station creates detection rules including the most likely roadmap on ground and makes detection quicker on the satellite. Compared with the traditional malicious code detection method, this method has higher detection efficiency, comprehensive analysis results, and consume less calculation resources on the satellite. And according to the results of the simulation environment, this method achieves desired results and is suitable for space information network.
Footnotes
Appendix 1
Detection time.

| Time (s) | Improved target tree (s) | Common target tree (s) |
|---|---|---|
| 30 | 2.5628 | 2.6366 |
| 60 | 2.5731 | 2.7521 |
| 90 | 2.5943 | 2.8405 |
| 120 | 2.5488 | 2.9009 |
| 150 | 2.5643 | 3.0466 |
| 180 | 2.6039 | 3.2161 |
| 210 | 2.5648 | 3.2505 |
| 240 | 2.5543 | 3.3243 |
| 270 | 2.6074 | 3.4185 |
| 300 | 2.5984 | 3.5101 |
Handling Editor: Haibo Zhou
Declaration of conflicting interests
The author(s) declared no potential conflicts of interest with respect to the research, authorship, and/or publication of this article.
Funding
The author(s) disclosed receipt of the following financial support for the research, authorship, and/or publication of this article: This work was supported by the National Natural Science Foundation of China (91438120). And the Foundation of advanced research.