
Abstract
Networks continue to grow as industries use both wired and wireless networks. Creating experiments to test those networks can be very expensive if conducted on production networks; therefore, the evaluation of networks and their performance is usually conducted using emulation. This growing reliance on simulation raises the risk of correctness and validation. Today, many network simulators have widely varying focuses and are employed in different fields of research. The trustworthiness of results produced from simulation models must be investigated. The goal of this work is first to compare and assess the performance of three prominent network simulators—NS-2, NS-3, and OMNet++—by considering the following qualitative characteristics: architectural design, correctness, performance, usability, features, and trends. Second, introduce the concept of mutation testing to design the appropriate network scenarios to be used for protocol evaluation. Many works still doubt if used scenarios can suit well to claim conclusions about protocol performance and effectiveness. A large-scale simulation model was implemented using ad hoc on-demand distance vector and destination-sequenced distance vector routing protocols to compare performance, correctness, and usability. This study addresses an interesting question about the validation process: “Are you building the right simulation model in the right environment?” In conclusion, network simulation alone cannot determine the correctness and usefulness of the implemented protocol. Software testing approaches should be considered to validate the quality of the network model and test scenarios being used.
Keywords
Introduction
Today’s network simulators are widely used in the mobile world. Simulation networks are valuable tools with which to investigate the behavior and performance of new protocol designs, while reinforcing their understanding of networking concepts. Network simulation tools save money and time by offering researchers the possibility to test network protocols in virtual environments that might be difficult or expensive to emulate using real hardware, such as routers, computers, or switches. Simulation is the most common approach to developing and testing newly designed protocols; therefore, there is a need to select the appropriate approach by which to analyze and collect data in simulation environments. To this end, simulation remains a powerful tool, but some related potential drawbacks have emerged 1 because simulations use queuing theory and discrete events to reflect real scenarios. Missing documentation and tech support could also negatively impact the user. To be credible, simulation results must be produced by a serious of actions and well-designed test scenarios following specific methodology.
Currently, there are many network simulation tools (listed in Hogie et al. 2 ) that allow users to model local area networks (LANs), metropolitan area networks (MANs), and wide area networks (WANs); these include NS-2, 3 NS-3, 4 OPtimized Network Engineering Tool (OPNET), 5 QualNet, 6 and OMNet++. 7 There are several criteria for evaluating the behavior and performance of network simulators. In this contribution, we offer a thorough comparison study of two prominent network simulators, NS-2 and NS-3, based on their architecture and performance results. A real simulation scenario is implemented for both environments using various mobile ad hoc network (MANET) routing protocols to give verisimilitude to our study.
NS-2 is a popular software for network simulation, as it provides simulation and research supports for wired networks, wireless networks using transmission control protocol (TCP), and user datagram protocol (UDP), internet protocol (IP), and cluster based routing protocol (CBR) patterns of communication. A scripting language can be used to configure a network and observe results generated by NS-2. In comparison, NS-3 offers some interesting characteristics that allow developers to cover a new research trend called software-defined networks (SDNs), which overcomes the limitation of existing network architecture in flexibility, energy, and traffic management, as well as the innovation shortage for the network research community due to the absence of real network environments.
It is important to bear in mind that using and relying on only network simulations is not sufficient. A software testing approach should be followed, such as state transition testing 8 or mutation testing. 9 Current results must be compared with expected results to draw final conclusions. Table 1 presents a comparison of several basic qualities of NS-2 and NS-3.
Comparison of basic qualities of two network simulators, NS-2 and NS-3.

Particularly in the case of real systems, these tools can severely restrict the flexibility of network model construction and can make it difficult or impossible to model. The behavior of the developed models can never be completely guaranteed to behave as intended. Hogie et al. 2 presented a performance comparison between NS-2, NS-3, OMNeT++, and GloMoSiM using ad hoc on-demand distance vector (AODV) routing protocol. Three variables must be considered to evaluate routing protocol using simulators: memory usage, computation time, and CPU utilization. 2 Table 2 illustrates the comparison.
Performance comparison.

The remainder of this article is organized as follows. First, in section “History of network simulators,” we give a brief history of network simulators. Next, we summarize related work concerning network simulation comparisons in section “Related work.” Section “Evaluation approach and discussion” then provides a comprehensive comparative study of NS-2 and NS-3 and describes the simulation scenario and results analysis. Finally, section “Conclusion” presents conclusions and areas for future work.
History of network simulators
Until the 1950s, computer simulation was not something that fascinated many people because it took too long to produce credible results and required many skills and resources. A discrete event computer simulation for the telephone system was used by IBM, 10 but unfortunately took too long.
Network simulation has been an important resource for functional and performance analyses of network protocols. Currently, the number of widely adopted network simulators is large, and new tools and systems continue to be developed to overcome previous problems and disfunctionalities. This may raise an important question concerning the credibility of previous published simulation studies; however, a brief network simulator history discussion may clarify this issue.
Network simulation has a long history. A timeline of major simulators’ releases is shown in Figure 1.

A timeline of release dates of major network simulators.
To the best of our knowledge, SLAMII was the first simulator to include a network module.11,12 It is a general-purpose language that uses process, event, or continuous world views. An extended version called SLAMSYSTEM was introduced in 1988. The first version of Network Simulator, known as NS-1, was developed at Lawrence Berkeley National Laboratory (LBNL) by Steve McCanne, Sally Floyd, Kevin Fall, and other contributors. Later in 1985, an extended version, NS-2, 3 was developed by defense advanced research projects agency (DARPA) and has since evolved. The Network Simulator was written in C++ with a TCL scripting level for scenario simulation and was originally derived from the REalistic And Large (REAL) 13 network simulator, to analyze the dynamic behavior of flow and clogging of manage schemes in packet switch data networks. In comparison, SWANS 14 was developed on top of the JiST platform 14 to form a complete wireless network or sensor network configuration. SWANS was surprisingly efficient for computation of signal propagation, using hierarchical binning. In 1997, the Network Based Environment for Modelling and Simulation (NETSIM) 15 was developed by Tetcos and the Indian Institute of Science. It was made available for commercial and academic purposes, providing support for ATM, TCP, FDDI, IP, Ethernet, and WN types of network protocols.
OMNeT++ 16 is a modular discrete event network simulation framework used primarily for building network simulators. It has a generic architecture, so it can be used for functional and performance analyses of wired and wireless communication networks. Additionally, OMNeT++ supports parallel distributed simulation in order to increase the processing power of a simulation. Currently, OMNeT++ 5.0 is available for download. 16 This version has a major modification and introduces significant new features compared to the last 4.x version. Another network simulator, QualNet, 6 was developed in 1999 by Dr Rajive Bagrodia and his research group to predict the behavior of dynamic communication environments. QualNet supports wired, wireless, and mixed networks and is a descendant of the open-source simulator GloMoSim, 17 which stopped releasing updates in 2000.
In 2007, OverSim 18 was developed as an extension of OMNeT++ to support structured and unstructured peer-to-peer networks. It provides several common functions that can be used for both simulation and real-world networks. Castalia 19 is another extension of OMNeT++, used for low-power embedded devices. It was built at the Networks and Pervasive Computing program of National ICT Australia and is designed to be used to measure data instead of making specific assumptions based on the creation of fast fading.
In 1986, an initial development work was started for OPNET 5 and in 2000 the product went public. In October 2012, OPNET was acquired by Riverbed Technology and became commercially available. OPNET enables the simulation of entire heterogeneous networks with various protocols, using a vast library of accurate models and protocols.
In 2008, NS-2 underwent a major revision and was replaced by a new simulator called NS-3. 20 Research groups from the US National Science Foundation headed by Tom Henderson developed NS-3 as a new open-source project for network simulations. The simulator was written from scratch using C++ and was not compatible with NS-2. The first release appeared in June 2008 and the latest release, NS-3.26, was rescheduled to early September 2016. 20
Simulation have been an important resource for functional and performance analyses of computer networks. Although the number of widely adopted network simulators is small, new ones continue to be created to address gaps in the functionality of existing tools. It can be argued, however, that the scientific community’s greatest need is to raise the credibility of published simulation studies. Based on the literature, a number of procedural difficulties stand in the way of the production of credible simulation-based studies of computer networks.21,22 These papers enumerate problems in methodology that cast doubts on the accuracy of simulation studies. This statement is well supported by the various updates, 5 the halting of the release of some versions,4,7 and the ending of support and maintenance for others.3,23 For example, NS-1 is no longer developed or maintained, and NS-2 is not actively maintained (active development stopped in 2012 and works using it are no longer accepted for publication). NS-3 is being actively developed, but is not compatible with NS-2.
Related work
The related area of work relevant to the current contribution is comparative reviews of network simulators. Various network simulators exist throughout the research community for building and evaluating new protocols that are developed, as well as for comparing these new protocols with existing protocols. Many research works have been presented in this area;2,22,24–26 however, none of them provide any comparative study. Rather, they present a description of each simulator independently. A paper by Weingartner et al. 27 presented a survey of recent network simulators where a performance analysis criterion was used for comparison. A different approach was pursued by Karl, 28 where architectural design characteristics were used for comparison. A formal comparison based on usage popularity, implementation, and installation issues was described in Lessmann et al., 29 whereas Lucio et al. 30 presented a comparative study of two popular network simulators, OPNET and NS-2, based on packet-level networks. In Duflos et al., 31 the authors compared various network simulators, such as OPNET, NS-2, QualNet, OMNeT++, J-Sim, 32 and Backplane, and tested their suitability when used for simulation of critical infrastructure.
The works described in Luis Font et al., 33 Ikeda et al., 34 and Luis Font et al. 35 are perhaps the most relevant ones to this study. In Luis Font et al., 33 the authors presented a comparative study of the network simulators NS-2 and NS-3 by considering source code metrics as qualitative characteristics. Ikeda et al. 34 presented a performance comparison of network simulators that are specially designed for wireless ad hoc networks. Throughput simulation results of NS-2 and NS-3 were given to evaluate the performance of wireless ad hoc networks. Luis Font et al. 35 compared both network simulators from the point of view of developers; however, they excluded network performance and resource consumption assessment.
The main difference between this work and the previously mentioned contributions is that we have concentrated our comparison study on the most popular network simulators, NS-2, NS-3, and OMNeT++, using the latest versions: NS-2.35, NS-3.19, and OMNeT++ 5.1. Moreover, we performed the comparison by combining both developer and user judgment points of view. By “user judgment,” we mean analysis and performance issues. Network simulators’ users require a clear and simple process through which to select the most suitable tool for meeting their needs. In addition, the way in which users collect output data for result analysis is very important for building a valuable and true conclusion for a new routing protocol. Additionally, compared to Ikeda et al., 34 we used a large-scale scenario (1000 nodes) and various MANET routing protocols, to evaluate the performance of the network simulators.
Evaluation approach and discussion
Other studies have compared many network simulations by focusing on the description of each simulator independently or by mainly selecting a single comparison criterion, such as source code 33 or network performance. 34 In this work, we adopted a different approach to tackle both developer and user points of view, using a large-scale scenario and various ad hoc routing protocols. This article assessed the network simulators NS-2, NS-3, and OMNeT++, as well as their evolution, by considering qualitative and quantitative characteristics: architectural design, usability, features, trends, documentation, network performance, and scalability.
Architectural overview
Network simulators have different focuses and are employed in different fields of research; hence, they vary in their architecture. System architecture is a central element that enables the construction of complex simulations’ systems. It is therefore important to consider the system architecture as a first characteristic when comparing different simulation environments. In this section, we investigate the characteristics and the directions of NS-2 and NS-3 architectures.
NS-2 architecture
NS-2 is a discrete event simulator for network simulation where actions are associated with events, rather than time. Its architecture is composed of five components: event scheduler, network, Tclcl, OTcl library, and Tcl 8.0 (Figure 2).

Architecture of the network simulator NS-2.
The event schedulers and most of the network components are implemented in C++ for efficiency reasons. NS-2 makes use of discreet event schedulers 3 to implement the event schedulers’ components. Network components simulate packet handling delay and should also handle the event later at a scheduled time. Both components are available to the OTcl component through an OTcl linkage that is implemented using Tcl. Simulation scripts are written in the OTcl language, which is an object-oriented extended Tcl interpreter. Reading and configuring C++ files can be very cumbersome; therefore, NS-2 uses a script language on top of C++ in order to make the control and the change easier for network developers.
Network elements in NS-2 are classified in a hierarchical way. Figure 3 shows an overview of the OTcl class hierarchy. 24

Network components of the network simulator NS-2. 24
In this class hierarchy, the TclObject class is the superclass made up of all OTcl library objects (network components, event schedulers, timers, etc.). A subclass of TclObject, NsObject is the superclass of all basic network component objects that handle packets. Network objects, such as nodes and links, can then be composed of these basic network components. Moreover, NsObject is divided into two subclasses, Connector and Classifier. Connector is the superclass of all basic network objects that have only one output data path, whereas Classifier is the superclass of all switching objects that have possible multiple output data paths. Network objects can now be composed of all basic network component objects that are under the NsObject class.
NS-3 architecture
Similar to NS-2, NS-3 is also a discrete event network simulator. In recent years, it was decided to abandon backward compatibility with NS-2 and start from scratch using C++ or Python to allow users to take advantage of the full support of each language. In order to achieve scalability of a very large number of simulated network elements, the NS-3 architecture (Figure 4) supports distributed simulation.

Architecture of the network simulator NS-3.
The NS-3 architecture is similar to that of Linux computers, with internal and application interfaces, such as network-to-device drivers and sockets. NS-3 provides a set of network simulation models implemented as C++ objects and wrapped through Python. Users interact with NS-3 by writing a C++ or a Python application that initiates a set of simulation models to set up the simulation scenario of interest. NS-3 design simulation is based on use cases in order to allow the simulator to interact with the real world. A direct code execution environment has been developed in NS-3 to allow users to run many applications within the simulation, without requiring changes to the application code.
Rather than the OTcl used in NS-2, NS-3 is written in C++ with a Python scripting interface. Several new mechanisms that exist in C++ and were not available in C are used in NS-3. NS-3 protocols attempt to be closer to reality in comparison with NS-2 protocols. NS-3 is also written to support the open-source community and to allow the easy integration of new modules or components. Virtualization, where new hosts and components can be more flexibly added or removed, is another difference or enhancement in NS-3 in comparison to NS-2. Some NS-2 models written in C++ can be used in NS-3.
NS-3 is implemented in a modular architecture. Components can be easily reused in different scopes than their original ones. Figure 5 shows NS-3 core software components. Major components include core, simulator, and common and node modules or components. These four components support all other simulator components.

Core components of the network simulator NS-3. 36
Figure 5 also shows the network components supported by each core component. NS-3 modules are continuously updated, as NS-3 is a relatively new simulator. Figure 6 shows the major modules implemented in NS-3.

Modules of the network simulator NS-3.
Wireshark 37 is used to analyze network traffic and read trace files, as it provides a realistic environment and the source code is well organized and well documented. NS-3 supports the new paradigm for communication called the software-defined networking (SDN) to separate the control plane from the data path. This ability gives flexibility to the user, allowing them to develop their own algorithms to control data from different applications running on the network.
OMNeT++ architecture
OMNeT++ is a general discrete event. Similar to NS-3, it is implemented using component-based architecture to promote structured and reusable models. OMNeT++ distributions are available for both UNIX and Windows-based systems. Figure 7 shows the OMNeT++ internal architecture.

Internal architecture of the network simulator OMNeT++.
The Model Component Library consists of the code and compound modules. Modules are initiated, and the concrete simulation model is created by the class library (Sim) and simulation kernel. The model only interacts with SIM. ENVIR contains code that is common for all three user interface libraries (Envir, Cmdenv, and Tkenv). The simulation program may contain several linked-in model components, including networks, simple module types, compound module types, and channel types. Any network (but only one at a time) can be set up for simulation if all necessary components are linked in. Klein and Jarschel 38 presented a detailed implementation of the Openflow protocol in OMNeT++ to offer high flexibility in the routing of network flows.
Discussion
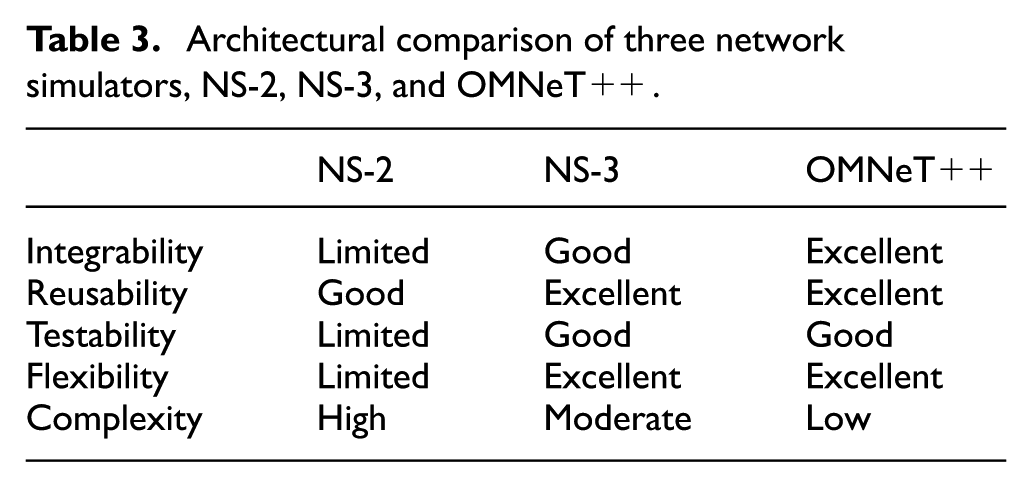
This discussion investigates architectural efficiency related to the following quality factors:
Reusability: the degree to which existing applications can be reused in new applications.
Integrability: the ability to make the separately developed components of the system work correctly together.
Testability: the ease with which software can be made to demonstrate its faults.
Flexibility: the ability for the solution to adapt to possible or future changes in its requirements.
Complexity: the amount of interaction between modules in a system.
Clearly, OMNeT++ uses a well-established modular architecture and different user interfaces (CMDENV, TKENV, and TVENV). Components are also physically separated: they are in separate source directories and form separate library files (
Architectural comparison of three network simulators, NS-2, NS-3, and OMNeT++.
Packet trace format
NS-2
NS-2 lacks ways to analyze its trace files, especially when the network’s size and the number of messages are very high. The trace files store information in an ASCII file that could be used to extract network performance characteristics, such as packet delay, network overhead, and packet loss. Figure 8 shows the trace file format in NS-2.

Trace file format for the network simulator NS-2.
The event parameter consists of four values: enqueue, dequeue, receive, and drop. CBR TCP defines the packet type exchanged in the network, and packet ID and sequence number are used to discard any duplicate packets in the network.
NS-3
Logging can be called in NS-3 for different purposes or levels: error, warning, debugs, information function, and logic. Users can select the level of logging through which they want to trace packets. The trace helper class can be called at the points of interests through the code. The Python scripting language is used to configure the execution process. NS-3 provides a native feature called FlowMonitor that allows the collection of interesting information about the packet, such as throughput, loss ratio, packet delay, bit rate, and round trip time.
In NS-3, Pcap files that are generated by the simulator can be inspected using one of two tools: Wireshark or Tcpdump. Wireshark can help users extract more information and has a robust graphical user interface (GUI) with which they can interact. Monitoring tools such as sFlow can be also integrated with NS-3 for traffic monitoring. Users can also define their own instrumentation methods.
Programming language
NS-2 is implemented using C++ with an OTcL interpreter as a front-end to control and manage simulation parameters. To reduce packet and event processing time, NS-2 combines two different major programming languages to separate the core system programming, such as a packet header, and routing algorithm from the simulation control. Tasks such as low-level event processing and routing protocols require high performance and are modified infrequently, which justifies using C++. Conversely, tasks such as network configuration and traffic generation require frequent change, and therefore there is a need to use a flexible scripting language, such as Tcl. When the Tcl program is compiled, a trace file and an optional nam file are created. The trace file plays the role of a log file to store the node movement and packets surfing in the network at each time instance, with details such as sending time, receiving time, and node ID.
In contrast to NS-2, the NS-3 simulator is developed and distributed completely in the C++ programming language to implement the whole system, and users can use Python for any other scripts. Users of NS-3 are free to write their simulation scripts as either C++ main() programs or Python programs. An implementation in NS-2 can therefore not be reused in NS-3 and must be carefully and manually transferred.
OMNeT++ uses the topology description language NED (NEtwork Description). The NED language has been designed to scale well to design topologies; however, recent growth in the amount and complexity of OMNeT++ simulation scenarios requires improvement in the NED language. C++ is integrated in the OMNeT++ Development Environment to write, run, and debug the code leaving the IDE.
Usability
Our objective in this section is to compare NS-2, NS-3, and OMNeT++ based on specific characteristics that aid in their effectiveness (ease of use), learnability, and usefulness.
Graphic visualization is an important tool in network simulators that allows developers to understand the large amount of data produced during network simulations and input validation. Such visualization affects the effectiveness factor. Visualization tools make it possible to display network topology, traffic generation, and node mobility.
NS-2 provides a visualization component called nam, 39 but it is not dedicated to mobile ad hoc networks. Thus, it cannot show wireless links, with the exception of node range (Figure 3). Nam uses the trace file to generate the network animation, but cannot be used for accurate simulation analysis. For statistics plotting, external tools such as Gnuplot or Xgraph can be used for result analysis. Kurkowski et al. 40 introduced an extended version of nam called the interactive NS-2 protocol and environment confirmation tool (iNSpect) to support the visualization and animation of NS-2-based wireless simulations.
Graphic display in NS-3 remains under extensive development. The NS-3 simulator is equipped with the Pyviz visualizer, which has been integrated since version 3.10. Pyviz can be used for debugging purposes, such as when packets are being dropped, and is mostly developed using the Python language. Pyviz is more complete and more powerful in comparison with nam. Another animator called NetAnim, 41 based on the multi-platform Qt4 GUI toolkit, provides an animation interface for use with stand-alone animators, using the custom trace files generated by the animation interface to graphically display the simulation.
OMNeT++ has an advanced GUI with intelligence support. The visualization module is decoupled from the simulator and can display many details of the scenario being used, such as objects (obstacles), movement trails, discovered network connectivity, discovered network routes, ongoing transmissions and receptions, radio signals, and statistics. In addition, it provides two visualization features, both 2D and 3D, depending on the user’s needs.
Table 4 presents a usability comparison of the NS-2, NS-3, and OMNeT++ network simulators. One advantage over NS-2 and NS-3 is that OMNeT++ can display statistics results and other variables on the fly.
Usability comparison of the network simulators NS-2, NS-3, and OMNeT++.
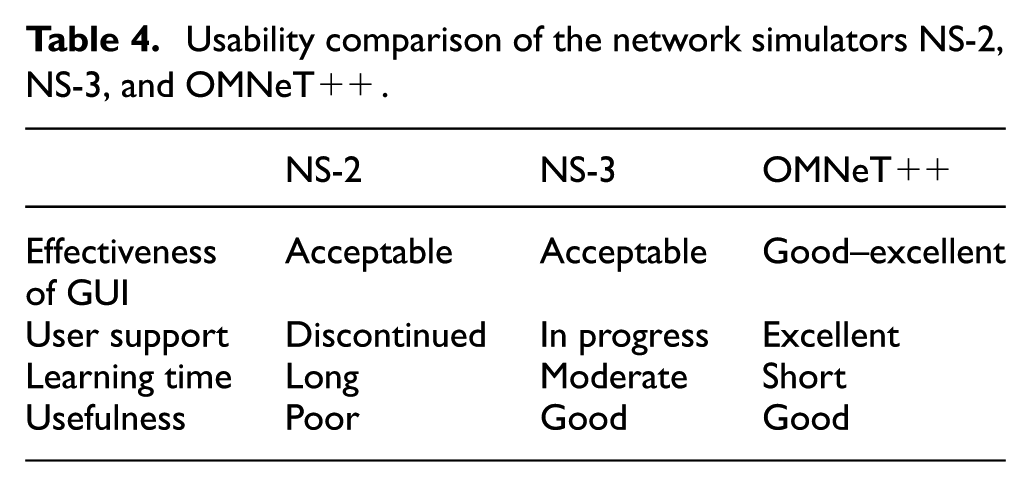
Additionally, OMNeT++ provides a graphical debugger to detect errors and offer easy model development for users, as well as offering an automatic animation to visualize and to draw interaction diagrams.
Simulation and performance analysis
To evaluate all three simulators, we ran similar scenarios (parameters shown in Table 5) in NS-2, NS-3, and OMNeT++.
Simulation setting parameters.
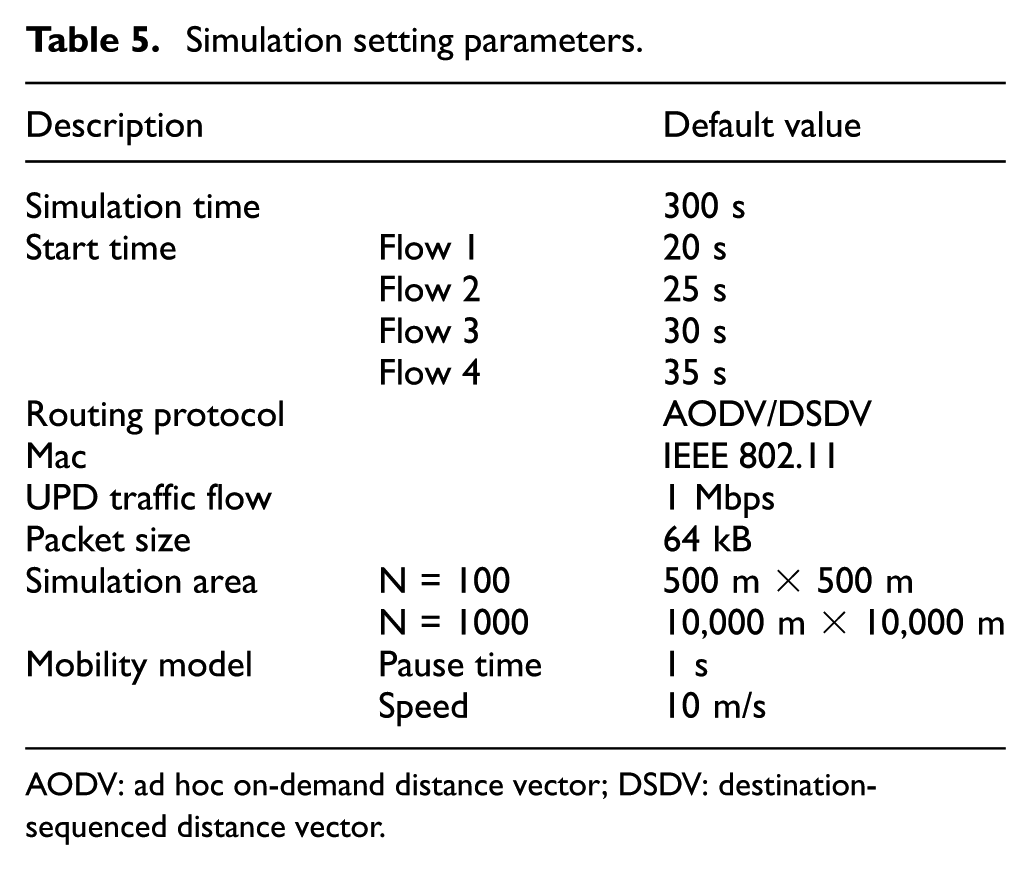
AODV: ad hoc on-demand distance vector; DSDV: destination-sequenced distance vector.
N nodes were randomly placed in a grid network topology. We used the <load_flatgrid> command to create the network topology. This command initializes the grid for the topography using the x-y co-ordinates for sizing the grid. A UDP traffic flow at high rate was used between nodes during the simulation. We studied four flows: Flows 1 and 2 were diagonals drawn between the opposite nodes (corners) of the grid, whereas Flows 3 and 4 represented the two lines of symmetry in the grid. As seen in Table 4, we allowed 20 s for the scenario to stabilize before starting the flow scenarios and then allowed an interval of 5 s between each flow. We tested the same scenario using different routing protocols (AODV and destination-sequenced distance vector (DSDV)) in network simulators NS-2, NS-3, and OMNeT++. AODV and DSDV were chosen from different categories—proactive and reactive, respectively.
In general, models in OMNet++ are less abstract than those of NS-2 and NS-3. NS-3 and OMNeT++ make it easier to run real code, as their packets contain strings of bytes and support the integration of real implementations’ code by providing standard application programming interface (API). In contrast, NS-2 models must be ported manually to the NS-3 and OMNet++ environments. NS-2 uses a queue technique for memory management, with fixed buffer size. Any modification in the size requires a programming effort to reflect the new size in all classes. No congestion avoidance techniques are implemented in NS-2; therefore, fairness cannot be guaranteed in NS-2. Compared to NS-2 and NS-3, OMNeT++ provides a clear separation of simulation kernel and models.
From a memory consummation view, C/C++ is a memory source leak in NS-2. The use of “bind()” consumes memory for each object that is created. This method can be very expensive if many identical objects are created. Protocols implemented using “dmalloc” will consume more memory than those using the standard “mallocs.” Conversely, in NS-3, memory management is based heavily on “smart pointers,” related to boost’s “intrusive_ptr.” Objects are stored in memory through the “Ptr” class. This class is an efficient way to allocate memory and is easier to use than the “dmalloc” used in NS-2, because all objects maintain an internal reference count to determine when an object can safely be deleted to free memory.
Experimental evaluation
The proposed evaluations are based on the following primary metrics:
The network throughput;
Network latency;
Packet delivery ratio;
CPU usage;
Simulation runtime.
We believe that such metrics are necessary for determining the effectiveness of any wireless network application. We therefore investigated the impact of simulation environments on these metrics. The network throughput, network latency, simulation runtime, and packet delivery ratio were retrieved directly from trace files, thanks to the Perl language. The packet delivery ratio was calculated as the total number of lost packets divided by the total number of transmitted packets. Network latency was the average delay for data transfer from a sender to a receiver, measured in seconds. The network throughput, measured in kbps, was calculated by dividing the amount of data sent by the time that passed between the opening of a TCP connection by the client and the closing of this connection.
Network throughput
In relation to network throughput, Figure 9 indicates that performance was negatively affected when implemented under DSDV.

Network throughput (kbps) using AODV and DSDV in the same environment with NS-2, NS-3, and OMNeT++.
Relevant papers that have conducted performance comparisons of NS-2 and NS-3 27 have shown that as network size increases, NS-3 steadily shows less computation time in comparison with NS-2. In addition, NS-3 has a significantly steady low computation time in comparison with NS-2. Although they are related, throughput and computation time measure two different performance aspects. Our results showed that in nearly all cases, throughput of NS-3 using AODV was better than that of NS-2.
The OMNeT++ network throughput was reduced when the number of nodes increased in all types of flow. Two ThruputMeter modules are used for this purpose between the IP and the TCP, one for each direction in which the packets travel. For all simulators, the average throughput increased with an increase in the number of nodes. The throughputs for NS-2 and NS-3 were large, due to the fact that delayed acknowledgments were used, because only half the number of ACK-packets was sent. In OMNeT++, many improvements have been made to target this issue. The case for DSDV seems different, as throughput fluctuates for this protocol for all simulators. AODV in most cases has better throughput than DSDV. The maximum network throughput can be computed

where RTT = 60 ms, window size = 64 kbps, and we assume a large network bandwidth to ignore the bottleneck. As shown in Figure 7, simulation results were actually less than approximately half of the theoretical result from equation (1). This clearly supports our finding that we “should rely only on network simulators to test our implemented routing protocols.” There is a need to add a conformance testing level to ensure that the specifications are implemented correctly and to achieve interoperability with network simulator modules.
Network delay
Network delay represents the average time needed to send a message from one node to another. Figure 8 shows the network delay produced by different flows using AODV and DSDV routing protocols under the same environment.
In Flow 1, the network delay increased when the network size increased (Figure 10). DSDV has a higher delay in general than does AODV. DSDV in NS-2 had the highest delay of the four flows in most cases, with the exception of when network size was large, when in most cases the two protocols in the two simulators produced largely comparable results.

Network delay (s) for AODV and DSDV under the same environment in NS-2, NS-3, and OMNeT++.
As shown in Figure 8, the delay was vastly improved in OMNeT++ by the implementation of the precision of delay emulation in the OMNeT++ framework. Additionally, the reason for this difference in performance between the three simulators is that in NS-2 and NS-3, many messages cannot be delivered to their destination, which incurs a longer delay. Figure 11 in the packet delivery ratio section (see below) confirms this conclusion.
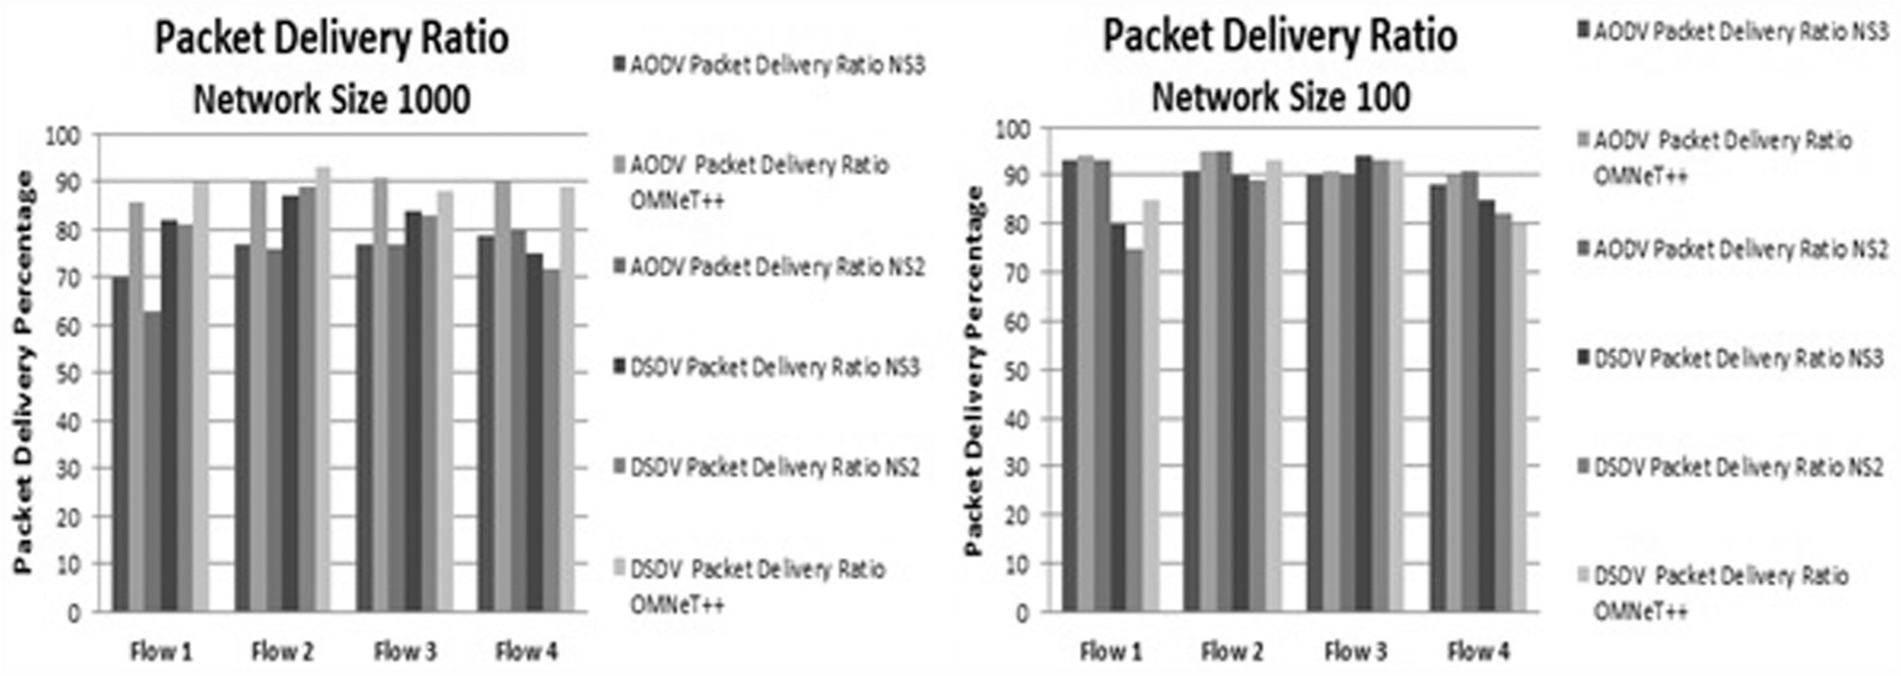
Packet delivery ratio (percentage) using AODV and DSDV under the same environment in NS-2, NS-3, and OMNeT++.
Packet delivery ratio
The packet delivery ratio represents the ratio of the total messages delivered over the total number of messages surfing in the network under IEEE 802.11 MAC. Figure 11 shows the variation in the packet delivery ratio against the network size using either AODV or DSDV routing protocol under the same simulation environment.
With large network size, NS-2 and NS-3 show different behaviors, with the exception of Flow 1 when applying different ad hoc routing protocols. In OMNeT++, packet loss was between 3% and 10%. When the number of nodes increased, the ratio decreased for all simulators. In NS-2, with the 1000 nodes scenario, occasionally the send buffer at the receiving node and packets from this queue were dropped. We must therefore use execution time and memory usage to test the performance of simulation software.
In agreement with results from other research experiments, AODV showed a better packet delivery ratio than did DSDV. In addition, network size did not significantly impact packet delivery ratio in any of the cases.
Simulation runtime
Simulation runtime was used to evaluate the performance of the three simulation tools. We ran the AODV scenario in all environments, with the simulation time set to 300 s. Figure 12 shows the measured simulation runtime in seconds with various network sizes for the NS-2, NS-3, and OMNeT++ simulators.

Simulation runtime versus network size when running the same model using three different network simulators, NS-2, NS-3, and OMNeT++.
Our results indicated that the computation time performance of OMNeT++ is considerably faster than that of NS-2 and NS-3. We attribute this winning margin to the architectural improvements and modular design of OMNeT++. The effect of the internal module “tcpApp” is remarkable. Similarly, NS-3 was faster than NS-2, likely due to the removal of the overhead associated with interfacing OTcl with C++, and the overhead associated with the OTcl interpreter. NS-2 requires more execution time than NS-3 and OMNeT++.
CPU usage
CPU utilization was measured while varying the number of nodes in the network model. Figure 13 shows the percentage of CPU usage for NS-2, NS-3, and OMNeT++. To avoid affecting the output measurements, all applications were closed in the experience environment while waiting for the result. For this experiment, we used AODV in the environment.

CPU usage when running the same model using three different network simulators, NS-2, NS-3, and OMNeT++.
When the network size included a small number (50–100) of nodes, the CPU usage was nearly the same (75%) for all simulators. Compared to NS-2 and NS-3, the OMNeT++ simulator had the lowest percentage, approximately 90%. This percentage is still high because entities in OMNeT++ are implemented with co-routines, which requires relatively large amounts of memory.
Additionally, every module requires its own CPU stack, leading to larger memory requirements for the simulation program. We observed irregular behavior in NS-2 when the number of nodes was 1000; NS-2 failed many times to run the scenario with that many nodes. Overall, with a large scenario, OMNeT++ used less memory than did NS-2 and NS-3.
Mutation-based conformance testing
Previous simulation results have reported variations in performance analysis and some unexpected failures. In many cases, the root cause for the faulty operation depends on the testing scenario and configuration parameters. Testing scenario can significantly influence the output results. The networking research community relies mainly on using simulation environments such as NS-2, NS-3, and OMNeT++ to verify and test their developed protocols. These techniques are guaranteed to achieve the expected results and performance of the given program, but may suffer from low quality in terms of identifying routing faults that might be present in the embedded protocol. Additionally, making decisions about the testing scenario, including parameter initiation such as network size, MAC, simulation area, and ifqlen, is a challenging task for researchers.
We therefore propose a mutation testing approach that involves developing a new trustworthy technique using mutation testing to be added on top of a network simulator, in order to adequately design testing scenarios and to correct implementation-based protocols. We exploit the synchronization, the exchange, and the manipulation of the routing information through mutation testing in an internal process simulation. Figure 14 shows the proposed approach.

Detailed procedure of the proposed mutation testing approach.
Our approach attempts to generate test cases with high quality (the generation of test cases based on the test requirements can be done manually or automatically) based on conformance testing to add confidence to the expected outputs. Each mutant is executed with test data, and we measure the mutation score of the test case. If the mutation score is low, the Mutation Analyzer generates a new test case for the same requirement that is likely to be high quality. Tests with high scores (threshold values) are saved and used later to validate the implemented network protocol. The whole process is iterated to generate other new test cases.
For example, we calculated the mutation testing average results in the aspect of test cases generated by changing one value of the default network parameters in selected test cases.
We managed to calculate mutation score for each test case by comparing the output results of Packet Delivery Ratio, Total Dropped Packets, and Average Delay with the obtained boundary values. The mutant considered killed for each test case, if at least two outputs out of three were not within the specified safe range, and the testing result will be success. Finally, the mutation score was calculated by determining the percentage of out-ranged values for each test case as shown in Figure 15.
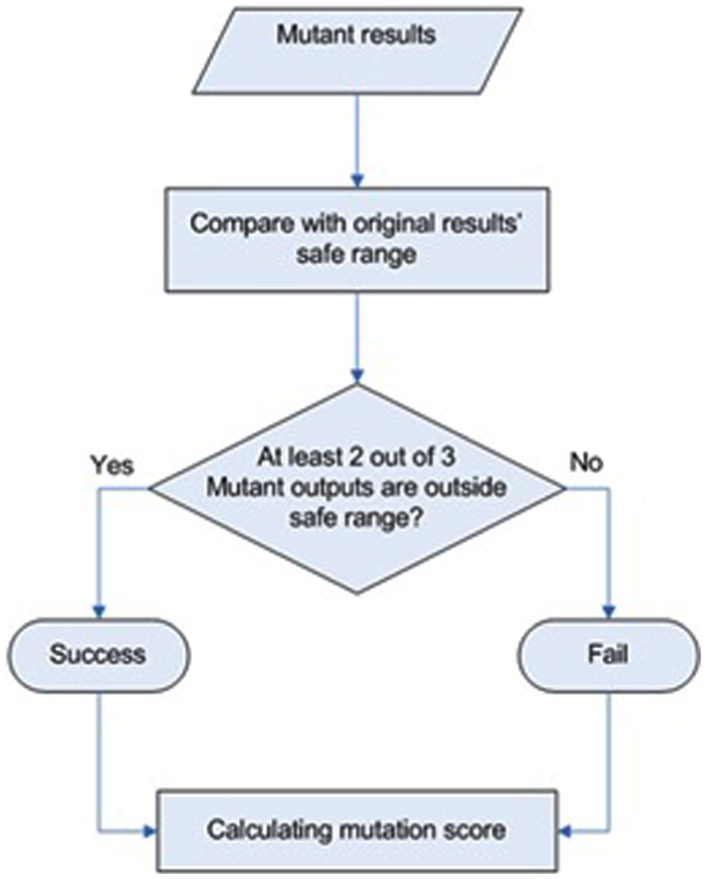
The process of determining the test result for each test case.
Our preliminary results are shown in Figure 16. Eight test cases were generated for AODV and DSDV by changing the network parameters values (nodes, ifqlen, x, and y) to see their influence on the test results. We tried to choose values with reasonable limits that can be handled by NS-2 without any error messages. Table 6 shows the details of selected test cases.

AODV DSDV average results (%) per test case (TC1–TC8).
List of test cases.
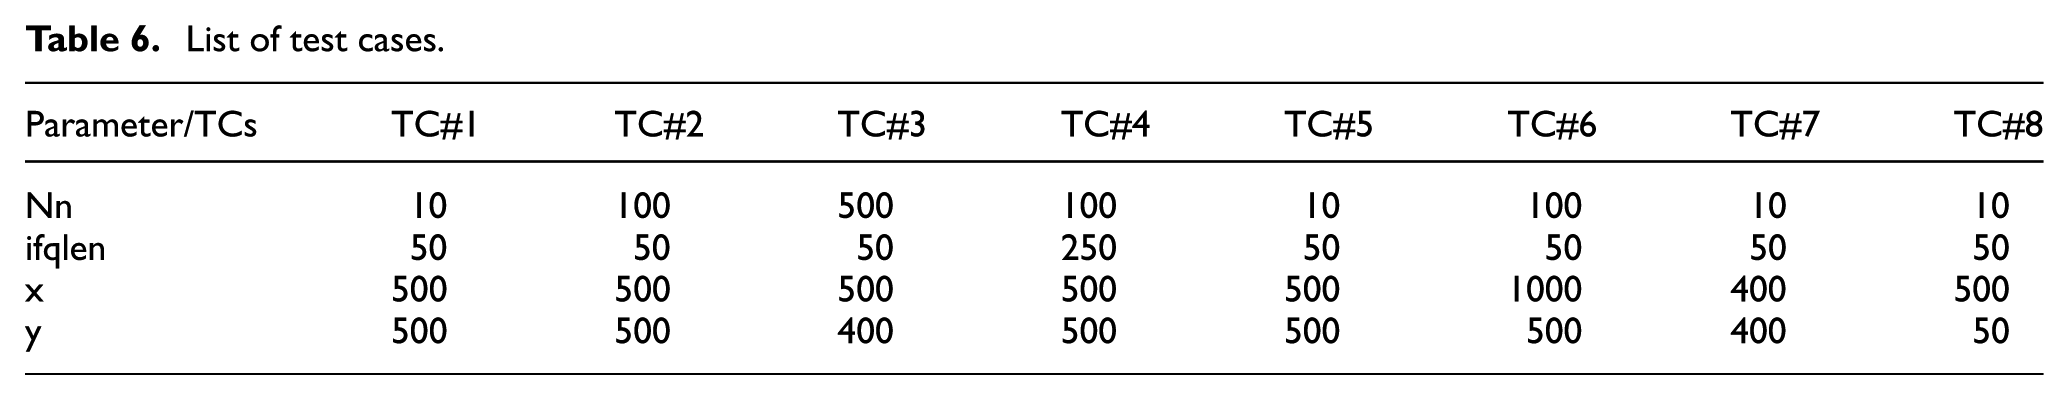
After comparison, we found that the average results of test cases 2 and 4 (86.11%) were relatively more different from each other than they were from the first test case result (45.83%), which means that the number of mobile nodes (from test case 2) and max packet in ifq (from test case 4) also have a valuable impact on the mutation testing results, leading to success, whereas using smaller values in the y dimension of topography (from test case 8) caused a negative impact on the mutation testing results (33%).
Test case 1 and test case 8 had very low scores, which means that using the set parameters to test AODV was not appropriate. In addition, by analyzing the collected test case data, we realized furthermore, with reference to the x and y parameters and the comparison of the test cases’ average result in which the simulation area was (500 × 500) (68.52%), and the test cases’ average result in which the simulation area was (1000 × 1000) (63.34%), it can be concluded that increasing the simulation area results in decreasing the mutation score in AODV protocol a neglect difference exists between the two areas in DSDV protocol (71.92% and 72.23%). This indicates that different sizes of the simulation area should always be used in such tests. For example, Maleh and Ezzati 42 used only a fixed simulation area (600 × 600), which should have been increased to produce more reliable results.
Conclusion
In this article, we presented a methodology to evaluate three network simulators: NS-2, NS-3, and OMNeT++. The methodology involved the following steps. First, we selected the protocols to run on the simulator. Second, we formalized a variety of network scenarios to cover all performance aspects, including size of the network, throughput, and delay. In the third step, we generated and collected executable results and then conducted a comparison approach and evaluated both simulators. To retrieve significant and valid results, it is important to put both simulators under the same conditions (running machine, environment, and scenarios). Finally, we proposed an initial idea for developing a mutation-based conformance testing approach to overcome potential weaknesses in the simulation environment and to generate smart testing scenarios.
As a recent evolution from NS-2, NS-3 possesses flexible capabilities that were not included in NS-2. It also includes modules to handle emerging network architectures, such as SDN or OpenFlow. OMNeT++ has also proposed an extension model to handle SDN.
In comparison with NS-2 and NS-3, OMNeT++ appears to give users a more powerful ability to communicate with and customize their experiments using two options: graphic visualization and text format. From the memory usage point of view, OMNeT++ is the most efficient simulation tool, followed by NS-3. We believe, however, that there are several functionality- and quality-based enhancements that should be included in future versions of NS-3 to guarantee a robust successor to NS-2. NS-3 should modify its closed nature to offer flexibility, allowing the developer to make their own protocols. OMNeT++ has a flexible model structure and leaves the creation of simulation models to independent research groups. A further testing phase is recommended to evaluate the credibility of a simulation model and the acceptability of simulation results. The simulation data results of this study prove that the mutation testing technique is effective for generating appropriate test scenario in order to increase sureness of the used network simulator.
Ongoing research work has been developed within the scope of mutation testing for network protocols to investigate the quality of test cases and to help developers design the appropriate test cases for their developed protocols in large-scale scenario more than (1000 nodes) using various network topologies.
Footnotes
Handling Editor: Donatella Darsena
Declaration of conflicting interests
The author(s) declared no potential conflicts of interest with respect to the research, authorship, and/or publication of this article.
Funding
The author(s) received no financial support for the research, authorship, and/or publication of this article.