
Abstract
In this article, a DC-biased optical–orthogonal frequency-division multiplexing visible light communication systems based on multi-point light-emitting diodes-array sources in the special-type vehicle is investigated. The novel lighting layout based on optical power evenly distribution principle is proposed to meet the desired lighting and communication requirement. Meanwhile, in order to resist the inter-symbol interference caused by multipath dispersion, DC-biased optical–orthogonal frequency-division multiplexing modulation strategy is suggested. The performance parameters of signal-to-noise ratio, the root-mean-square delay spread, and maximum transmission rate have been analyzed and calculated theoretically based on direct and multipath reflected channel models of visible light communication. The validity of the visible light communication system is demonstrated by simulation experiments results as follows: the received optical power range of −0.73 to 0.56 dBm in vehicle for approximately 2 m × 2 m × 1.5 m cube space, uniform illumination rate is 80.5%, average signal-to-noise ratio is 20.92 dB. Moreover, the maximum data rate can be improved from 107.8 to 477.4 Mb/s with the bit error rate at approximately 10−5, which meet the illumination and data transmission rate requirement for the special-type vehicle.
Keywords
Introduction
With the rapid development and improvements in light-emitting diode (LED) technologies, LEDs are expected to replace conventional incandescent and fluorescent lamps in the near future due to their lower cost, higher lifetime, and lower power consumption. Meanwhile, LEDs can be used to modulate light in high frequencies that the human eye cannot detect. This enables the use of LEDs for both illumination and communication. Comparing with traditional wireless radio frequency, visible light communication (VLC) technology has many advantages such as data transmission at ultra high speed, no radiation, confidential security, spectrum resources without certification, and ubiquitous lighting.1–3 This untapped potential of VLC has become one of the research hotspots in the world.
Fundamental analysis and research on improving the LED modulation bandwidth, high-speed optical communication technology, reducing the LED nonlinear application aspects have been proposed and notable achievements have been made.4–7 With regard to the multi-point lighting sources VLC system applied for the special-type vehicle, the limited space and the performance requirement of the evenly lighting and high reliability of communication increase the difficulty of lighting layout and the effect on inter-symbol interference (ISI). Therefore, optimizing multi-point lighting sources layout and resisting ISI are two challenges to the VLC system application in the special-type vehicle.
Illuminance and optical power for a fixed LED layout position was considered by Komine and Nakagawa 8 without considering channel delay in a 5 m × 5 m × 3 m room. Mean square deviation had been presented to optimize four LED layouts based on received optical power in 5 m × 5 m × 3 m room. 9 In Lee et al., 10 a new pulse response algorithm applying to high bandwidth has been put forward by researching on the multipath effect, and it was concluded that the algorithm could effectively calculate the reflected power. However, the effect on optical channel caused by the ISI produced by multipath propagation has not been considered.
Orthogonal frequency-division multiplexing (OFDM) is widely utilized in VLC system because of its high spectrum efficiency, resisting frequency-selective fading and narrowband interference. 11 To achieve higher data transmission and resist multipath interference, multi-level quadrature amplitude modulation (M-QAM) was considered in the VLC by incorporating OFDM. Two popular ways of carrying out OFDM for VLC are DC-biased optical–orthogonal frequency-division multiplexing (DCO-OFDM) and asymmetrically clipped optical–orthogonal frequency-division multiplexing (ACO-OFDM). 12 DCO-OFDM transforms arbitrary input signal to real values and adds a DC bias to convert the bipolar real values to strictly positive signal. ACO-OFDM-transmitted signal is made by clipping the original bipolar OFDM signal at zero and only the positive parts can be transmitted. Hence, in ACO-OFDM, only odd subcarriers carry data symbols, whereas in DCO-OFDM all subcarriers carry data symbols. 13
This article proposes a DCO-OFDM VLC system based on five-point LEDs-array sources in the special-type vehicle. The research contributes to the VLC system designing in vehicle.
The rest of the article is organized as follows. In section “Light layout optimization in vehicle,” we build the VLC channel model in the special vehicle’s narrow space, five source array layouts based on optical power compensation strategy is proposed, and it has been optimized through optical reflection transmission links with applying power equalization technology on the basis of Ding et al. 9 Performance parameters have been analyzed and calculated with applying the pulse response algorithm, including illumination, optical power, the impulse response function, signal-to-noise ratio (SNR), the root-mean-square (RMS) delay spread, and communication speed. The influence of ISI on SNR caused by the multipath propagation has been researched. To achieve high communication speed and lower ISI, a DCO-OFDM strategy has been put forward in section “DCO-OFDM modulation strategy.” Performance simulation analysis result of DCO-OFDM VLC system is presented in section “The communication system performance simulation.” The article concludes in section “Conclusion.”
Light layout optimization in vehicle
According to the task requirement of the special-type vehicle, the optical receiver needs to receive the data from the fixed transmitters accurately while it is moving in the vehicle. For this purpose, we optimize the LED arrays position based on optical power equalization.
Five LED layout designing
In this article, the simulated space model of vehicle is built at 2 m× 2 m× 1.5 m. A number of LXHL-MW1D-00J white LEDs produced by Philips Lumileds are treated as a transmitting source with the advantages of small size, high brightness, good communication performance, and so on. The total number of LEDs is 36.
Considering the optical power distribution uniformity, the researchers have been building a rectangular symmetrical LED layout structure.8,14 Noticed the limited vehicle space size in this article, we selected four-point rectangular symmetrical LED layout structure in Figure 1(a).

(a) Four-point rectangular symmetrical LED layout and (b) distribution of four LED layout illumination in LOS.
Figure 1(b) shows distribution of four LED layout illumination, we can conclude that the illumination of the center location in vehicle is much lower than the under locations of four LEDs-array. In order to get the ideal illumination uniformity, we put forward a five LED layout structure based on optical power equalization and the central optical power compensation principle.
The location of the five-point lighting sources array coordinates shown in Figure 2.

Structure of LED light layout.
The LED layouts of A, B, C, and D display symmetrical distribution, and the central LED layout E is fixed. Lighting source E is used to compensate the lower illumination of the center area. Through analysis and calculation, we determined the number of center LEDs-array is four and other four LEDs-array is eight. In this layout, the LED array is symmetrically distributed based on the diagonal symmetry principle in a square space plane, so the optimal position of LED layouts can be calculated easily only by determining the optimal x-coordinate values.
VLC optical power model
The received optical power of VLC system in vehicle mainly includes direct optical power and reflecting optical power produced by the inner wall of the vehicle. Usually, the multiple paths reflection have less effect on the VLC system, 8 the reflection optical power more than twice can be ignored here. The uniformity of optical power can be confirmed through calculating the mean square deviation of received optical power in received plane.
In order to calculate the reflected light power, an impulse response calculation method applying on VLC is used. The impulse response algorithm includes both the optical power spectral density of the point light source and the reflection coefficient of the reflection medium

where NLED is the number of all emitted light sources, and the power of each point light source is equal. The impulse response of the N light sources after k-times reflection is
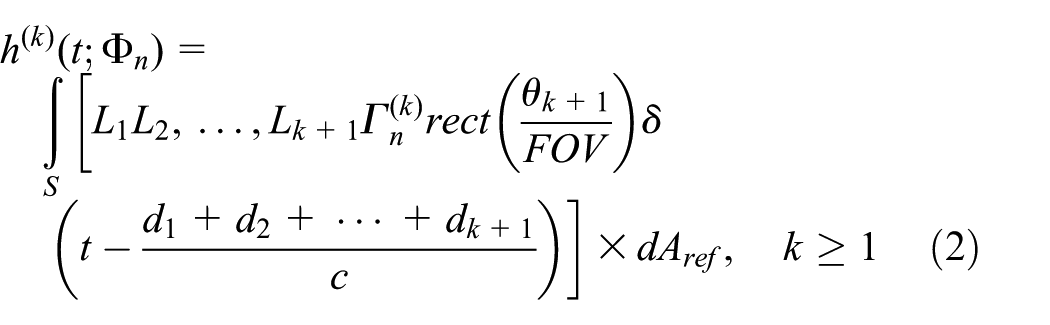
where L1, L2, and
Lk
+ 1 represent the path loss for each path. S represents all
reflection surfaces, and Aref is area differential unit of
each reflector.

The channel DC gain H(0) and the first reflection channel DC gain H(0) ref can be calculated with equations (2) and (3). In an optical link, the channel DC gain is given as 15

where A is the physical area of the detector in a
positive-intrinsic-negative diode (PIN), d is the distance between a
transmitter and a receiver,

where
There are two communication links in vehicle: the line of sight direct link and a first
reflection link. The relationship between the received luminous power

The received power at the point (x, y, h) on the Z = h plane is equal to the sum of the first reflected power and direct power as represented in equation (4)
LED layout location optimization
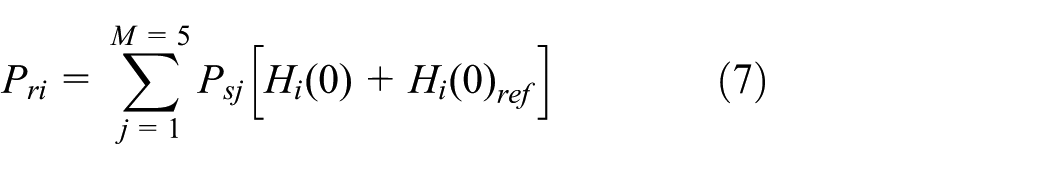
In order to obtain the uniformity of the optical power on the receiving plane, the mean square deviation of the received optical power was calculated. As shown in Figure 3, the received optical power Pri at each point on the Z = h plane is equal to the sum of the five arrays’ direct power to the point plus the reflected power of the inner wall of the vehicle.

(a) Direct channel model of VLC and (b) First reflection channel model of VLC.
As the position of LED layout moves, the mean square deviation of received optical power also changes. The position of LED layout is the optimal under the central compensation-type LED layout structure when the mean square deviation is minimum.
The receiving plane is divided into 2500 grids, and the average optical power received by each grid is

where Prtotal is the sum of the received optical power on the receiving plane. The mean square deviation of average power in each grid can be written as 9

The optimal position of the optimal LED arrays was selected by calculating the minimum standard deviation of the 2500 received optical power samples. Table 1 shows the corresponding simulation parameters.
Simulation parameters.

FOV: field of view; PIN: positive-intrinsic-negative.
The E LED array is fixed in the center, and its position is (1,1). When the LED arrays of A, B, C, and D moves to Array E, the standard deviation decreases first and then increases. That means, when the received optical power standard deviation is the smallest, the whole receiving plane is the most uniform optical power.
Figure 4 shows the optimal x-coordinate value of the array A is about 0.24 (m). It is not difficult to understand that y-coordinate value is also 0.24 (m). The optimal position of the other three LED arrays can be calculated as B (1.76,0.24), C (0.24,1.76), and D (1.76,1.76), respectively. At this time, the standard deviation of the received optical power is −0.982 dBm.
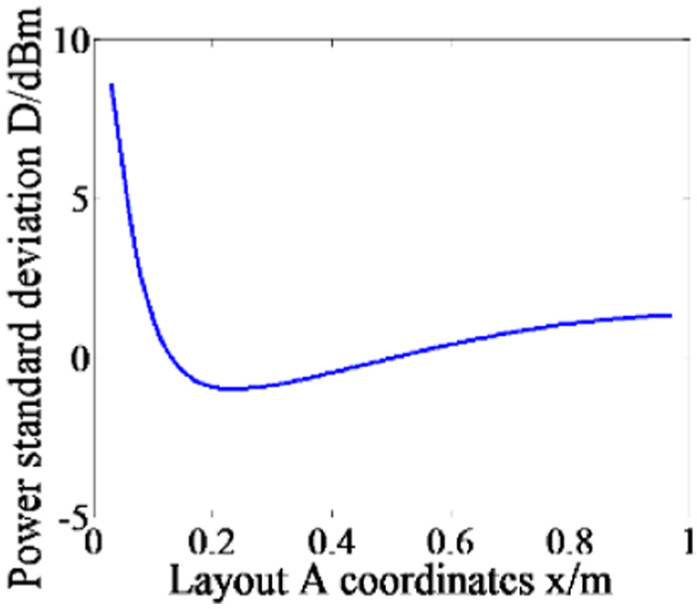
The relationship between standard deviation of received power and the x-coordinate of layout A.
The direct light power distribution at the optimal position is shown in Figure 5(a) with the maximum value of −0.1014 dBm, the minimum value of −1.5061 dBm, and the average value of −0.5541 dBm. Figure 5(b) shows the distribution of the optical power under the direct reflection plus the first reflection link with the maximum value of 0.5576 dBm, the minimum value of −0.7317 dBm, and the average value of 0.207 dBm. It is clear that the optical power distribution has increased when considering the reflection in vehicle. The overlap of the multi-power signals caused by the reflection will bring ISI to the communication system. As a result, the ISI caused by multipath propagation should be considered in actual VLC system.
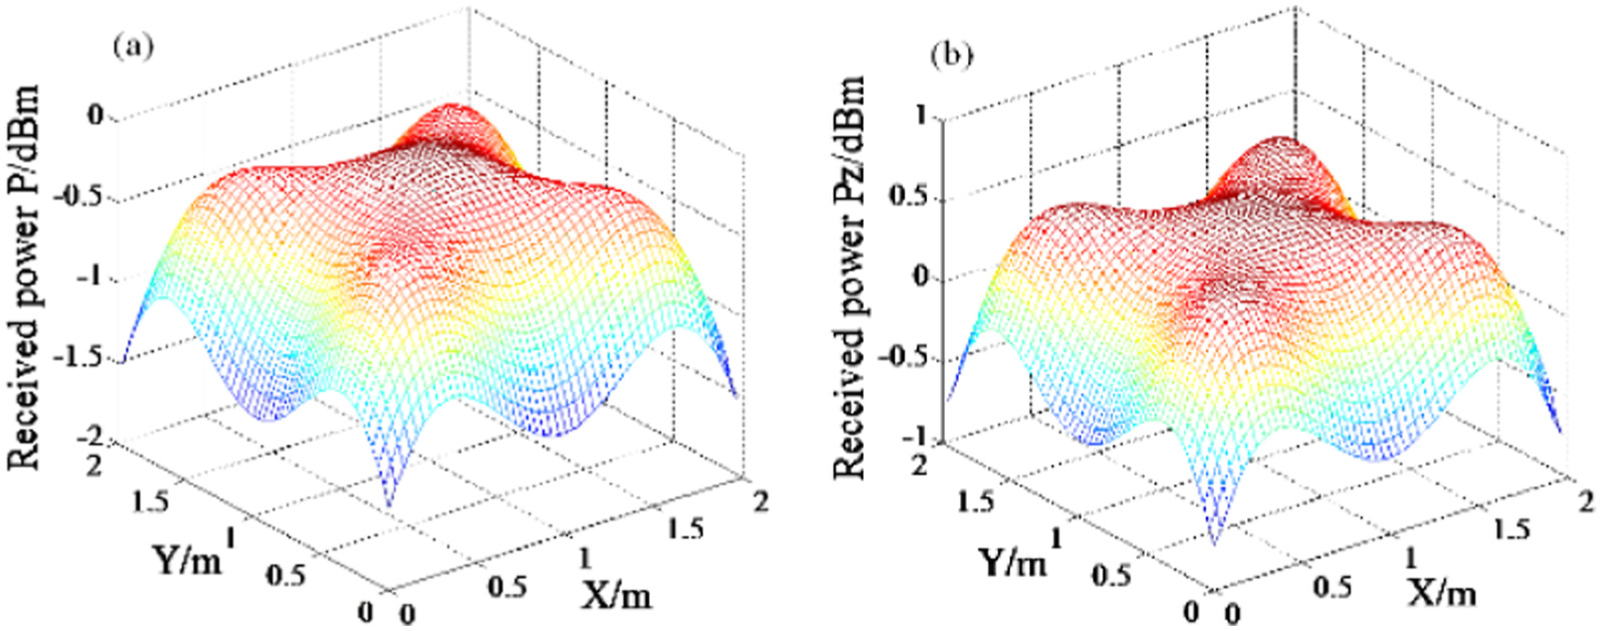
(a) Distribution of received optical power in LOS and (b) distribution of received optical power with first reflection.
Illumination verifying
The direct illumination on the plane Z = h (the received plane height of the receiver) is given as

After coordinate transformation, the illumination is expressed as

The illumination of the receiving plane receiving light from the inside vehicle with a first reflection is calculated as

The total illumination of the receiving plane is summarized as follows

The average lux of each point on the Z = h plane is

Figure 6(a) shows the received illumination under the optimal array position in the direct link, the maximum is 460.1289 lx, the minimum is 332.9745 lx, and the average is 414.1289 lx. Figure 6(b) shows that the maximum is 535.5639 lx, the minimum is 398.0082 lx, and the average is 494.0360 lx by considering a first reflection. The International Lighting Commission requires the electronics industry illumination about 300–700 lx, industrial operating area uniform illumination rate should be greater than 70%. The uniform illumination rate at the position of the optimal LED arrays is 80.5%, so the center compensation-type LED layout structure designed in this article can meet the intra-vehicle lighting demand.

(a) Distribution of received illumination in LOS and (b) distribution of received illumination with first reflection.
DCO-OFDM modulation strategy
In view of the multiple LED layouts position and ISI produced by multipath effect, a DCO-OFDM modulation has been applied to reduce the effect of ISI on intra-vehicle VLC system. Figure 7 describes the DCO-OFDM VLC modulation and demodulation process. 16 First of all, the binary data are modulated by the quadrature amplitude modulation (QAM). The plural of modulated symbol is transformed by the conjugate symmetry and then it gets the time-domain OFDM symbols after inverse fast Fourier transform (IFFT) transformation. After the transformation, the cyclic prefix is added in the time domain symbol, and after the DAC and DC bias operation, the symbols are sent to the LED light source. At the receiving terminal, after the first completed by PIN photoelectric conversion, the analog-to-digital converter (ADC) converts analog signals to digital signals, and finally after reverse digital signal processing, it gets demodulation QAM symbols.

The principle diagram of the DCO-OFDM modulation.
X 1 − Xn/2 − 1 defined as the symbols are mapped to M-QAM modulation and serial-to-parallel conversion. Before the signal is derived to the IFFT, X0 − Xn − 1 must have been conjugation changed to be a real output signal only. In order to ensure the time-domain symbols are all real numbers, X0 − Xn − 1 must satisfy the following formula
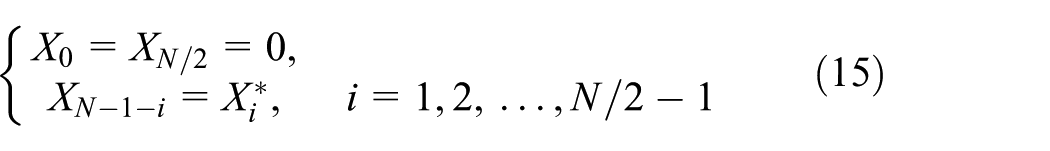
“*” presents the conjugate complex numbers. The

The continuous time OFDM symbols

where N is the length of IFFT,
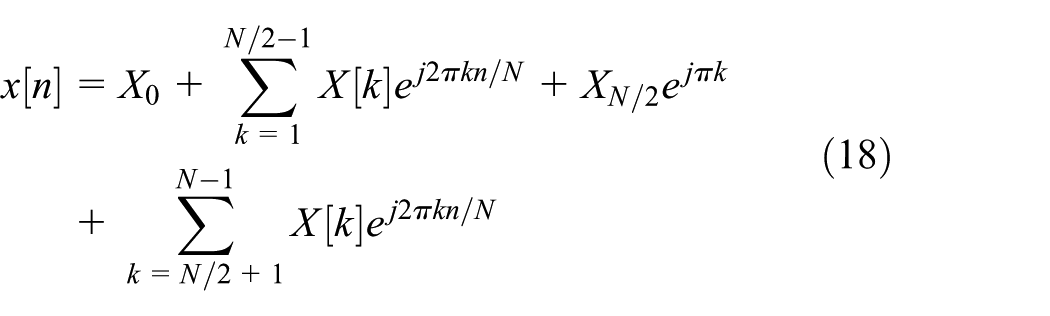

Every time-domain signal XN is corresponding each subcarrier in
DCO-OFDM system, and half of the subcarriers in vector X is its conjugate complex numbers,
so only N/2 subcarriers are used to transmitting data. The data rate

The DCO-OFDM system bandwidth utilization is expressed as

Notice that the bandwidth utilization of DCO-OFDM system is half smaller than the traditional OFDM system.
The traditional SNR cannot be used to measure the performance of the communication system because of nonlinear wave distortion in DCO-OFDM. So, we introduce a term called signal-to-noise plus distortion ratio (SNDR). 18 The SNDR of k subcarrier in DCO-OFDM system is given as

where
The bit error rate (BER) of the subcarrier in M-QAM modulation is given as

where BERk is the BER in the k subcarrier. BERk can be regarded as the BER of DCO-OFDM communication system because that each subcarrier can be treated as the same modulation, the same subcarrier power, and the same coefficient of channel in additive white Gaussian noise (AWGN) channel.
The communication system performance simulation
Based on the constructed DCO-OFDM channel model of VLC system, the parameters such as SNR, RMS delay spread, maximum transmission rate, and bit error ratio of communication system are simulated and analyzed under first reflection link, and the influence of the multi-light source arrays on system performance has been researched too.
SNR
The signal power received in the communication system S is givens as

where R is O/E conversion efficiency. In VLC system, the signal power is that when the time difference between the light energy of all links reaching the receiver and the first light energy reaching the receiver is less than or equal to half of the symbol period; otherwise, it is noise power caused by ISI. The optical power of the PR(Signal) signal is calculated as follows
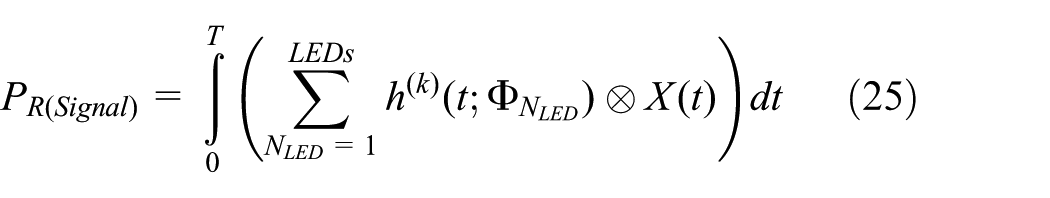
where NLED is the number of LED light sources, T is the symbol period, and k is the number of times reflection.
The total noise in VLC system includes shot noise

The noise power caused by ISI is calculated as

The expression of the shot noise is

where q is the charge, B is the data rate, Ibg is the dark current, I2 is the noise bandwidth factor, and γ is the photoelectric conversion coefficient. In this article, the optical receiver uses a PIN photodiode with ignoring the noise generated by the leakage current. The thermal noise can be written as

where k is the Boltzmann constant, Tk is the absolute temperature, η is the fixed capacitance per unit area of the photodetector, G is the open-loop voltage gain, the Γ is field channel noise factor, and gm is the field-effect transistor transconductance

The simulation parameters are shown in Table 2.
Simulation parameters.

FET: field effect transistor.
Figure 8 shows the SNR distribution in the line of sight (LOS) direct link and the primary reflection link under the influence of ISI.Figure 8(a) shows that the maximum SNR is 62.68 dB, the minimum is 11.88 dB, and mean is 57.34 dB. Figure 8(b) shows that the maximum SNR is 26.51 dB, the minimum is 10.38 dB, and mean is 20.92 dB. It can be seen that the mean value of SNR in the case of reflection of the inner wall of the vehicle is 63.5% lower than the LOS link, which indicates that the ISI caused by multipath propagation in the vehicle affects the system communication performance when the system code rate is 100 Mbps.
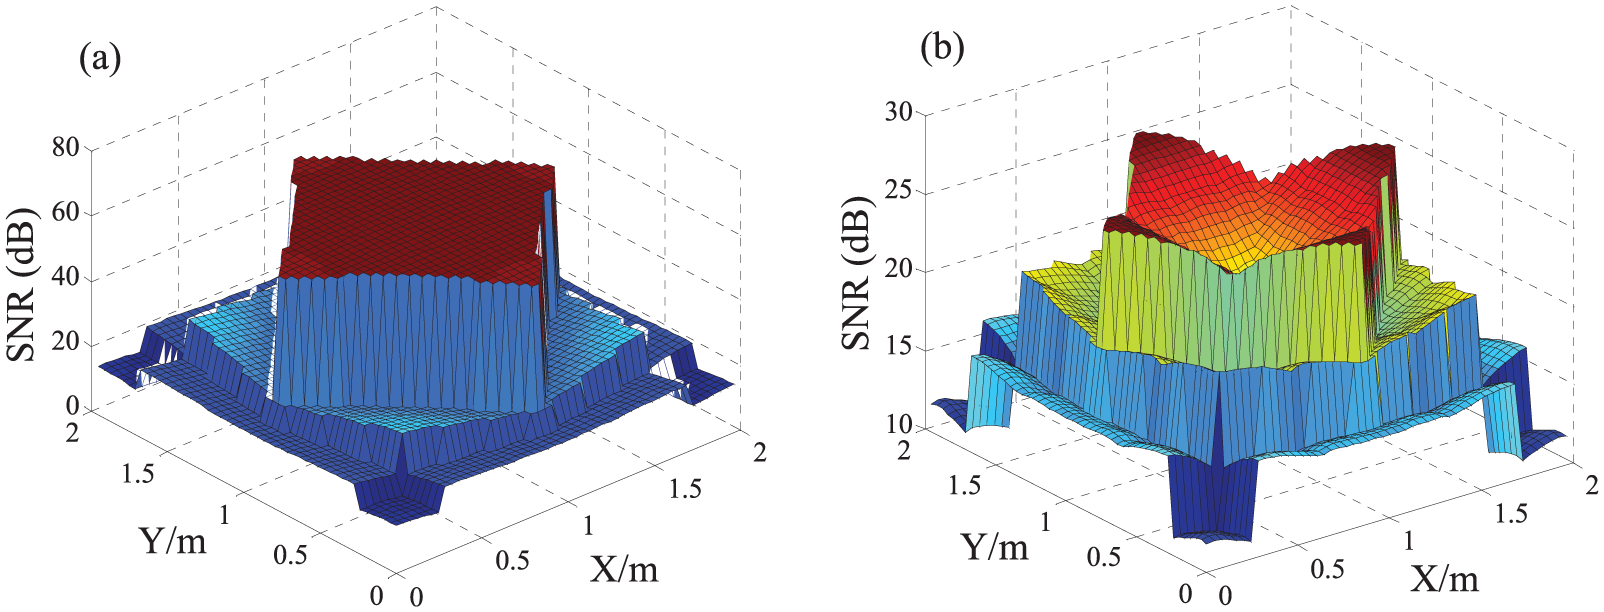
(a) Distribution of SNR with ISI (directed light) and (b) distribution of SNR with ISI (reflected light).
RMS delay spread and maximum data rate
The multipath dispersion of the optical communication channel and the multipath propagation can be measured by the RMS delay spread. When the transmitter, the receiver, and the reflection interface are fixed, the value of RMS delay spread and impulse response can be calculated. The mean delay spread is extended as follows

where PrT is the optical received power which is the sum of the optical power of all direct channels and all the reflected channels

where M and N represent the number of direct paths and the number of reflection paths from the transmitter to the specified receiver, respectively; Pd,i is the received optical power of the No. i direct path; and Pref,j is the received optical power of the No. j reflection path. RMS delay is expressed as

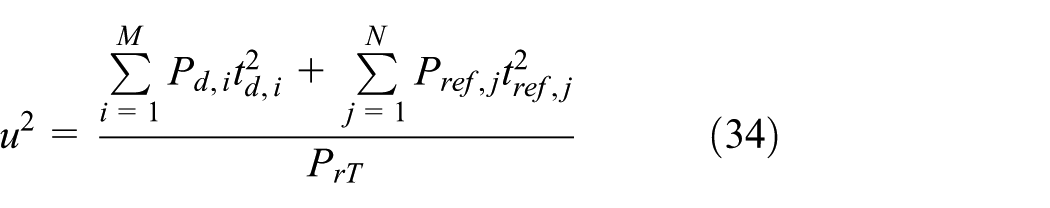
In the condition of without equalization, the maximum possible data rate Rb can be calculated by the following relationship with the DRMS 15 based on the on–off key (OOK) modulation

The RMS delay spread can accurately predict the loss of SNR caused by ISI. Figure 9 shows the DRMS distribution for each location in vehicle. The RMS delay spread range is 0.26–0.88 ns. The mean delay spread range is 3.69–4.69 ns, which shows that the value under the position of the LED array is larger than the other positions in vehicle.
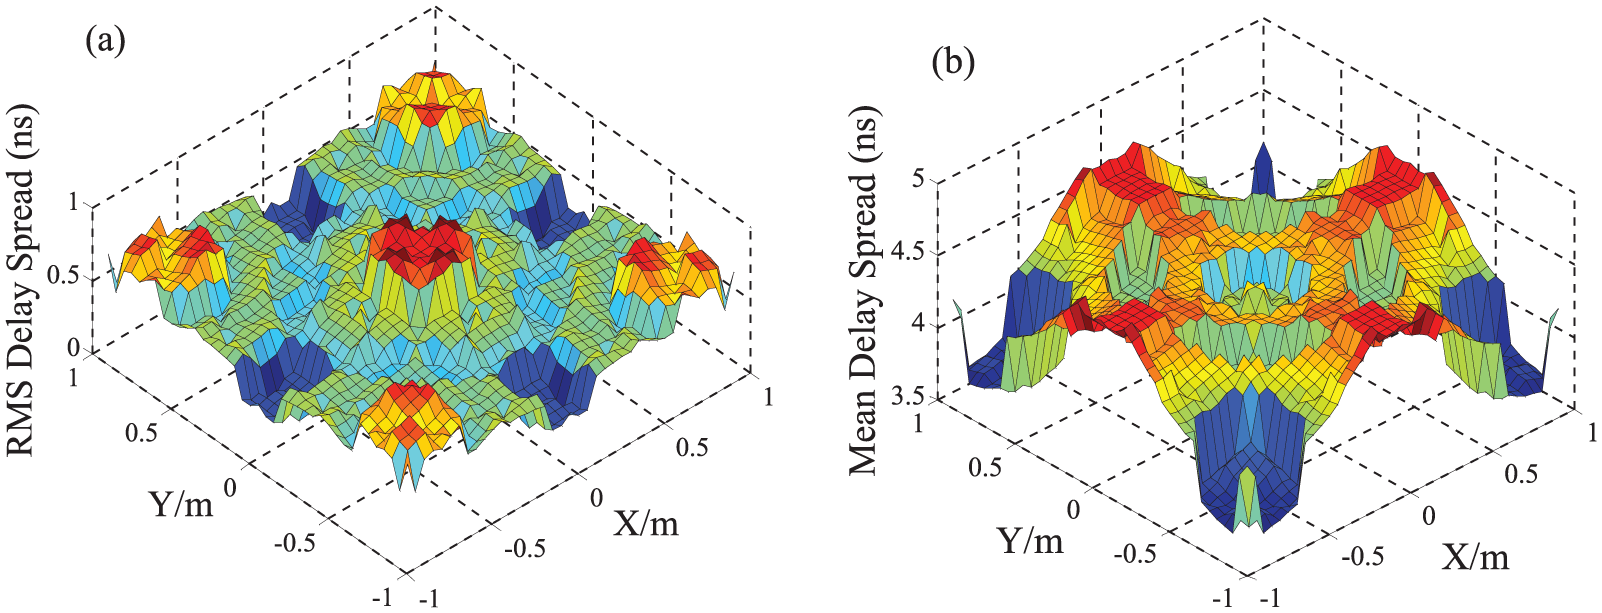
(a) Root mean square and (b) mean delay spread.
We can conclude that the delayed interference caused by the multipath propagation at the point under or near the LED array light sources is larger than other places. As shown in Figure 10, the maximum data transmission rate Rb is calculated from equation (35) in the range of 107.8–373.3 Mbps.
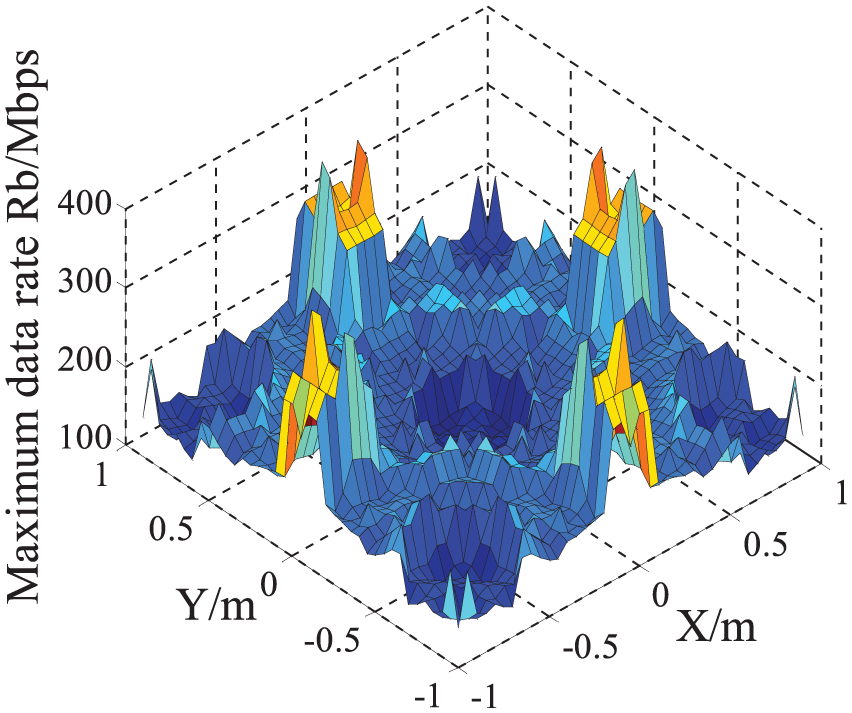
Maximum data rate distributions in OOK.
Bit error ratio and maximum data rate in DCO-OFDM
The system bandwidth B can be calculated as 100 MHz in (19). N-point fast Fourier transform (FFT) is 256, Ng = 10. The DCO-OFDM system data rate has been calculated with the modulation order M = 4, 16, 64, 256 based on M-QAM modulation in subcarriers, so we can get the data rate 95.49, 190.96, 381.92, and 477.4 Mbps, respectively. The communication data rate can be effectively improved with applying the subcarrier modulation of 64-QAM and 256-QAM.
The factors affecting the BER of DCO-OFDM VLC system is mainly channel noise and clipping noise. Figure 11 shows that the performance of BER in DCO-OFDM system for 64-QAM and 256-QAM. It is concluded that, the initial phase of the BER is higher with clipping noise produced by the bigger OFDM symbol amplitude for 64-QAM and 256-QAM, as the SNR increases to a certain value, the BER performance is improved, because that the increase in the SNR increases corresponding signal power and generates lower the BER. The performance of BER can reach about 10−5 that meets the demand of communication in vehicle when the SNR reaches a certain value with using QAM subcarrier modulation technology.

Performance of BER in DCO-OFDM system.
Conclusion
In this article, we first proposed an algorithm based on optical power equalization, which can optimize source layout structure with 80.5% of uniform illumination rate in the special-type vehicle. On this basis, we established VLC channel modeling. We also simulated the performance parameters of the SNR, BER, maximum data transfer rate, and other channel characterization. The simulation results show that the system ISI caused by multipath propagation will bring serious influence on the performance of communication, and DCO-OFDM modulation strategy can resist this influence powerfully. Our research can provide theoretical guidance for the design and development of the intra-vehicle VLC system. In addition, how to improve the optical power efficiency of DCO-OFDM VLC system is an important issue, and it will be our future work.
Footnotes
Academic Editor: Donatella Darsena
Declaration of conflicting interests
The author(s) declared no potential conflicts of interest with respect to the research, authorship, and/or publication of this article.
Funding
The author(s) disclosed receipt of the following financial support for the research, authorship, and/or publication of this article: This work was supported by National Natural Science Foundation of China (Grant No. 51507190).