
Abstract
Mobile edge computing supports the connected cars to ensure real-time, interactive, secured, and distributed services for customers. Connected car-sharing systems, as the promising appliance of connected cars, provide a convenient transportation mode for citizens’ intra-urban commutes. Determining the locations of depots is the primary job in connected car-sharing systems. Existing methods mainly use qualitative method and do not consider spatial–temporal dynamic travel demands. This article proposes a mobile edge computing–based connected car framework which uses normal taxis as connected cars to describe their Global Positioning System trajectory and perform the computing tasks in each mobile edge computing server independently. A spatial–temporal demand coverage approach is developed to optimize the location of depots. This article proposes a deep learning method to predict car-sharing demand constructed by a stacked auto-encoder model and a logistic regression layer. The stacked auto-encoder model is employed for learning the latent spatial and temporal correlation features of demand. A graph-based resource relocation model is proposed to minimize the cost of relocation considering spatio-temporal variation of car-sharing demand. Experiments performed on the large-scale real-world data sets illustrate that our proposed model has superior performance than existing methods.
Keywords
Introduction
Mobile edge computing (MEC), a new computing paradigm, provides a new information technology (IT) service environment and cloud computing capabilities at the edge of the mobile network. 1 MEC supports a growing variety of innovative service scenarios that can ensure enhanced personal experience and optimized network operation, such as augmented reality, intelligent video acceleration, connected cars, and Internet of Things.2,3 Especially, the rapid growth of connected cars is in immediate need to hire the communication of vehicles and roadside units which can increase convenience and efficiency of urban transportation systems. MEC can enable data and computing tasks to be housed as close to the vehicles as possible to decrease communication cost and latency. The communication can also ensure users to access some value-added services, for example, car finder, parking location, car-sharing, and entertainment services. Especially, in recent years, some on-demand easy-to-use and sharing-economy transportation models like Uber in the United States, Car2go in Germany, and Didi in China have started to shift consumer conceptualization of transportation services into a more flexible sense of multi-modal use. 4 Connected car sharing is the promising combination of connected car (or autonomous car) and sharing-economy transportation. Connected cars could have notable impacts on the car-sharing and taxi services in the future. Self-drive, self-park, and self-charge are the most distinctive features of connected car sharing which is more like today’s taxi service. 5 Especially, Level 4 automated vehicles operated without a human driver could provide more convenient point-to-point mobility in the future.
Connected car sharing is a service that permits customer to book a car for a short-term use and take possession of it at a depot near to one’s departure point and to return it at another close to its destination, billing by time and mileage, so as to reduce the need for a private vehicle. And in this article, we consider the station-based car sharing as studied object. It is defined as the organized collective use of passenger cars to reduce car ownership while ensuring a high level of mobility for urban residents. Connected car-sharing systems are widely deployed in many major cities providing a convenient transportation mode for people’s intra-urban commutes. They are attractive to customers who make only occasional use of a vehicle, as well as others who would like occasional access to a vehicle of a different type than they use day-to-day. Connected car sharing as an alternative public transportation has been observed to have a positive impact on urban mobility, mainly because each vehicle is used more efficiently.6,7
As we all know, determining the locations of depots in car-sharing systems is the most important task which relates to the success of project. However, traditional methods to determine the depots are most arbitrary and lack of science and rationality. To make sure how many depots to deploy and how to distribute them in the studied area, we should analyze regional demand of activities which may lead to the generation of travel. Travel demand modeling should be performed to assist decision makers in making informed planning decisions of car sharing. Therefore, the travel demand of car sharing should be estimated to determine the distribution of car-sharing depots. And it is generally known that supply–demand relationship is perhaps one of the basic foundations in the car-sharing market. The equilibrium between supply and demand is satisfied if the system works tolerably well. Estimating the car-sharing demand is difficult due to the spatial and temporal variations in the internet of vehicles environmental. And in our work, we take Points of Interest (PoIs) and taxi trajectories in a metropolis into account to predict the demand. First, the PoIs usually represent some interesting or useful places, such as corporate business, shopping mall, educational places, and resident communities. The above areas have large potential to be the car-sharing depots which generate relatively huge car-sharing demand. Second, travel demand can be represented by trip generation and attraction in the studied region. The goal of trip generation is to estimate the number of trips, while trip attraction predicts the number of trips attracted to the given region. Meanwhile, the trip generation and attraction can be extracted from taxi trajectories; the origin and destination points (O/Ds) located in studied region represent the trip generation and attraction.
The proposed solution is not only applicable in the construction of car-sharing systems but also can be adopted to other urban planning programs, for example, charging stations for electric vehicles, public transportation stations, and transit stations for city express. This article develops a spatial–temporal demand prediction approach to facilitate car-sharing station siting. To this end, actual spatial–temporal car-sharing demands in the city of Beijing have been extracted from large volume of raw taxi Global Positioning System (GPS) trajectory data. We evaluated our model using three data sources consisting of taxi GPS trajectories generated by about 12,000 taxis, PoIs, and road networks in Beijing. And the results show that our model has advantage over three baseline algorithms.
The remainder of the article is organized as follows. In section “Related works,” the related works of MEC and connected car sharing are introduced briefly. In section “Overview,” we visualize proposed MEC-based framework of connected cars and present the architecture of depot determination. Section “Methodology” discusses the detailed model to determine the distribution of depots. The car-sharing demand prediction model is proposed based on a deep learning algorithm with stacked auto-encoders (SAEs). A graph-based vehicle relocation model is proposed in section “Resource relocation among depots.” Then, experimental results are evaluated and analyzed in section “Experiment and results.” Finally, in section “Conclusion,” we draw conclusions and discuss future work.
Related works
MEC and connected cars
MEC is a new computing technology which provides IT and cloud computing capabilities in close proximity to mobile subscribers aiming to reduce latency and ensure highly efficient network operation and service delivery and to improve mobile users’ quality of experience. MEC can be regarded as a cloud server running at the edge of the mobile network and performing specific computing tasks independently and discretely. There are five typical characteristics of MEC, namely, on-premises, proximity, lower latency, location awareness, and network context information. Especially, in the era of big data, large-scale real-time network data are gathered and subscribed to corresponding MEC server by mobile subscribers. And gathered information can be leveraged as part of data analytics to serve customer better. Hu et al. 2 introduce some service scenarios, requirements, architecture, and application programming interface (API) specifications.
Connected cars, as the typical appliance of MEC, have access to the Internet and a variety of sensors which can sense the physical environment around them and interact with other vehicles or entities (i.e. traffic lights and pedestrian). Vehicles are the inherent MEC servers as they are equipped with high performance data process, storage, and wireless communication devices. Vehicular cloud computing brings the MEC to vehicular networks and thus changes the way of service provisioning. Vehicles produce and consume a great amount of contents having the property of local relevance (time, space, and consumer). Therefore, MEC has notable significance on the computing chain (content generation–process–consumption). Lee et al. 8 discuss architecture and operations of vehicular cloud computing and information-centric networking. Whaiduzzaman et al. 9 proposed a taxonomy for vehicular cloud in which special attention has been devoted to the extensive applications and design an architecture for vehicular cloud computing.
Car-sharing depot determination
In any car-sharing system, one of the keys to success is the location and distribution of rental stations. However, most research works give only general depot recommendations regarding the depot implementation and project budget without considering the real demands. The location and distribution of rental stations can be seemed as facility location problems to serve geographically distributed demands. 10 Existing methods typically consist of two main components: a demand representation and a location distribution model. Traditional demand is generated by a synthetic method based on population or travel surveys. Demand is defined as being covered if it is within a certain travel distance/time to a facility. A location model is designed to select the best locations that achieve maximum system utility, minimum cost, or other objectives.
For the depot location problem of car-sharing systems, there exist many research works. Brandstatter et al. 11 summarized the main contributions to the definitions and solutions of optimization problems in car-sharing systems. Depot location in one-way car-sharing systems is optimized in de Almeida Correia and Antunes. 12 Vehicle supply–demand imbalance model is addressed under three different trip selection schemes. The article aims to maximize the profits rather than quality of service which ignores the real car-sharing demand. Jorge et al. 13 considered real demand variability and proposed a vehicle relocation policy between stations. The results show that the impacts of demand pattern on specific relocation policy vary with different scenarios. Kumar and Bierlaire 14 analyzed the performance of the car-sharing service across all stations to estimate the key drivers of demand and used these drivers to identify future station locations. Different from car-sharing systems, a bike-sharing system is developed for Lisbon, and an mixed-integer linear program (MILP) model is designed to optimize the location of shared biking stations and the fleet dimension. 15 Karamanis et al. 16 focused on fleet management of autonomous vehicles. And a mixed-integer programming algorithm is explored to solve strategic decisions such as depot location and number and fleet size. Li et al. 17 employed a novel method combining the analytic hierarchy process and geographic information system with big data to determine the optimal locations of future stations. The decision criteria are potential users, potential travel demand, potential travel purposes, and distance from existing stations. Similarly, Zhu et al. 18 proposed a deep learning–based optimization model to determine the locations of depot considering the real car-sharing demand. However, the road network and existed roadside public parking lots which cause the huge construction costs are not considered. While previous research works always proposed a mathematical model for selecting the given depots’ location as an approach, it does not consider the real car-sharing demand. As we know, the car-sharing demand has significant influence on the location of depots. To determine the locations of candidate depots, some further detailed discussions about car-sharing demand are extremely necessary.
Resource relocation in car sharing
Car-sharing systems face a problem of uneven distribution of vehicles at different stations. Specifically, some popular stations with large demand may not have enough vehicles, while unpopular stations which are popular return points may end up with too many vehicles. Therefore, vehicle relocation among different depots is necessary. The dynamic vehicle allocation problem is addressed as a decision-making problem for vehicle fleet management in both time and space context to maximize profits for the car-sharing service providers.
Barth et al. 19 introduced two user-based relocation mechanisms called trip joining and trip splitting. This approach urges users to share the same vehicle if there are more than one passenger having the same destination station and vice versa. Bruglieri et al. 20 proposed an approach for electric vehicle relocation problem through moving vehicles by personnel of the service operator to keep the system balance. Alvina et al. 21 presented a novel three-phase optimization-trend-simulation decision support system to determine a set of near-optimal manpower and operating parameters for the vehicle relocation problem. Fan et al. 22 stated the major difficulty of stochastic dynamic vehicle allocation problem lies in uncertain demand and the increasing level of future uncertainty and proposed a Monte Carlo sampling–based stochastic optimization method to solve the car-sharing dynamic vehicle allocation problem. However, the above papers have a strong assumption that the car-sharing fleet manager knows all the demands at the beginning of each day, which is impossible in the real operation process. Wang et al. 23 proposed a novel method to forecast and relocate vehicle resources for car-sharing services, microscopic traffic simulation, focus forecasting, and inventory replenishing. To predict the car-sharing demand, a focus forecasting model based on an aggregate approach is proposed. Weikl and Bogenberger 24 described a new integrated two-step algorithm for optimal positioning and strategy selection which consists of an offline demand clustering that allows for strategy selection and online module measures the differences between optimal vehicle positioning and current positioning to select the best relocation strategy.
Overview
Figure 1 visualizes the MEC architecture of connected cars. As shown, several base stations and roadside units are equipped with a shared MEC server. Using MEC servers, any geographically dependent vehicle can directly subscribe contents (i.e. GPS trajectory) to the servers but not to the centric cloud. MEC server stores and processes the content and broadcasts to all relevant subscribers within the local geographical area.

MEC architecture of connected cars.
Figure 2 presents the framework of the proposed solution to determine depots of connected car-sharing systems. And it consists of four major layers: data storage, data preprocess, candidate depot determination, and web service provision. The following section will discuss the above layers in detail.

Framework of the proposed solution to determine depots.
Data storage and preprocess
As is illustrated in the top row of Figure 2, this step consists of storing the other original data in the hadoop distributed file system which will be used in the future process. We use Aliyun ECS PaaS as the MEC server. To the original data, the system needs 5GB resources to store static data (PoIs, road networks, and public roadside parking lots data) and historical trajectory data in local servers considering the size of data. Data preprocess consists of data cleaning, data transfer, and reloading. Data cleaning deals with detecting and removing errors and inconsistencies from data in order to improve the quality of data. In this article, the data preprocess employs usual techniques so that details will not be discussed.
Depot determination
The goal of this article is to determine the location of depots in the car-sharing systems. First, we extract the trip O/D points, trip distance, and duration from raw GPS trajectories. And then original PoIs are viewed as the candidate depots, and the service area of Points of Interest (SAPs) can be obtained. The O/D pairs are used to predict car-sharing demand in the service area. Candidate depots which contain less demand should be filtered and remainders are merged to ensure there do not exist close PoIs. Note that all the computing services are executed in the corresponding MEC server.
Web services
At the bottom of Figure 2, the web services layer aims to visualize the location of depots in the car-sharing system and provides decision information for government or operational company. And the visualization gives a more in-depth visual analysis. Finally, an accurate evaluation approach of quality of cloud service in service-oriented cloud computing is used to evaluate our web service. 25
Methodology
As is presented in Figure 2, the three red-dotted functional blocks in depot determination layer are information preprocess, the demand prediction of SAPs, and the location determination of depots, respectively. In the following sections, we discuss our method to determine the distribution of car-sharing depots in detail.
Information preprocessing
To determine the distribution of car-sharing depots, travel demand should be extracted from raw GPS trajectories. We just need O/Ds of passengers’ trips which can be represented by pick-up and drop-off points and extracted from raw taxi GPS trajectories.
Definition 1. GPS trajectory
A taxi’s GPS trajectory is a sequence of spatio-temporal points recording the path and operation status of the moving object, that is,
Therefore, we can extract the pick-up and drop-off points based on trigger event parameter. The filtered trip can be represented by
Specially, some trips with close distance or short duration are not considered because there is no need to rental a car. So, we filter the irregular trips based on the spatial and temporal characteristics. Assume that if the rental mileage is longer than
Candidate depot selection
In this step, we should determine the original candidate depots and the service area. Free-floating car-sharing system is the newest, and most mainstreams which allow one-way rentals and vehicles can be picked up from one depot and returned to another one. The depots are usually located at some major traffic hubs, commercial and trade centers, car service centers, amusement places, and other major sites which generate and attract more travel demand. So, we use the PoIs as the potential original candidate depots. For the convenience of users, depots are leased as close as possible to users.
Definition 2. PoI
A PoI is a location for which information is available and useful. A PoI can be represented by a set of coordinates, a name, a unique identifier, and more detailed information (e.g.“Gengenxiang Restaurant,”“25 Chaoyang Road,”“010-51884127,” 116.556101, 39.963646).
Then, the service area should be obtained to predict travel demand. Almost 46% of trips occur in a depot or within half a mile from depots.
26
The majority of rentals do end in the vicinity of depots because depots are distributed in high-density travel demand than the actual dedicated parking spaces. Therefore, the service radius is defined as half a mile to cover nearly half travel demand. We define

where
Predicting the demand of SAPs
Analytics of spatio-temporal characteristics
We propose the model based on the framework of co-training shown in Figure 3, where a circle denotes a region to be inferred and a plane means the states of these regions at the timestamp. We can understand the philosophy of the model from the perspective spatial characteristics and temporal characteristics simultaneously. First, car-sharing demand of a region can be reflected by some spatial-related regions. We assume that a region has similar car-sharing demand with spatial-related regions. Second, car-sharing demand also has temporal dependency on its current and previous states. The process can be described as follows: we want to predict car-sharing demand of region

Prediction model of demand based on spatial and temporal characteristics.
Auto-encoder
Here, we propose SAE-based demand prediction method which learns spatial and temporal features of car-sharing demand. The SAE model uses auto-encoders as building block to train a deep network.27,28
An auto-encoder is an NN consisting of multiple layers of sparse auto-encoders in which the outputs of each layer are fed to the inputs of the next layer. Feature learning can be done in an unsupervised manner by minimizing the reconstruction at the decoding layer so that the correlation between the input features is learned in an expectation maximization-like fashion in the mapping weight vectors. 29 Figure 4 shows the model of auto-encoder. The detail process is described as follows.

Auto-encoder model.
Encoder
Given a set of training samples
Decoder
The hidden representation


where
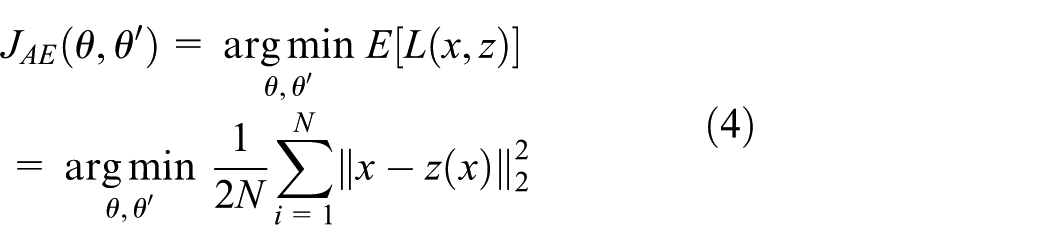
Features in the data are learned by minimizing the reconstruction error

where
where
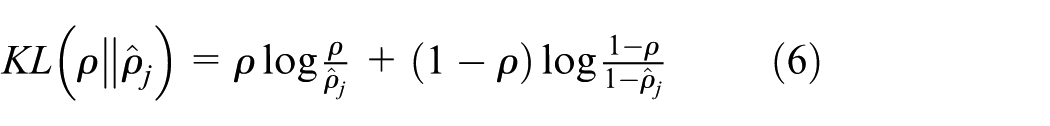
The sparsity of features in data constraints results that nonlinear auto-encoders have more hidden units than the input, which limits the activation of the hidden units. When the sparsity constraint is added to the standard auto-encoder, the auto-encoder becomes a sparse auto-encoder and the objective of the sparse auto-encoder model is defined as follows

where
Kullback–Leibler divergence can be used to measure the difference between two probability distributions, and
The model is trained by optimizing the objective function with respect to
Application of SAE model to spatio-temporal prediction
In our work, we propose a deep architecture created by multiple layers of auto-encoders. The deep architecture could learn spatial and temporal characteristics to represent relations between inputs and final outputs. The SAE model uses the output of each auto-encoder as the input of the next layer. As is illustrated in Figure 5, there are

Deep architecture for car-sharing demand prediction. SAE at the bottom for unsupervised feature learning, and a sigmoid regression layer at the top for supervised prediction.
The bottom SAE model is viewed as an unsupervised feature learning method to learn the spatial and temporal features of car-sharing demand. As is illustrated in the above section, car-sharing demand follows a spatial and temporal pattern. To determine the parameters of our proposed prediction model, the time interval
Definition 3. Semantic region
A city region is an area broadly divided by physical geography, human geography, and environmental geography. In a city, a region has a set of PoI semantic labels
For the spatial characteristics, we propose the concept of semantic similarity to find the similar regions. The semantic similar regions have similar functions and similar car-sharing demand. The semantic similar regions generate and attract similar travel demand pattern. We choose the cosine similarity to calculate semantic similarity to obtain semantic similar regions of region

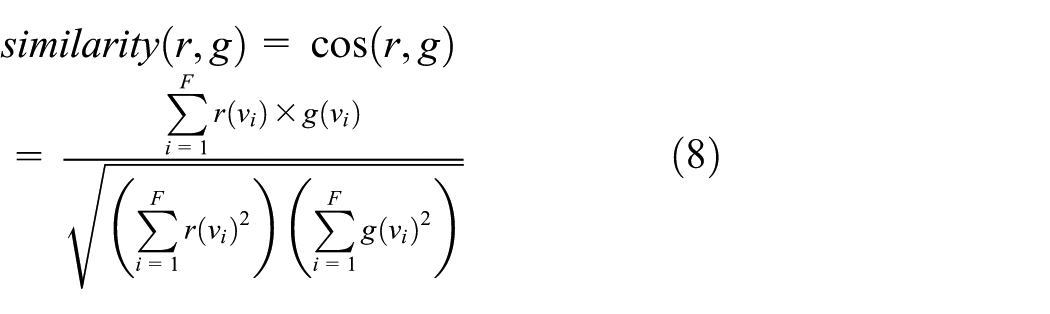
where
Determining the location of depots
The car-sharing demand distribution of each candidate depots is presented in Figure 6. There are nearly more than 500 depots that generate 600+ customers, however most depots get only one single trip. The distribution is so extreme that if the full range was shown in the figure, the curve would be a perfect L shape.

Distribution of car-sharing demand.
The distribution of car-sharing demand meets the power law which has a significant characteristic, namely, Pareto’s principle. According to statistical results, 20% of depots attract 80% of car-sharing demands (the red line and the gray areas). Therefore, remainder depots should be filtered because they have very little demand. Then, the 20% of depots will perform merger operation based on the distance among the depots. If two depots are so close that one locates in the other’s service area, the two depots will be merged based on the demand weight. The two candidate depots are presented by

The merging operation will be performed cyclically until there are no depots whose distance of each other is less than the service radius.
Adapting the locations of depots
For the convenience of users and the actual situation, the depots should be deployed to the side of the road. The adaption work should be executed based on the road network to construction the roadside rental depots.
The adaption work consists of two steps, which are projection of the depots on the road segments and selection of projected depots. Suppose there are four road segments around the candidate depots described in Figure 7, the vertical projection coordinate of depots on road segments can be calculated by equation (10)

where

The projection of candidate depot on road network.
Then, to determine the four vertical projections which are the final depots, we choose the one which ensures the original demands’ distance is minimum

where
While if there is a public roadside parking lot in the road segment which is close to the vertical projection and in the same road segment, the public roadside parking lot is determined as the final depot in consideration of construction cost reduction. For example, we obtain
Resource relocation among depots
When locations of car-sharing depots are determined, resource relocation should be on the agenda. Due to the spatio-temporal variation of car-sharing demand, the imbalance in the distribution of vehicles emerges causing situations of short supply and supply exceeds demand. Resource relocation tackles the above imbalance issue by means of vehicle relocation. In this article, we do not consider the capacity of all depots. To determine the balance of supply and demand, we predict car-sharing demand in the near future. Compared with present vehicle stock, it is easy to decide whether the system is unbalanced or not. And the states of all depots are real-time monitored, and resource relocation will be performed if demand exceeds supply in the near future. Here, we propose a graph-based resource relocation model considering the spatial and temporal characteristics of car-sharing mobility. The objective is to determine vehicle relocation strategy while minimizing the time and monetary costs of relocation for the car-sharing demand.
Definition 4. Mobility graph g
Mobility graph
The spatial layout of a city has a significant influence on the social behavior and then affects human mobility patterns which generate the travel and car-sharing demands. Due to the temporal variation of human mobility patterns, here, we subdivide time of day into 1 h time ranges which generate 24 bins per day. The time-varying mobility graphs can be constructed by human mobility patterns of car sharing. Figure 8 presents the dynamic mobility graphs as a set of time series varying step graphs

Time-stamped mobility graph variety of car sharing.
Definition 5. Summary graph
Given a time-varying dynamic weighted directional mobility graph

The summary graph of the two transition graphs at
Then, we adopt the depth-first search strategy to discover connected subgraphs from the above summary graph. Figure 10 shows an example of depth-first search strategy in summary graphs. Depth-first search for graph is similar to depth-first of a tree and the only difference is that graphs may contain cycles unlike trees, so we may meet the same node again in the process of searching. In the following graph, we start traversal from vertex 2. When we come to vertex 1, we look for all its adjacent vertices; vertices 1 and 3 are adjacent vertices of 2, and we mark visited vertices. Then, we start traversal from vertex 1 and find that there are no vertices adjacent to vertex 1 through directed edge. Therefore, we backtrack to vertex 2 and start traversal from vertex 2 to vertex 3. Finally, we can obtain two connected subgraphs which are vertices 3 and 5 and vertices 3, 4, and 5. By analyzing the spatial and temporal characteristics of the connected subgraph, we can discover circumfluence phenomenon and understand underlying human mobility and the car-sharing demand around the city. The connected subgraphs can be used to solve the vehicle relocation issue. The number at the edges indicates the car rental demands between the two depots. The vehicle relocation is performed by the passenger in the process of car-sharing service. We can see that three vertices

An example of depth-first search strategy in summary graphs.
Experiment and results
Case study data set
In order to evaluate our method, we need to obtain several types of data, namely, taxi GPS trajectories, PoIs, road network, and public roadside parking lot. And Table 1 shows the statistics of above data sources.
Statistics of taxi trips, PoIs, road networks, and public roadside parking lots.

PoIs: Points of Interest.
Taxi GPS trajectories
The taxi GPS trajectories reflect the city-wide human mobility patterns. The pick-up and drop-off points of passengers can be extracted from taxi trajectories and the origin–destination (OD) transitions among city regions are formulated.
To predict the car-sharing demand, the OD matrix should be filtered based on our above spatial and temporal filtering rules. Not all the collected trip data are efficient, and the trips with too close distance or too short duration should be filtered. In our experiment, we used a taxi trajectory data set generated by 12,000 Beijing taxis in a whole month (November 2012). Figure 11 shows the distribution of car-sharing demand over the month of November 2012. It is clear that the distribution has a certain periodicity. Car-sharing demand on the weekdays is evidently higher than on the weekends.

The total demand distribution of car sharing in November 2012.
PoIs
In our work, the PoIs are considered as original candidate depots and used to detect the semantic similar regions. The original PoIs are categorized into 10 categories which are scenic spot, shopping mall, airport, railway station, bus station, education and science, car repair, pub/bar, hospital, and hotel. The PoI data set covers 183,799 data items in Beijing at July 2012 which are used in our experiment.
Road network
The road network of Beijing is used to adapt the candidate depots to the side of the road, which consists of 162,246 road segments, 121,771 road nodes, and 17.1% of the road segments are major roads.
Public roadside parking lot
The public roadside parking lot distribution of Beijing is used to adapt the candidate depots. If the candidate depot is close to a public roadside parking lot, the decision maker of operational company could consider to set up a depot at the parking lot to save resource and construction cost. The data set we used covers 5378 records until July 2012.
Index of performance
To evaluate the effectiveness of the car-sharing demand prediction model, we introduce three performance indexes, which are the mean absolute error (

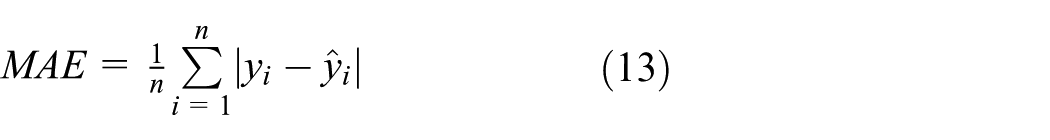

where
To evaluate the validity of the ultimate potential distribution of depots, the rate of service users and average distance from depots are introduced


where
Results
Prediction of car-sharing demand
Our SAE model is compared with three basic algorithms, which are back- propagation neural network (BPNN), support vector machine (SVM) method, and radial basis function (RBF) neural network. Table 2 presents the results of comparison in the given 10 kinds of regions, which are scenic spot, shopping mall, airport, railway station, bus station, education and science, car repair, pub/bar, hospital, and hotel. Table 2 indicates that our SAE model has superior performance than the other three models. For the car-sharing demand prediction in the given 10 regions based on spatial and temporal characteristics, the MRE of our SAE model is about 6%–7%, which means the average accuracy of our SAE model is 93%–94% (1-MRE). For the SAE, the prediction performance is relatively stationary. This prediction accuracy is promising and robust compared with other methods. Meanwhile, for the BPNN, the prediction performance is relatively stationary, which ranges from 88% to 90% or so. However, the MREs of the SVM and the RBF are 15%–18% and 15%–21%, respectively. The maximum average prediction accuracy improvement in the SAE is up to 5.29% compared with the BPNN, 12.97% compared with the SVM, and 14.13% compared with the RBF. Therefore, our SAE model based on spatial and temporal characteristics is more effective and accurate compared with the other three models.
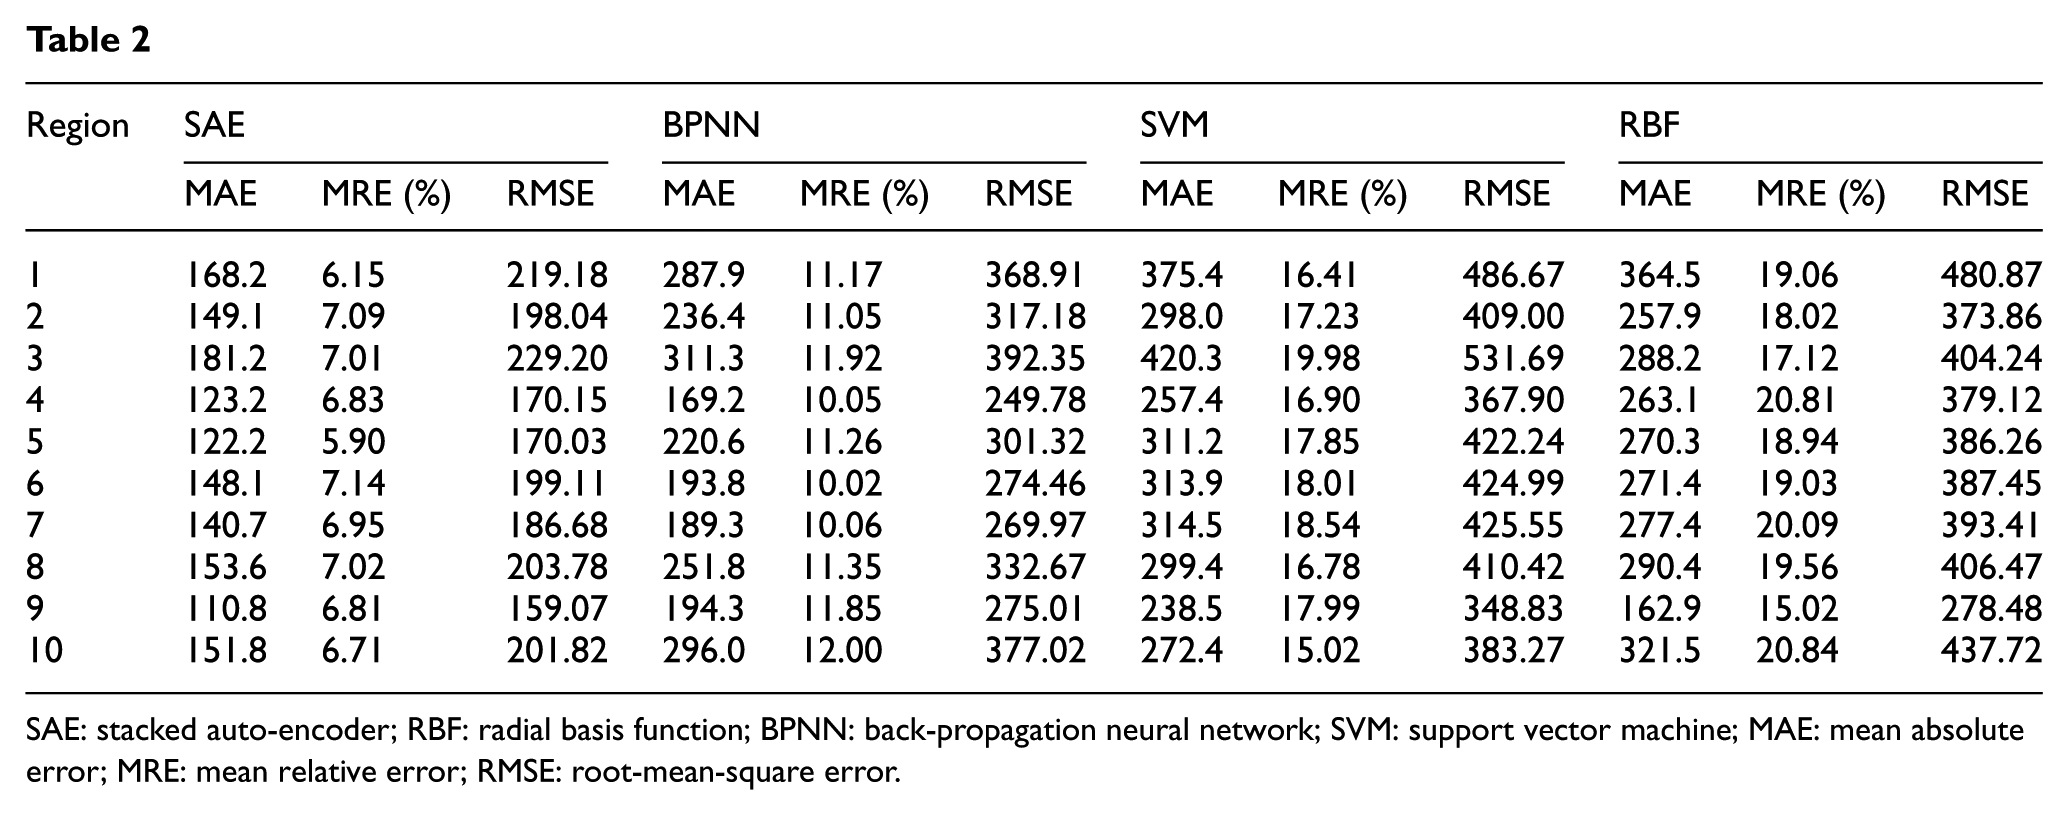
SAE: stacked auto-encoder; RBF: radial basis function; BPNN: back-propagation neural network; SVM: support vector machine; MAE: mean absolute error; MRE: mean relative error; RMSE: root-mean-square error.
Locations of depots
Figure 12 presents the original spatial distribution of the estimated depots of car-sharing systems. The result has not been adapted based on the road network and public roadside parking lots. There are 785 depots resulted by our model. The distribution of depots in the suburbs is sparse, while in the urban areas is more intensive. This is because the demand in the urban areas is higher than that in the suburbs. The big black points represent the depots which have potentially large demand of car sharing, and the first step in prioritizing infrastructure investments is to deploy the first batch of depots at these big black points. And if they want to expand the business in the future, the middle and small black points can be used to construct the car-sharing depots.
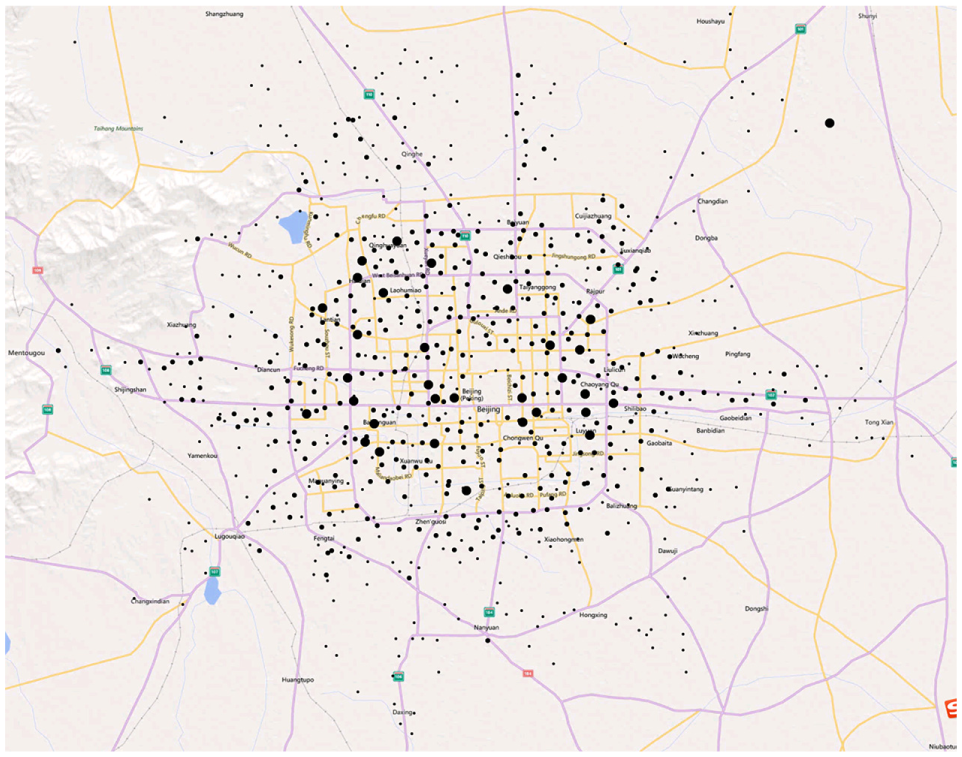
The original location of depots of car-sharing system before adaption by road network and public roadside parking lots.
While for the convenience of users and the practical situation, the depots have been deployed to the side of the road in our experiment. The adaption work is executed based on the road network and existing public roadside parking lots to construct the final roadside rental depots. Figure 13 represents the ultimate location of depots after adaption by road network and public roadside parking lots, and the red points are the changed depots. There were totally 241 depots remained in their original location and 544 depots changed their location due to the need of convenience and budget. Figure 14 illustrates the potential demand of car sharing on 8 November 2012. From the picture, we can see the difference of potential car-sharing demand among different depots.

The ultimate location of depots after adaption by road network and public roadside parking lots.

Potential demand of car sharing.
The final distribution of depots can serve the government and car-sharing companies to make some significant policy and operation decisions, and to improve quality of service, increase corporate profits, and ensure competitive advantage.
To evaluate the validity of the ultimate potential distribution of depots, the rate of service users and average distance from depots are considered. The comparison of above two indexes is illustrated in Figures 15 and 16, in which the depots are determined based on the SAE, BPNN, SVM, and RBF methods but not adapted by road network and public roadside parking lots. From Figure 15, we can see that the rate of service users based on our proposed model is steadily 98% which is higher than the other three methods. Meanwhile, the average distance of depots based on our model is closer than the other three baseline methods, which means that user can walk close distance to rental a vehicle at one depot. The average distance of our proposed method is about 0.453 km. Figures 17 and 18 show the comparison of the rate of service users and the average distance, respectively, in which the depots are adapted by road network and public roadside parking lots. We can see that the service user rate decreases to about 96% from 98% after adapting the depots, which is because some users think the distance is too far beyond the psychological expectations to give up the choice of car sharing, while the average distance decreases from 0.453 to 0.435 km, which is because the adapted depots are mostly on the roadside and the users can rental a car conveniently. However, the improved distance may be very small to several meters, but if the number of the users is very big, the saved total distance is also very big. Thus, the merit and validity of our proposed model are promising and manifested.

The comparison of service users of depots before adaption.

The comparison of average distance of depots before adaption.

The comparison of service users of depots after adaption based on road network and public roadside parking lot.

The comparison of average distance of depots after adaption based on road network and public roadside parking lot.
Analysis of mobility among depots
Obviously, car-sharing mobility among different depots is different with time and space context. The car-sharing mobility indicates the strength of interactions among depots. Here, we choose three typical depots to illustrate the mobility patterns in the transition networks of car sharing, which are Beijing West Railway station (GPS location: 116.308, 39.8851), Majiapu residence community (GPS location: 116.383, 39.8594), and GuoMao CBD (GPS location: 116.467, 39.9144). And Beijing West Station is the largest modern railway transportation station in China, Majiapu residence community is a modern large living area at Beijing, and GuoMao CBD is the typical and largest central business district in Beijing. All the three depots have potentially huge car-sharing demand. Figure 19 shows the car-sharing mobility patterns from Beijing West railway station depot to Majiapu depot, Figure 20 shows mobility patterns from Majiapu depot to GuoMao CBD depot, and Figure 21 corresponds to the mobility patterns from GuoMao CBD depot to Beijing West station depot. From the above three figures, we can see that the car-sharing demand is lower at night than early morning. Generally, there is a repeated three-pronged spike during the weekdays, which are corresponding to the morning (9:00 am), midday (14:00 pm), and evening (20:00 pm) commutes. Note that the morning spike appears at 9:00 am due to the morning rush hour, the midday spike appears at 14:00 pm because commuters always go out to discuss and sign work or the lunch time, and, finally, the evening spike occurs at 22:00 reflecting the late colorful entertainment and nightlife after a day’s hard work. Car-sharing demand in these three spikes is higher than other times. As one might expect, the morning spike is absent on the weekend days, and the another two spikes are smoother than that of weekdays, which is because people need not work and the time distribution of trips is fairly even. It is obvious that the travel demand on weekday is large compared with weekend which corresponds to the reality.
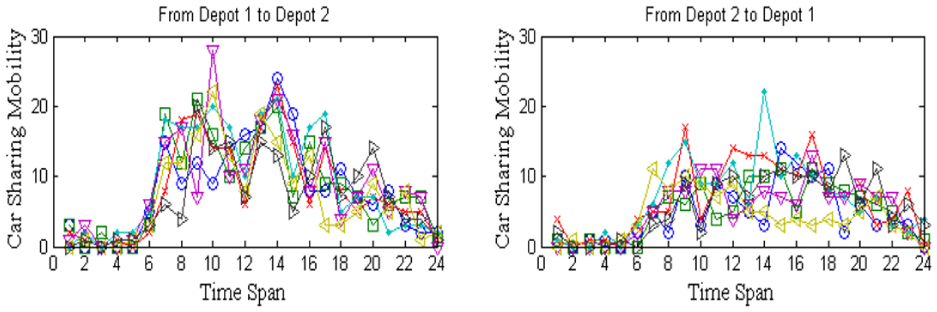
The car-sharing mobility patterns from Beijing West station depot to Majiapu depot.

The car-sharing mobility patterns from Majiapu depot to GuoMao CBD depot.

The car-sharing mobility patterns from GuoMao CBD depot to Beijing West station depot.
Additionally, the car-sharing mobility patterns among the three depots are high enough to perform the vehicle relocation procedure based on the above graph-based model.
Conclusion
This article visualizes the MEC architecture of connected cars. MEC servers can perform computing tasks independently which are fully distributed and decentralized. Then, we propose a deep learning method for car-sharing demand prediction to determine the distribution of car-sharing depots. The deep network is constructed with an SAE model and a logistic regression prediction layer. Unlike the previous methods, our method can successfully learn the latent spatial and temporal characteristics from the raw car-sharing demand data. The deep network is pre-trained by the greedy layer-wise unsupervised leaning algorithm and fine-tuned based on the logistic regression layer to improve the prediction performance. We evaluated our method on a real data set generated by 12,000 taxicabs in November 2012 and compared with the RBF, BPNN, and SVM models. The results show that our model is superior to the competing models. The distribution of car-sharing demand is proved to satisfy power-law distribution. Pareto’s principle is used to filter out the non-compliant candidate depots. And we proposed a dynamic graph-based vehicle relocation model considering the spatial and temporal characteristics of car-sharing demand. The vehicle relocation can be performed in the process of providing services while minimizing the time and monetary costs. In the future, we plan to consider the programming of necessary infrastructure and public utilities, that is, the parking space, the charging piles, and the serving vehicles.
Footnotes
Acknowledgements
This paper is the extension edition of conference paper by Zhu et al.
Academic Editor: Qiang Duan
Declaration of conflicting interests
The author(s) declared no potential conflicts of interest with respect to the research, authorship, and/or publication of this article.
Funding
The author(s) disclosed receipt of the following financial support for the research, authorship, and/or publication of this article: This work was supported by the National Science and Technology Major Project under Grant No. 2016ZX03001025-003, National Natural Science Foundation of China under Grant Nos 61571066 and 61472047, and Special Fund for Beijing Common Construction Project.