
Abstract
This article presents an anchor node based on directional antenna array and reports the design of an automatic test system. The antenna radiation characteristics and the wireless channel model are studied first, followed by the evaluation of a single anchor node localization algorithm for wireless sensor network real-time positioning on the base of antenna radiation modeling and radio channel propagation model research then. Finally, the algorithm is evaluated by experiments in real environments. Experimental results show that the algorithm positioning accuracy could reach 1 m, and angular positioning accuracy error is less than 20° with no data exchange required during the positioning process. Hence, the wireless data transmission protocol complexity is reduced with improved real-time performance. This study is expected to provide technical references for the method research of wireless sensor network real-time positioning and new positioning system in practical applications.
Introduction
Positioning is an important issue in the studies of wireless sensor network (WSN) as the sensor node positioning is the foundation of many research and applications. Sensor data without position information have little value in WSNs. However, the issue has not been fully resolved well until recently.1,2 Due to the diversity and complexity of the WSN deployment environment, there are great difficulties in establishing accurate radio channel propagation model through uniform mathematical formula or algorithm, which brings the obstacle to the positioning algorithm design. Meanwhile, the low-bandwidth, low-cost, and low-power nature of WSNs mean that complex algorithms could not be applied in positioning systems, restricting positioning algorithm design.
In the last few years, the boom of Internet of Things (IoT), 3 cloud computing, and mobile Internet4,5 promotes the development of wireless multimedia sensor networks (WMSNs). 6 In IoT paradigm, many objects in our surrounding will be on the network in various forms. Some objects are sensor nodes and monitor physical or environmental conditions such as temperature, humidity, air quality, pressure, and multimedia data. The WSN combines different kinds of terminal sensor nodes in the number from tens to hundreds into a flexible self-organizing wireless network and provides an access point (AP) for sensor nodes to IoT. Compared to WSN sensor data, images, sounds, and videos could provide more abundant and intuitive information for users. WMSNs suggest possible applications in healthcare, regional monitoring inspection, and emergency communication. These unique applications will require a precise real-time localization and tracking method for WMSNs. Moreover, IoT and cloud computing enable users to access end-to-end services, intelligent systems, and sensor terminals on demand from anywhere. To realize this potential, network bandwidth and system resources for these services and potential applications should be reserved for WSN. The positioning methods must be simple and of low bandwidth so as not to impact existing data communication. Unfortunately, positioning methods based on multi-anchor nodes are currently popular in WSN positioning research,7–9 and the data exchange among anchor nodes causes poor positioning algorithm real-time performance and increases system complexity. Transitioning to a single anchor node, instead of a set of anchor nodes/APs installed across the area, can significantly reduce wireless positioning system deployment costs and wireless network complexity. In addition, the positioning accuracy can be improved by shorter communication distance when the anchor node is installed in the center of the area.
Localization methods based on ranging technology have been necessary to achieve high positioning accuracy. Although localization methods based on time of arrival (TOA) such as ultra-wide band (UWB) location techniques 10 and 801.15.4a chirp spread spectrum (CSS)11,12 could achieve sub-meter accuracy, they need separate positioning process and additional network overhead. The received signal strength indication (RSSI)13–15 is popular in WSN positioning systems as no additional hardware or ranging process is required. However, a large number of anchor nodes are needed, 16 and the radio channel propagation model must be modified 17 to achieve good accuracy because the wireless signal strength is affected by multipath and non-line-of-sight (NLOS) propagation in large-scale areas. Although a building signal strength distribution map could be helpful in high-accuracy positioning, experiments showed that environment parameters and radio signal change would affect positioning results significantly. 18 Recently, Huo et al. 19 presented a fingerprint-based localization algorithm called a weighted K-AP query method for RSSI based indoor positioning (WF-SKL). Large-scale positioning experiments indicated that the algorithm is effective and accurate. Another novel algorithm using RSSI mapping N°3 20 has been proposed where the localization accuracy is improved by multi-powerful classifiers. Meanwhile, there were some state-of-the-art localization algorithms reported. Wu et al. 21 have presented a relevant WSN localization algorithm using probabilistic non-metric multidimensional scaling and maximum likelihood estimation (NMDS-MLE) method in which the UWB-based communication system was used and the corresponding localization error was about 0.7522%. A novel positioning system using online compressive sensing theory named counting and localization using online compressive sensing was reported by Wu et al. 22 Localization methods based on angle of arrival (AOA) is accurate, and these methods have low requirements of the node transmitting power consistency. 23 For instance, the work published by Amundson et al. 24 presented a radio interferometric positioning system which consists of a multi-node antenna array, which could complete positioning in 0.5 s, and the accuracy is better than 3°. Kulakowski et al. 25 studied AOA positioning algorithm based on antenna array in theory. Moreover, in indoor positioning technology, field scientists from Nokia Research Center presented a novel positioning solution called high-accuracy indoor positioning (HAIP), 26 and this system could locate mobile devices by measuring AOA through built-in switchable antenna array on anchor nodes, and the highest expected positioning accuracy was better than 0.3 m. Unfortunately, HAIP was based on the Bluetooth 4.0 standard, which restricts its application in WMSN real-time localizations. However, it provides a new idea for WSN positioning scheme design. We have developed a positioning method based on directional antenna array and direction of arrival (DOA). In the last few years, interest in this area has expanded as suggested by the increase in significant interrelated research publications. G Giorgetti et al. 27 present a single anchor localization system using a switched-beam antenna and reported an average localization error of 1.7 m. M Passafiume et al. 28 improved the system and demonstrated an RSSI-based DOA-only multiple signal classification (MUSIC) algorithm with a localization angle error less than 10°. Moreover, Sun et al. 29 proposed a low-complexity DOA-only MUSIC algorithm. Simulation results show that the algorithm has a much lower complexity with a minimal cost of slightly reducing the estimation accuracy. A localization scheme called angle of arrival localization with received signal strength indication differences (ALRD) is reported in 2013, 30 which could estimate a target node’s position with two beacon nodes. A Jaffe and M Wax 31 present an accurate single-site localization approach based on maximum discrimination multipath fingerprinting (MDMF). S Nagaraju et al. 32 proposed a simple energy-efficient RSSI-based fingerprinting algorithm using an electronically steerable parasitic array radiator antenna. Rzymowski et al. 33 proposed a simple and energy-efficient RSSI-based indoor localization mechanism using a single anchor node with sector antennas.
Most of the above multi-antenna-based solutions are accurate or energy effective or easy to deploy. However, there are many disadvantages including complex algorithm, big fingerprinting database, high power consumption, and limited working area. We have designed an anchor node with an antenna array that uses multi-radio modules and directional antennas to collect signal strengths when receiving wireless data from the target node. The angle of the node can be calculated by comparing signal strengths and combining the distance reckoned by the signal strength. With this design, the node position can be determined by a signal anchor node. This method does not require data exchange or extra ranging process and can meet the requirements of real-time positioning. Besides static WSNs, the proposed solution is also suitable for more complex networks including mobile WSNs,34,35 wireless sensor, actuator, and robot networks (WSARNs), 36 or heterogeneous networked cooperating objects.37–39 However, the directional antenna transmission characteristic is complex, which is different from omnidirectional antennas like 3-dBi loaded antennas. Furthermore, antennas interact with each other and change antenna array radiation characteristics, so free space radio channel propagation model does not apply.
In this article, we studied directional antenna transmission characteristics measured and analyzed antenna array RSSI data, following a single anchor node positioning method for WSNs. Experimental evaluation of the algorithm and comparison of the algorithm with the currently used algorithms indicate a potential improvement in real-time positioning methods and suggest a new design for positioning systems.
Anchor node design based on antenna array
Basic rule of antenna array design
For successful antenna design, several principals were considered. First, directional antennas should be applied to measure angle or direction, and these antennas should have wide beamwidths and regular radiation patterns. Meanwhile, antenna array consists of same antennas, and all antennas are mounted on the base board with a strict equal intersection angle.
Directional antenna
Although there are some manufactured directional antennas available, they could not meet our design requirements due to big size, irregular radiation pattern, poor consistency, or difficulty in installation. It was therefore necessary to design and fabricate a novel antenna. According to our investigation, the printed circuit board (PCB) resonant antenna in Su’s 40 work has good performance, which is a dual polarization antenna with a 147° beamwidth and a front-to-back ratio of 20 dB. Most importantly, this antenna structure is simple, and it is printed on a low-cost FR4 substrate. The antenna characteristic is tested and is consistent with those in the previous report, so we chose this antenna as our array antenna. A constructed prototype is shown in Figure 1. Figure 1(a) shows a single antenna with a separation between the antenna and reflection board of 10 mm. The antenna size (including backboard) is 144 mm × 55 mm. Figure 1(b) is the radiation pattern of the antenna at the distance of 1.2 m. Figure 1(c) is the antenna array prototype, which consists of four directional antennas, and all antennas are mounted on the base board with an intersection angle of 90°. The antenna array size is 300 mm × 300 mm × 144 mm.

Directional antenna array: (a) prototype of the directional antenna, (b) polar diagram of the directional antenna, and (c) prototype of the directional antenna array.
Although single antenna radiation pattern is regular as shown in Figure 1(b), the infinite ground plane condition in single antenna board changes when the antenna is mounted on the base board; however, antennas affect each other in multi-antenna arrays. As a result, the antenna radiation patterns would change in the antenna array. Therefore, we need to measure radiation characteristic of an antenna array before designing a positioning algorithm.
Antenna radiation characteristics and positioning algorithm
Antenna radiation characteristics measurement
Radiation pattern and space loss are two critical parameters of antenna radiation characteristic. The radiation pattern is used to calculate the angle, and space loss is used to acquire distance. We designed an automatic antenna measurement system to measure antenna array radiation characteristic. Specifically, we fixed both the receiving node and the antenna array at a specified location and collected RSSIs by rotating the antenna array 360° instead of moving the receiving node around the anchor node. The antenna array rotation is controlled by a step motor. The antenna array is mounted on the top of a stainless steel connecting rod, and the connecting rod is mounted on the step motor shaft through a cased-muff coupling. When the main board sends a pulse to the motor driver, the step motor rotates 0.18°, and the antenna array would rotate simultaneously. The schematic diagram of the system is shown in Figure 2(a), and Figure 2(b) shows the prototype of the system.

Antenna transmission characteristic test equipment: (a) schematic diagram of the system and (b) prototype of the system.
The testing system consists of two modules, the right one is the antenna measurement module (AMM), and the left one is the receiving module (RM). A is the antenna array, B is the GPS receiver LEA-6H-002 with a 32-dB active-ceramic GPS antenna from Cirocomm Technology Corp., the theoretical GPS positioning accuracy is 2 m and the actual accuracy is better than 1.5 m in open space, and the update rate is 1 Hz. C is the main board with micro control unit (MCU) and wireless modules. The MCU is MSP430F5438A, working at main frequency of 16 MHz, and the wireless chip is CC2500, working at a radio frequency of 2450 MHz with a data rate of 250 kbps. D is the system power source of a 7.4-V 4000-mAh lithium-ion battery pack. E is the stainless steel connecting rod. F is the step motor driver. G is the 29.4-V 4000-mAh lithium-ion battery pack, the step motor power source. H is the step motor with the step angle of 1.8° The angle could not meet our accuracy requirement. So, we adopt a planetary reduction gear with a reduction–gear ratio of 10:1 to reduce the step angle to 0.18°. I is the aluminum alloy support to hold the AMM firmly. J is the receiving node with a 3-dBi omnidirectional antenna and a 7.4-V 4000-mAh battery pack. L is the tripod. Height of both the anchor node and the receiving node is 1.8 m.
At the beginning of the experiment, the anchor node and the receiving node wait for the GPS coordinates fixed and then they enter the primary process. For the receiving node, it waits for wireless data in receiving mode; once a wireless packet is received, it reads RSSI and its GPS coordinates immediately and packages these data and then sends a wireless packet back to the anchor node. The receiving node then returns to receiving mode. For the anchor node, when the start key is pressed, the measurement begins. The process flowchart is as follow.
PackNo = 0
while(angle < 360)
if (T = Time to Send a packet)
check angle and previous RSSIs of all antennas
choose a antenna to send the ATST packet
while(t < Timeout)
waiting for the ACK packet for the receiving node
if(ACK packet is received)
store RSSIs of all antennas, the GPS coordinate and the receiving data to the TF card
rotate the motor
PackNo + 1
else if(t>=Timeout)
resend the packet
The operation was repeated 2000 times to complete the measurement. The single angle measurement time was 147 ms, and the total time for the entire measurement is about 5 min. After the measurement, the data in the TransFlash (TF) card is exported to the database through our data process software. Five measurements were collected: the distance between the anchor node and the receiving node, RSSIs of four antennas on the anchor node, GPS coordinates of the anchor node, RSSI of the antenna on the receiving node, and GPS coordinates of the receiving node.
Space loss measurement
Space loss can be used to estimate the distance, so we measured RSSIs at different distances to calculate the space loss. We repeated the measurement in section “Antenna radiation characteristics measurement” at seven different distances. Unlike omnidirectional antenna, the antenna array radiation pattern is not a circle, so we record the maximum and minimum RSSIs at the same time. The space loss curve is shown in Figure 3.

Maximum and minimum RSSIs at different distances.
Positioning algorithm
In theory, we could localize the target through a positioning algorithm using the antenna array radiation pattern and transmission loss. However, the radiation pattern curves in Figure 4 show that different distances are not predictive. The main axis of the antenna is observed to shift with the changing distance, and there is no regularity among these curves.

The original antenna array radiation characteristics.
It can be seen that when the antenna axis offsets are from 0° to 15° some curves overlap each other. Therefore, positioning algorithm design based on this antenna array would face a great challenge. Therefore, we took means to improve antenna array radiation characteristic; at first, we mounted reflecting isolation panels, then we used copper foil tapes to seal antenna backboard joints. The finished antenna array is shown in Figure 1(c). The experimental results show that the improved antenna array has regular radiation pattern curve and could meet the demand of positioning algorithm, which is shown in Figure 5.

The improved antenna array radiation characteristics: (a) antenna array and (b) antennas.
Normally, the antenna array radiation pattern is defined by two nearby antennas which have strongest RSSIs. However, the experimental results in Figure 6(b) show that the backward radiation becomes strong, and the curve in backward is irregular as the distance increases. Therefore, elimination of abnormal data and antenna determination are important in our algorithm. We introduced two parameters called reference RSSI
Calculation area partition;
Target RSSI and target angle
Result correction;
Distance calculation from the RSSI table.

The calculation area partition diagram.
Calculation area partition
The calculation area partition is the first step of our algorithm. Figure 7 shows a typical radiation pattern of antennas and the antenna array. The curves are regular, and there are four maximum RSSIs (RSSImax) at 0°, 90°, 180°, and 270°, and four minimum RSSIs (RSSImin) at about 45°, 135°, 225°, and 315°. The angle interval is 45°, and the RSSI difference between RSSImax and RSSImin is a fixed value of 13.0 dB, which we call Rstep. As mentioned above, the antenna array radiation pattern is defined by two nearby antennas, and the calculation area could be divided into four sub-areas. Specifically, antenna 1 and antenna 2 in the first quadrant, antenna 2 and antenna 3 in the second quadrant, antenna 3 and antenna 4 in the third quadrant, and antenna 4 and antenna 1 in the fourth quadrant.

The flowchart of the positioning algorithm.
By looking at the curves, we found that the angles of RSSImin could divide these sub-areas further. When the angle approaches the antenna axis, the antenna RSSI becomes strong, and the other antenna RSSI becomes weak. On the right-hand side of 45° axis, antenna 2 plays the major role, while on the left-hand side of 45° axis, antenna 1 plays the major role. Based on this geometry, we divided the calculation area into eight sub-areas as shown in Figure 6, with each sub-area covering 45°, and the offset angle
Target RSSI and angle calculation

where
Parameter table.

RSSI: received signal strength indication.
Result correction
It can be seen in Figure 7 that the curves are sharp when

where
If RSSIa < −67 dBm and

If the reference angle is one of the following: 0°, 90°, 180°, and 270°, we calculate twice using antenna 1, 2, 3, and 4 with nearby two antennas by preceding equations, and the closest results to the last results are chosen as the final results. By now, we get the angle and the RSSI, which are also the new
Distance calculation
At last, we calculate the distance by RSSI

where
It can be seen that only simple arithmetic is involved in this positioning method. Additionally, the algorithm complexity is significantly reduced using the lookup table instead of complex mathematical operations. The algorithm is suitable for low-power systems with limited power or weak computing capacities like WSNs and IoTs. The simplified flowchart of the algorithm is shown in Figure 7.
Simulation analysis
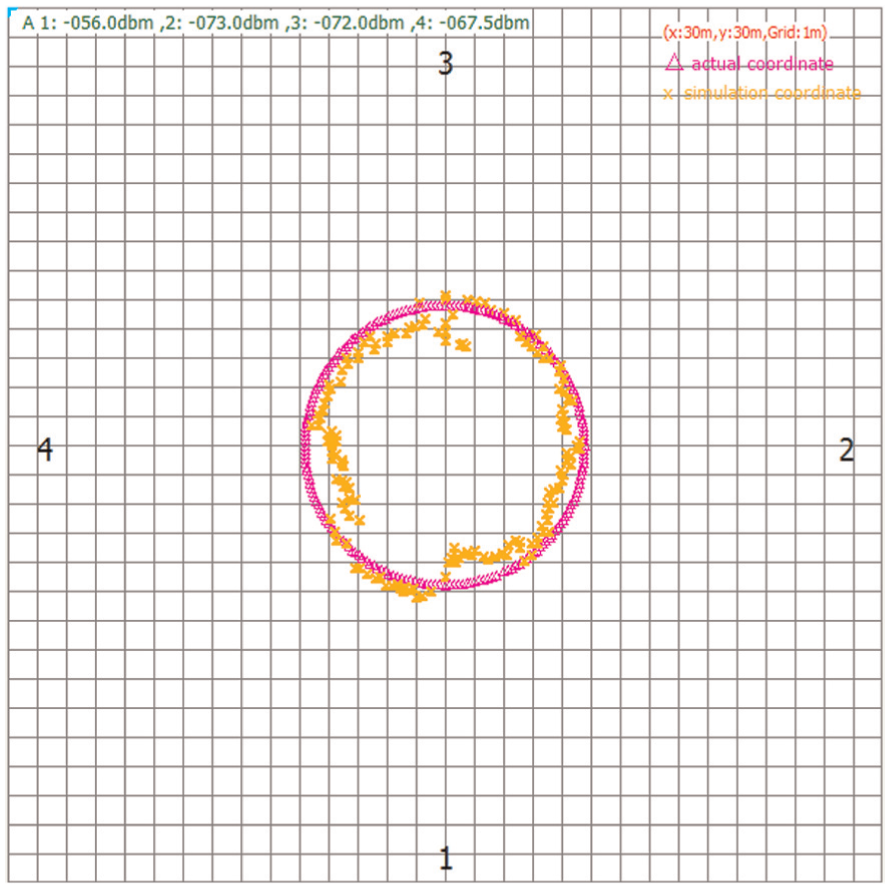
A comparison between positioning algorithm simulation and actual coordinates was done. It simulates target node positions from 0°to 360°with angle step of 1.8° on the distance of 4.8 m. RSSI data are taken from the measurement database in section “Antenna radiation characteristics measurement.” The simulation result is shown in Figure 8, where purple triangles are actual coordinates and orange “X” marks are the coordinates calculated by the positioning algorithm, the numbers in bold black are the axis directions of four antennas. The grid size is 1 m × 1 m. Figure 9 displays the distance and angle comparison results.
Positioning algorithm simulation diagram.

The distance and angle comparisons between the simulation and actual position on 4.8 m: (a) distance comparison result and (b) angle comparison result.
The errors in distance measurement were all less than 1.5 m, the average distance error is 0.59 m, the angle errors were all less than 30°, and the average angle error is 7.48°. We also simulated more than 800 points on different distances, and these points were taken from the database randomly. The numerical results shown in Figure 10 exhibit that the distance errors were all less than 4.2 m, the average distance error is 0.75 m, the angle errors were all less than 34.5°, and the average angle error is 10.56°. The simulation results indicate that the algorithm is accurate.
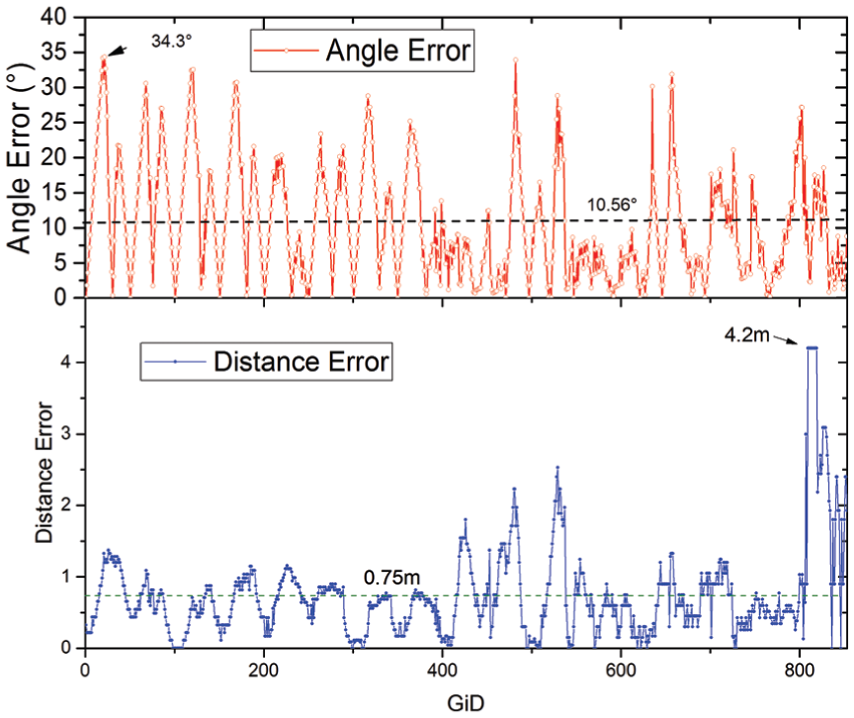
The distance and angle comparisons between the simulation and actual position.
Results and discussion
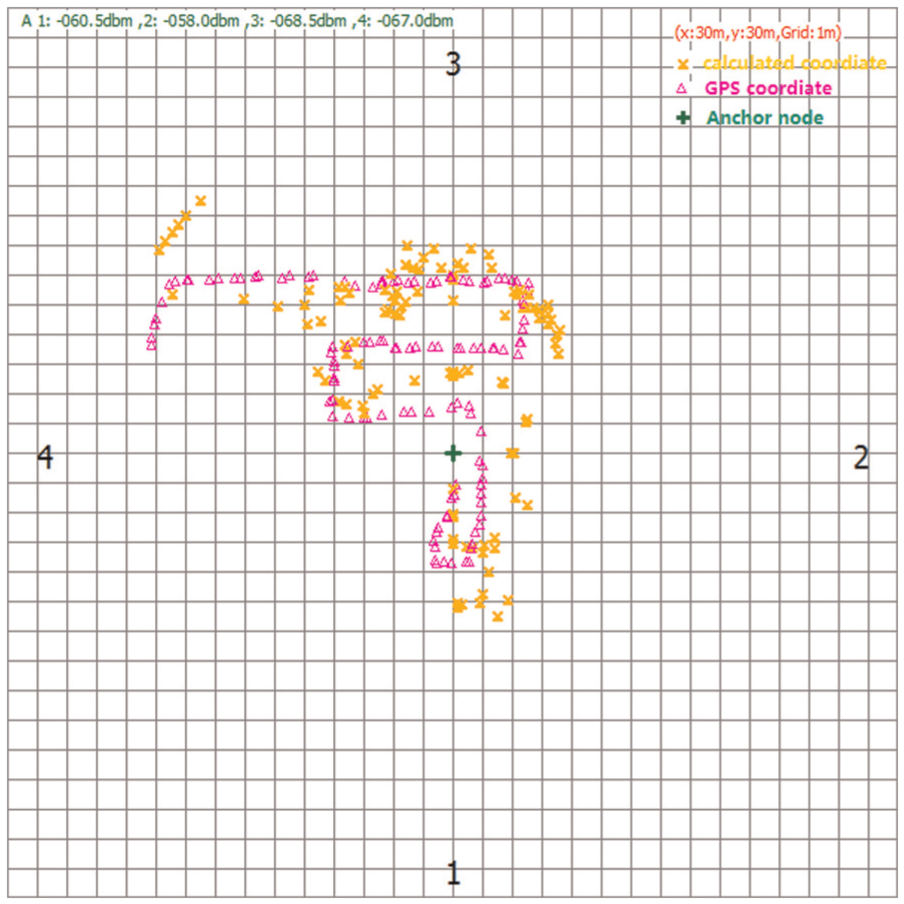
In this section, we describe the implementation of the single anchor node positioning algorithm and the results of the experiments using the implementation. The experiment was conducted on an open square. The wind was 2–3 Beaufort scale northerly, and the atmospheric temperature was about 30°C during the experiment. The anchor node was located at the green cross mark in Figure 11, that is, the latitude and the longitude are 117.06840°N and 36.394798°E, respectively. The localization experiment was done by an experimenter moving the receiving node randomly; then he stopped for more than 1 s before he pressed the testing key. The receiving node broadcasted a wireless packet when the testing key was pressed, the anchor node received the packet and acquired related data and then stored the data to the TF card, and it sent the acknowledge packet to the receiving node at last. The experimenter repeated the operation for more than 100 times until the test was done.
Single anchor node positioning test diagram.
The test result is shown in Figure 11, where the green cross mark means the anchor nodes, purple triangles are GPS coordinates, orange “X” marks are the coordinates calculated by the positioning algorithm, and the numbers in bold black are the axis directions of four antennas. The grid size is 1 m × 1 m.
We calculated the distances and intersection angles between the target node and the anchor node with GPS coordinates and then proposed an algorithm. Figure 12 shows the distances and angles calculated by above two means.

The distance and angle mapping of GPS and anchor node positioning.
In Figure 12, GiD is the test number, black lines are distances between the target node and the anchor node, and blue lines are intersection angles between the target node and the anchor node. Lines with hollow squares are distances calculated by the positioning algorithm. Lines with solid blocks are distances calculated by the GPS coordinates.
Figure 13 shows the distance and angle errors of the positioning algorithm. It can be seen that angle errors are less than ±20° except points from 20 to 40, where there is a large deviation, the error reached ±50°. All distance errors are less than 3 m, and the average error is 1.01 m. Distance errors of 58.4% of measurement data are less than 1 m. This experimental result demonstrates the accuracy of the proposed algorithm. We noticed that the target node was near the anchor node when the number is between 20 and 40. The distance is less than 2 m, and the distance error is less than 1.5 m. Angles of nearby numbers change more than 90°. Meanwhile, our algorithm was optimized for medium-range localization, which causes big angle calculation error; we are going to examine this issue in a future study. The medium-range localization is more accurate as we mentioned, because the distance error is naturally small in the short range because the RSSI is high, while the localization algorithm optimization is hard in the long range as the RSSI is affected by many factors. For example, testing points from 40 to 59 and 70 to 107, the distance between the target node and the anchor node on this these points are between 4 and 8 m. The average distance error of these points is 0.63 m, and the average distance error is 9.9°, which coincide with the first simulation results. When the target node is far away from the anchor node, the RSSI changes slowly and the wireless signal strength is too low for accurate measurement; meanwhile, the multipath effect increases the RSSI error. Together, these factors cause the distance error incensement. However, the angle error has no obvious changes as all antennas are affected by above factors, and their RSSI ratios are relatively stable. Multi-anchor nodes could be used to achieve higher accuracy for long-range localization.

The error contrast diagram of GPS and single anchor node positioning.
The cumulative distribution function (CDF) was adopted to evaluate the algorithm localization error, and Figure 14 exhibits that the CDF of experimental results and simulation, as shown in the figure, are in good agreement with the simulation. Taking the 75% point of the CDF as a reference point for the accuracy, it is clear from Figure 14 that the experimental data achieve 1.5 m accuracy and the simulation data accuracy is better than 1 m.

CDF of experimental results and simulation.
Discussion
Algorithm complexity analysis
In this article, we presented a single anchor node positioning algorithm, and there are several advantages over multi-anchor node algorithms as follows:
1. Because there are no data interactions between anchor nodes, network cost is low. For multi-anchor nodes algorithm, we assumed the anchor node number is N, at least N−1 times data interactions are required to get all necessary data, and the corresponding network time overhead is
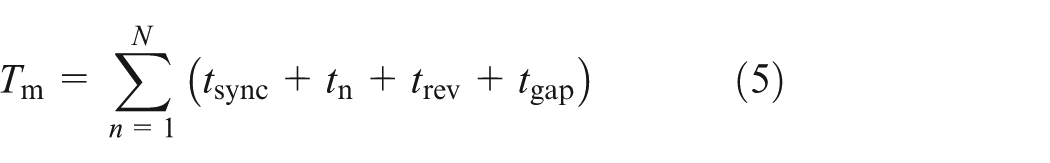
where
As shown in Figure 15, the time cost is only 50% of that in three anchor nodes algorithm, and the time cost ratio would reduce further with the increase in the number of anchor nodes as multi-anchor nodes are popular in WSN localization systems for better performance. When there are eight anchor nodes, the time cost ratio will reduce to 14%, and users do not need to consider about wireless bandwidth or channel management.

Time cost of single node algorithm and multi-node algorithm.
2. The algorithm uses simple mathematical computations and RSSI distribution map built by premeasured data to simplify the calculation. Meanwhile, the positioning operation is only concerned with the last location correlation. Specifically, every positioning operation requires 87 comparisons, 3 additions, 23 subtractions, 6 multiplications, and 5 divisions at most. For concentric anchor beacon with equal width, 7 a trilateration algorithm for multi-node localization, the computations are 3 comparisons, 66 additions, 88 subtractions, 92 multiplications, 32 divisions, and 12 squares. The more accurate algorithm in Papamanthou et al. 9 needs at least 192 multiplications. By contrast, MUSIC algorithms are much complex, and the complexities of the standard MUSIC 27 and low complexity-multiple signal classification (LC-MUSIC) 29 are computed as 2.57×10⁶ and 3.16×10⁵ floating-point operations per second, respectively. For fingerprint-based localization algorithm, fingerprint data are stored in a database on the computer, for example, WF-SKL algorithm 19 uses a computer installed the MySQL database for data analyzing and the positioning speed is lower than 0.5 s for a fingerprint distance of 5 m. Although localization with dynamic channel allocation (LDCA) algorithm 32 is clean and efficient as it requires one addition, one division, and one involution, four sectors in the anchor node work separately on different channels, therefore only distance could be estimated for RSSI lookup table. In a word, system memory and processor capability requirements are limited for our algorithm, and this algorithm could be easily realized in most WSN-embedded systems. In addition, the speed of floating point operations in most embedded processors are very slow and require much more resources than the fixed-point arithmetic; we would optimize the algorithm by replacing floating variables with equivalent fixed-point operations in the future.
Algorithm performance analysis
At last, we compared our algorithm with some existing WSN positioning algorithms; the localization error rate is adopted to evaluate algorithm performance, and the result is shown in Table 2, where N.A. means the data are not available in the literature. Note that there are two DOA-only algorithms, LC-MUSIC and received signal strength indication–multiple signal classification (RSSI-MUSIC), and the measurements for them are angles.
Comparison of existing work.

MUSIC: multiple signal classification; DOA: direction of arrival; RSSI: received signal strength indication; N.A.: not applicable; RSSI-MUSIC: received signal strength indication–multiple signal classification; ESPAR: electronically steerable parasitic array radiator; MDT: maximum discrimination transformation; ALRD: angle of arrival localization with received signal strength indication differences; AOA: angle of arrival.
The number in the brackets is the antenna number per node for those with multi-antennas.
As LDCA algorithm is a ranging algorithm, the target node position is unavailable; the error rate is calculated as localization error divided by working distance.
Table 2 shows that the absolute localization error of the algorithm is medium compared with other algorithms. When the experimental/simulation area is considered, the proposed method has a better performance than all RSSI-based algorithms and most DOA or fingerprinting algorithms. Specifically, the calculation error ratio is 4.17%, which is worse than maximum discrimination transformation (MDT) (2.7%) and RSSI-MUSIC (2.78%) but better than others. Except for the DOA-only algorithm RSSI-MUSIC, which is not suitable for WSN target node positioning, the proposed method have the second best localization performance. Also, we take the anchor node number into account and introduce a parameter called single antenna localization error
Conclusion
In summary, this article designed and made an anchor node based on an antenna array and an antenna radiation characteristic automatic testing system. Then, on the base of experimental data, we analyzed the antenna array transmission characteristic and optimized the antenna array structure to achieve better radiation pattern. We also measured the space loss by recording RSSI on different distances. Then, we presented a low-complexity single anchor node real-time positioning algorithm based on RSSI and AOA; the experimental results show that the algorithm could reach 1-m positioning accuracy and less than 20° of angle error by a single anchor node. The anchor node numbers and system deployment complexity in WSN positioning systems could be significantly reduced by applying single anchor node positioning method; this algorithm and anchor node hardware design suggest possible references for WSN and IoT real-time positioning methods and new positioning systems.
Footnotes
Acknowledgements
The authors thank the anonymous reviewers for their valuable comments.
Academic Editor: Antonio Lazaro
Declaration of conflicting interests
The author(s) declared no potential conflicts of interest with respect to the research, authorship, and/or publication of this article.
Funding
The author(s) disclosed receipt of the following financial support for the research, authorship, and/or publication of this article: This research was supported by the National Natural Science Foundation of China (grant no. 61401256) and the Basic Research Project of Shandong Academy of Sciences (grant no. KJH2015021).