
Abstract
We designed and manufactured several types of simulated faults with different-size rectangular zigzag gouges, and sheared them by traditional double-direct shear tests. Simultaneously, the shear force and corresponding acoustic emissions were recorded during shear-slip of rectangular zigzag gouge, and the variations of shear force and acoustic emission energy characteristics related to shear-slip events were analyzed. Especially, the relationship between shear-slip characteristics and zigzag length and width was also revealed. In addition, the significant differences of slip characteristic parameters between shear-slip of an intact zigzag and friction and sliding on rough plane of a sheared zigzag were summarized, and it might be used to judge the different stages of a fault slip with zigzag gouge. In conclusion, this work may reveal the characteristics of shear-slip and friction under conditions of different-size rectangular zigzag gouges of simulated fault and thus provide valuable insights into precursors of earthquake.
Keywords
Introduction
Earthquake resulted from dynamic slip on a stressed fault often produces more serious consequence, and it is always the core research topic for geological community to reveal the mechanism and precursors, and propose the corresponding control strategies of earthquake. The precursory effect of earthquake is associated with the energy release during fault slip, which reflects initiation and propagation characteristics of gouge fracture as slip propagates along the fault plane. Many new studies about earthquake mechanism have shown that the variations in fault-slip rate caused by irregularity of fault plane can directly change the state of store or release of strain energy, which is the main inducing factor for earthquakes.1,2 Therefore, the experimental investigation of slip mechanism, energy release, and precursors of instability and failure of a fault is critical.
According to recent research on fault-slip simulation experiments, there are three experimental configurations, the triaxial configuration,3,4 the biaxial configuration,5,6 or the ring-shear configuration,7–9 which are widely used to simulate shear-slip of artificial faults. Especially, double-direct test method is widely used to research fault-slip characteristics under fixed stress state. For example, Mair et al. 10 shown a systematic dependence on loading velocity by measuring acoustic emission (AE) reflecting the characteristics of fault slip during double-direct shear of a simulated fault gouge. Karner et al. 11 obtained the calculation formula of friction coefficient under the effect of shear loading of fault slip during double-direct testing. Beeler et al. 12 revealed the effect of loading rate on stress drop as well as the occurrence of stick-slip with double-direct experiments of stick-slip models.
According to the related literature, most experiments show that the slip planes of simulated fault are granular gouges and only focus on the variations of elastic waves speed across fault planes. For example, the different gouges were applied in the experiments of fault slip, and pressure dependent of those gouges were diverse due to the variation of initial compaction rates;13,14 therefore, the velocity of nucleation of frictional instability and earthquake rupture was affected by fault gouge size. 15 In addition, the friction strength, stress state, deformation, and damage of meshing area can be reflected by the velocities of elastic waves when it penetrates through these granular materials.16,17 The variations of elastic wave velocities within microstructure caused by gouge deformation also have a specific law,18,19 and elastic wave speed measurement during slow slip possibly can provide a basis method for earthquake prediction. 20 In summary, most of experimental investigations with slide planes implement granular gouges and seldom take zigzag on the slide planes into account as possible gouge type of natural faults. On the other hand, the research of seismic waves mainly focuses on velocity change of elastic wave, without considering the elastic energy release during fault slip.
In our previous study, we have preliminary researched the shear-slip characteristics and AE effects of different-size triangular zigzags. 21 In this work, we elaborately designed and manufactured several types of simulated faults characterized by different-size rectangular zigzag gouges and also used a PCI-2 AE system to record and analyze the energy release during simulated fault slip. Simultaneously, the comparative analysis of slip characteristic parameters between shear-slip of an intact zigzag and friction and sliding on rough plane of a sheared zigzag was conducted. The evolution of localized stress will be more obvious during zigzag gouge shear-slip, and it may be clear to understand the energy accumulation and release characteristics before and after zigzag fracture. In conclusion, our work will attempt to further discuss the characteristics of stress and energy release under conditions of different length and width rectangular zigzag gouges of a geological fault. In addition, it may shed light on the different characteristics between shear-slip and friction process. And thus, it should provide valuable insights into precursors of earthquake.
Methodology
Test apparatuses and samples process
The experimental was carried out using a RLJW-2000 biaxial loading testing machine and PCI-2 digital AE monitoring system. In the experiment, the RLJW-2000 testing machine was controlled by electronic servo-controlled feedback systems to apply normal and shear loads to the samples, and the AE monitoring system with four Nano30 cylindrical sensors was used to record AE signals, as shown in Figure 1. Instead of rock material, the samples were made by polymethyl methacrylate (PMMA) materials and manufactured into two kinds of blocks, cubic and rectangle blocks, that the sizes were 50 mm (length)×50 mm (width)×50 mm (height) and 100 mm (length)×50 mm (width)×50 mm (height), respectively. Each sample was assembled with two cubic blocks A, C and a rectangle block B, and the compound mode of blocks A, B, and C is shown in Figure 1.
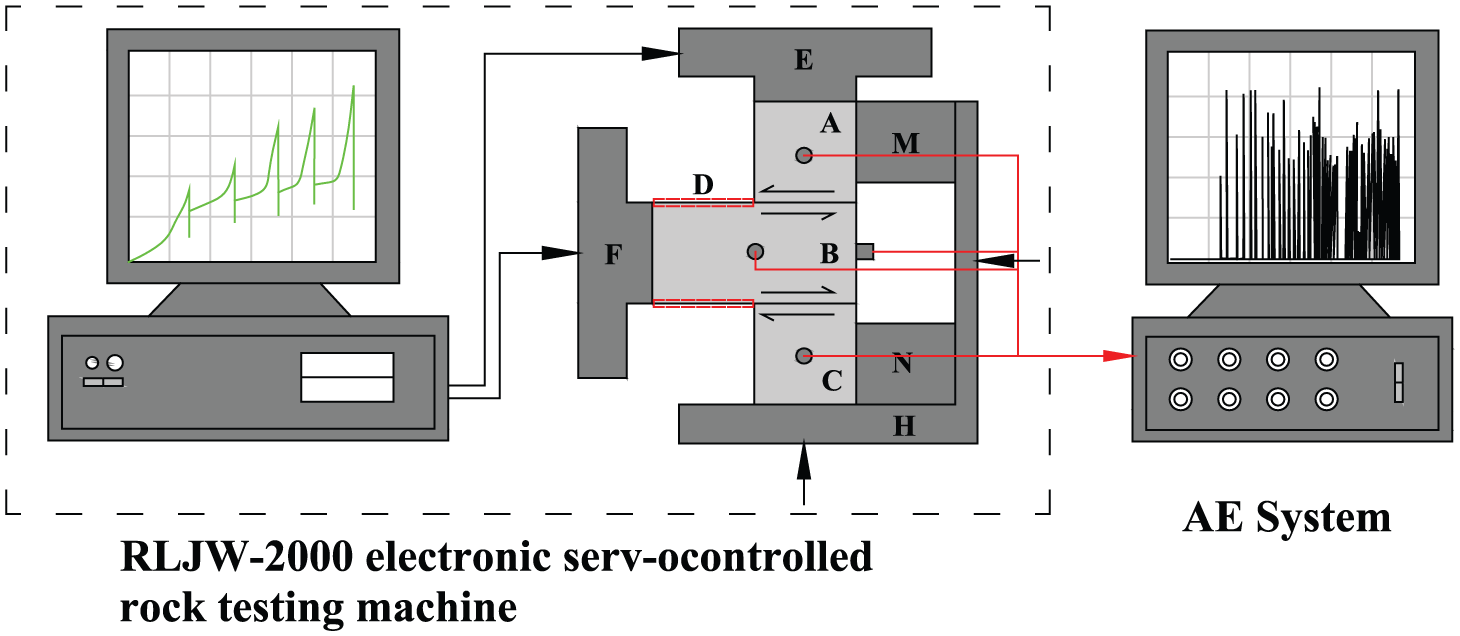
Testing and AE monitoring system.
In the test, different-size rectangular zigzags were designed and sculptured on the upper and lower surfaces of the central block, B, of each sample, and the zigzag gouge layers were sheared and slipped to simulate fault roughness. The tests included three groups of assemblages, Samp. 1, Samp. 2, and Samp. 3, respectively; the normal force applied on samples was 8 MPa, and the displacement velocity of the horizontal ram of press machine was set to 1 µm/s. The zigzag parameters of Samps. 1–3 are shown in Table 1, and the zigzag size and arrangement on block B of Samps 1–3 are shown in Figure 2. Special explanation: the width of the second zigzag of Samp. 3 was designed as 2 mm, however, the actual width is 1.5 mm due to the machining error.
The zigzag parameters of Samps. 1–3.
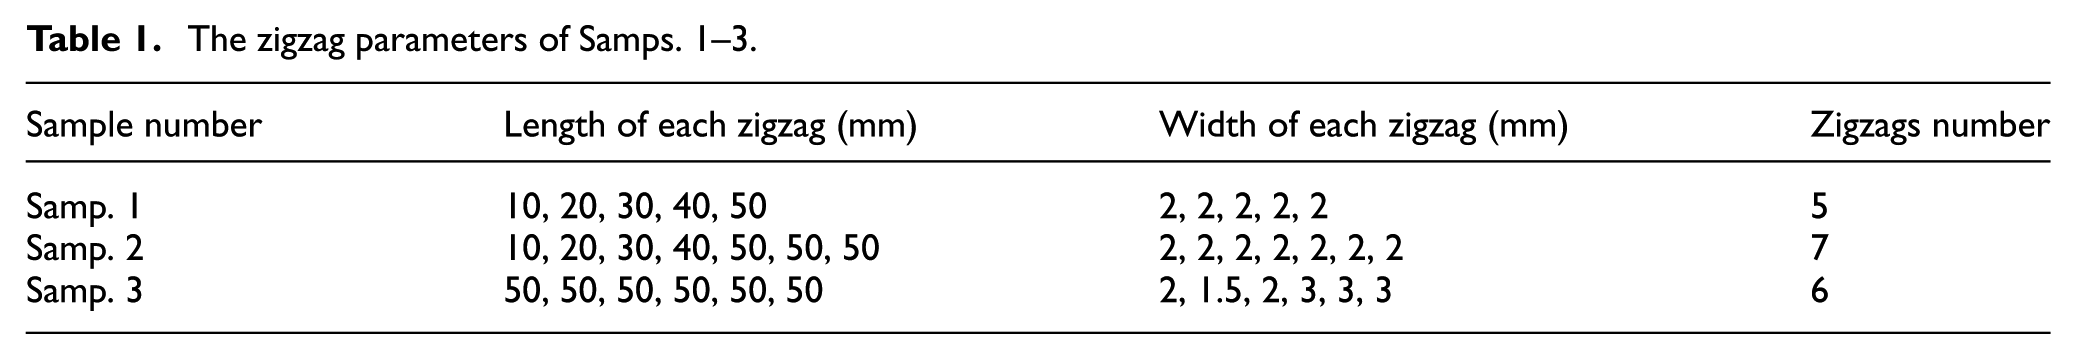
Zigzag size and arrangement on block B of (a) Samp. 1, (b) Samp. 2, and (c) Samp. 3.
Testing procedure and parameters
Reference to our previous double-direct shear tests, 21 under constant normal force, two zigzag gouge layers between blocks were sheared simultaneously, as shown in Figure 1. The constant normal force applied by vertical ram of the testing machine is 8 MPa, while the shear traction velocity of horizontal ram was 1 µm/s. Due to the contact area, the layer dimensions were 50 mm×50 mm, and shear and failure of zigzag as well as friction and sliding of rough plane occur within both gouge layers.
First, normal force was applied and maintained constant with vertical ram, and then shear force was applied by horizontal ram and pushing the central block through zigzag gouge layers with the set velocity. Both the vertical ram and horizontal ram are controlled by the load-feedback servo system. At the same time, the AE system will begin to record the generated AE signals during shear loading. The test will be ended until the last zigzag of an assemblage was completely sheared.
During the tests, the shear force and AE events will be continued record, and the AE signals of each shear-slip and friction events are measurable. Therefore, the influencing rules of zigzag length on shear-slip characteristics can be revealed by comparison of the zigzags with different lengths of Samps. 1 and 2; meanwhile, the influencing rules of zigzag width on shear-slip characteristics can also be investigated by comparison of the zigzags with different widths from Samp. 3. In addition, we can further discover the significant differences of slip characteristic parameters between shear-slip of an intact zigzag and friction and sliding on rough plane of a sheared zigzag.
Results and analysis
Shear force and the released energy recorded by press machine and AE system, respectively, were selected to analyze shear-slip characteristics during zigzags fracturing of simulated fault. Due to similar collections of AE by four same sensors in this experiment, only one sensor was necessary for analyzing the results.
Macro-characteristics of shear-slip during zigzag gouge fracturing
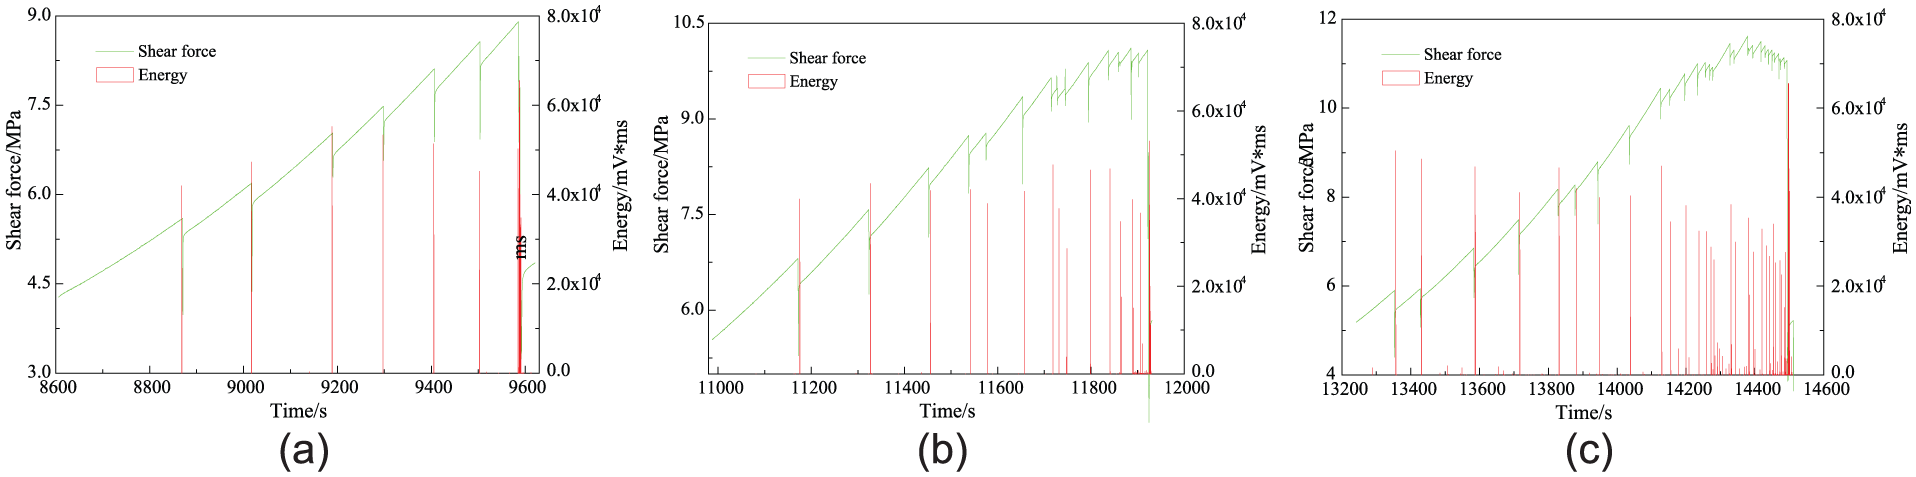
According to stress and AE measurements in the experiments, the variation curves of shear force and AE energy during zigzag fracture and failure were drawn, and then the characteristics of shear-slip were further analyzed and summarized in detail. The variations of shear force and AE energy during shear-slip of the #3 and #4 zigzags from Samp. 1 are shown in Figure 3.

Variations of shear force and AE energy during shear-slip of the (a) #3 zigzag and (b) #4 zigzag from Samp. 1.
From Figure 3, during shearing and slipping, AE energy peaks repetitively appear with the recurrent shear-slip events (force drop), and the variation tendency of AE energy is totally in agreement with that of shear force drop. Shear force and the number of shear-slip events gradually increase approaching to final failure of a zigzag. At the point of final failure, shear force reaches a peak, and simultaneously, the corresponding shear force drop is also largest.
It is obviously demonstrated that there will be many micro-fracture before the final failure of a zigzag during shear-slip, and the micro-fracture events are more intensive as it approaching to final failure. At the same time, this micro-fracture events are all accompanied with AE energy release (AE energy peak), and it indicates that AE energy peaks are strictly consistent with micro-fracture events, which have been proved in our previous study on shear-slip with triangular zigzags. 21 Compared with the previous study, this characteristic is more obvious with rectangular zigzags. Therefore, micro-fractures can be accurately identified by AE energy monitoring.
Shear-slip characteristics of zigzags with same width and different lengths
Samps. 1 and 2 were chosen to analyze the differences of shear-slip characteristics during zigzags fracturing with same width and different lengths. The zigzags on upper and lower surfaces of central block B of Samps. 1 and 2 were designed and arranged with different lengths sequentially from short to long, and the other parameters were same among these zigzags, as shown in Figure 2(a) and (b).
Different length zigzags from Samp. 1 for comparison
Total five zigzags with the lengths of 10, 20, 30, 40, and 50 mm, respectively, were elaborately sculptured on lower and upper surfaces of Samp. 1. During experiment, the shear-slip time period of each zigzag was recorded. Figure 4 shows the variation curves of shear force and AE energy during the complete shear-slip process of Samp. 1.

Variations of shear force and AE energy during the complete shear-slip process of Samp. 1.
From Figure 4, shear force peaks at the point of each zigzag's final failure gradually increase during the complete shear-slip process, while the variations of AE energy are not actually obvious, which verifies that a large number of micro-fracture events generate before final failure of a zigzag and the fracturing intensity of macro-fracture formed by convergence and coalescence of micro-fractures from each zigzag slightly varies prior to final failure. In order to reveal the relationship between shear force peak and zigzag length when zigzag failure occurs, the regression analysis between them was conducted, and a significant linear fitting was established whose correlation coefficient was 0.986 and the fitting formula was expressed as y = 0.174 x + 3.123, as shown in Figure 5.

Linear regression relationship between shear force peak and zigzag length of Samp. 1.
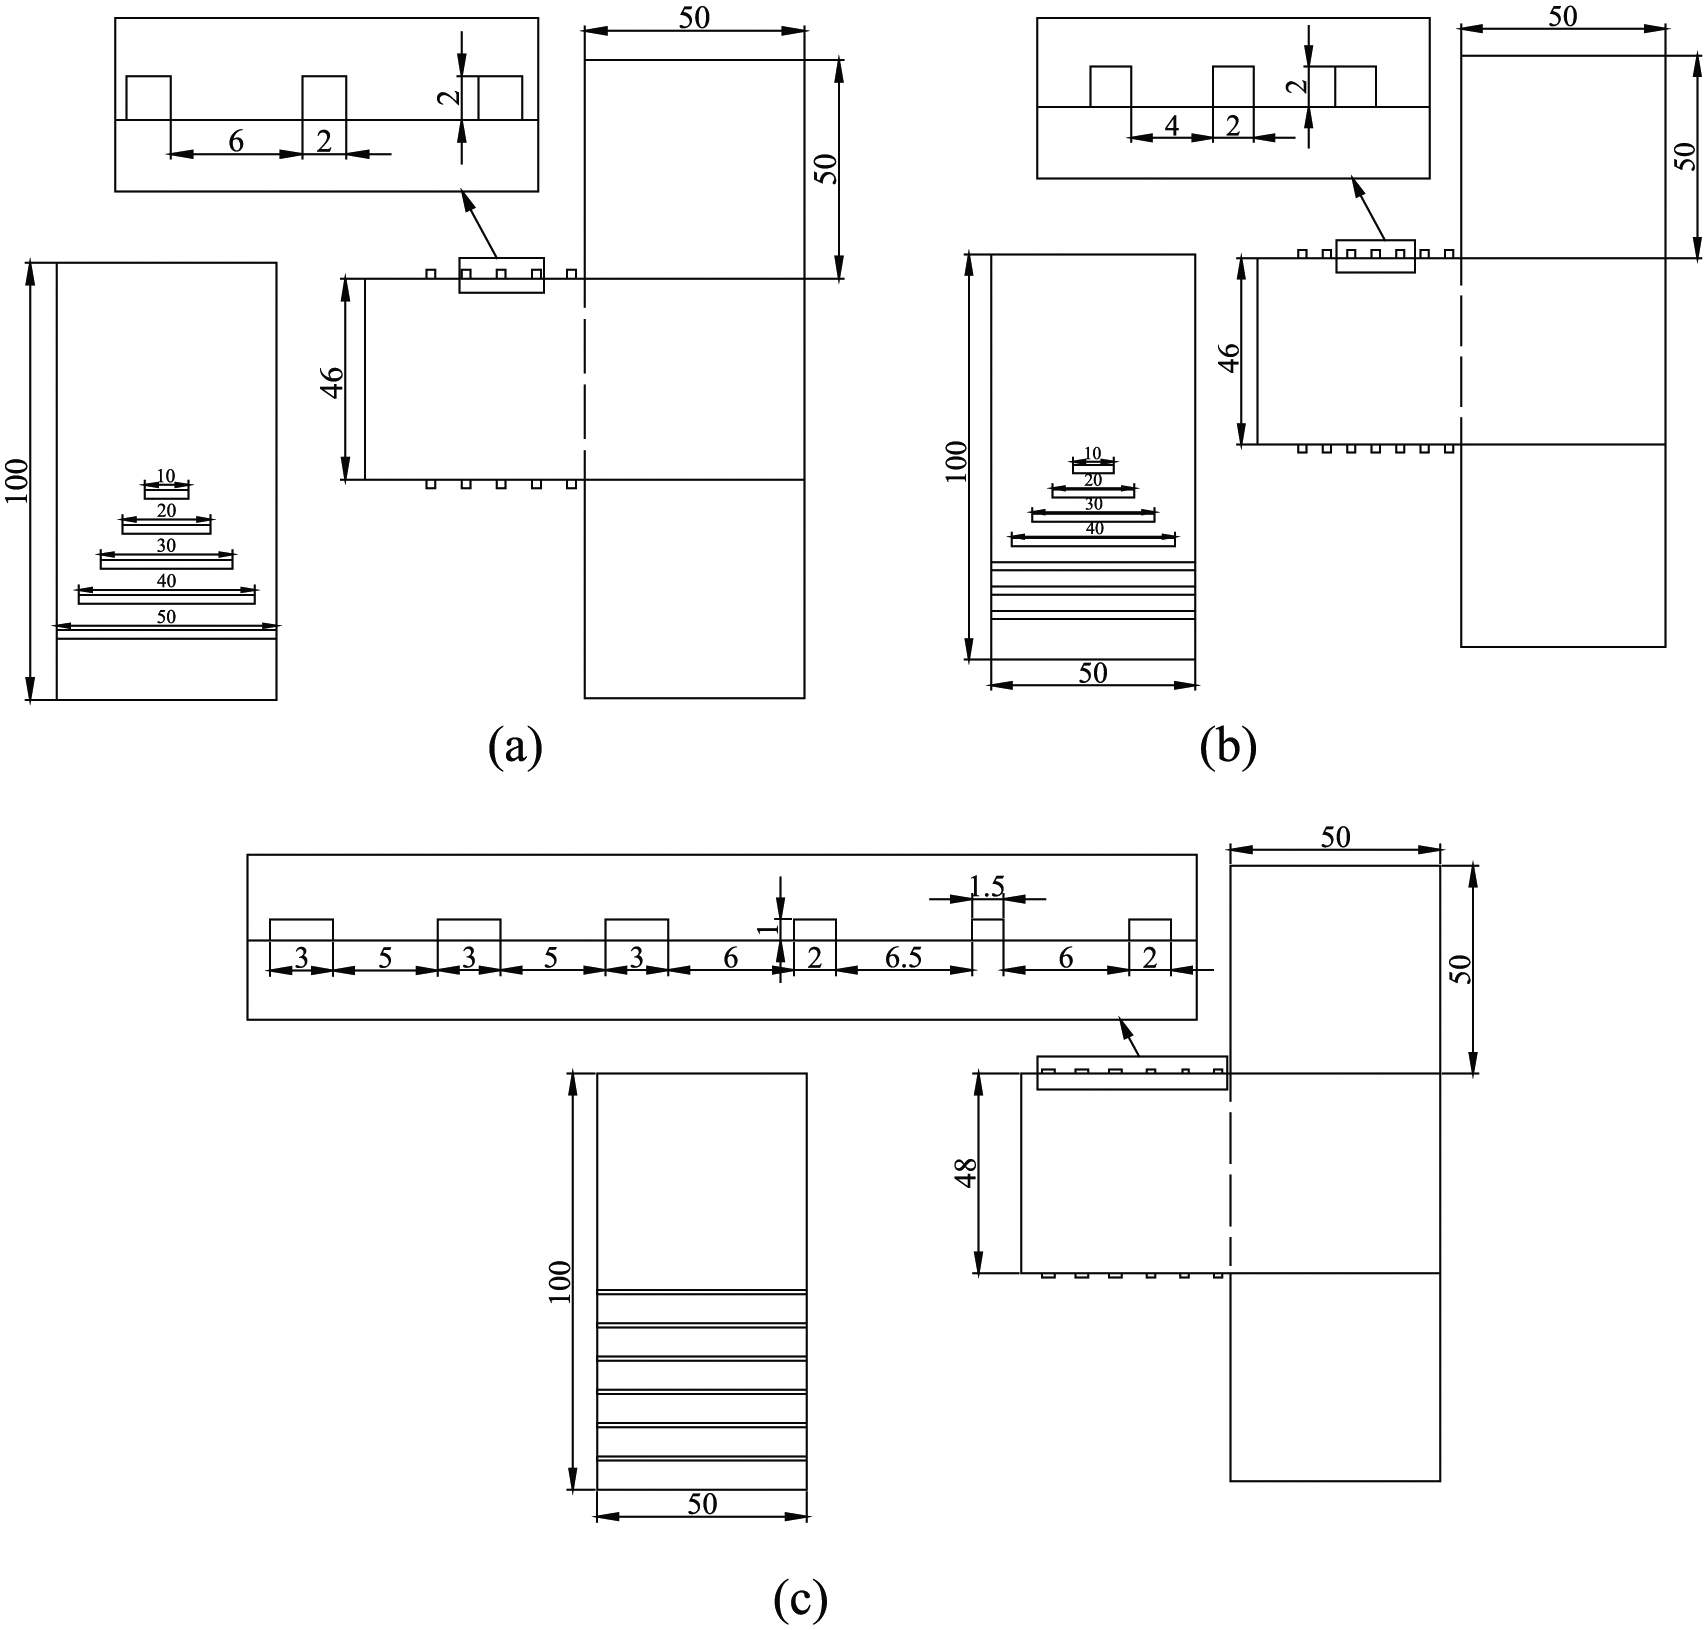
Due to shorter shear period and fewer shear-slip events of the #1 and #2 zigzags with the lengths of 10 and 20 mm, respectively, shear force and AE energy of the last three zigzags can be chosen for comparative analysis. The variation curves of shear force and AE energy during shear-slip of the #3, #4, and #5 zigzags from Samp. 1 are shown in Figure 6.
Variations of shear force and AE energy during shear-slip of the (a) #3 zigzag, (b) #4 zigzag, and (c) #5 zigzag from Samp. 1.
From Figure 6(a), the complete shear-slip period (from the first shear-slip event to the last before final failure) of the #3 zigzag is 8869–9589 s, and the duration is 720 s including six small micro-fracture events. For the #4 zigzag, the shear-slip period is 11,170–11,928 s (in Figure 6(b)), and the duration is 758 s including 14 small micro-fracture events. Moreover, the shear-slip period of the #5 zigzag is 13,352–14,501 s (in Figure 6(c)), and the duration is 1149 s including 27 small micro-fracture events.
Figure 7 shows the comparative curves of shear force drop and AE energy of each micro-fracture event from the above-mentioned three zigzags during shear-slip, and the horizontal time coordinate of each micro-fracture event is equal to its actual occurrence time minus the statistically same starting time.

Comparative curves of (a) shear force drop and (b) AE energy of the #3, #4, and #5 zigzags with different lengths from Samp. 1.
From Figure 7, shear force drop of micro-fracture events during shear-slip of the #3, #4, and #5 zigzags shows an overall trend of decrease with obvious fluctuation, while the variation trend of AE energy is unapparent. According to the calculated totalities and average values of shear force drop and AE energy, the two totalities before zigzag failure increase with the increase of zigzag length, while the changing rules of the two average values are just opposite.
Different length zigzags of Samp. 2 for comparison
There are totally seven zigzags with the lengths of 10, 20, 30, 40, 50, 50, and 50 mm elaborately sculptured on Samp. 2, respectively, and the shear-slip time period of each zigzag was recorded in the testing. Due to same length of the last three zigzags, the first five zigzags with different lengths were chosen to statistically analyze the shear-slip characteristics. Figure 8 shows the curves of shear force drop and AE energy during the complete shear-slip process of Samp. 2.
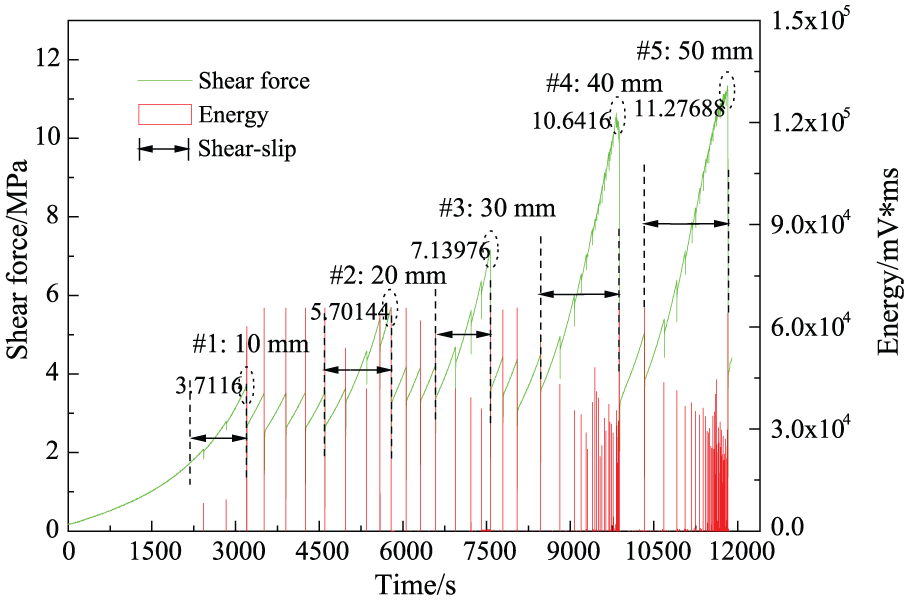
Variations of shear force and AE energy during the complete shear-slip process of Samp. 2.
From Figure 8, shear force peak of each zigzag failure gradually increases during the complete shear-slip process, while the variation of AE energy is not obvious, which is in accordance with the variation rules of Samp. 1. In addition, a significant linear fitting was revealed whose correlation coefficient was 0.966 and the fitting formula was expressed as y = 0.2 x + 1.673, as shown in Figure 9.
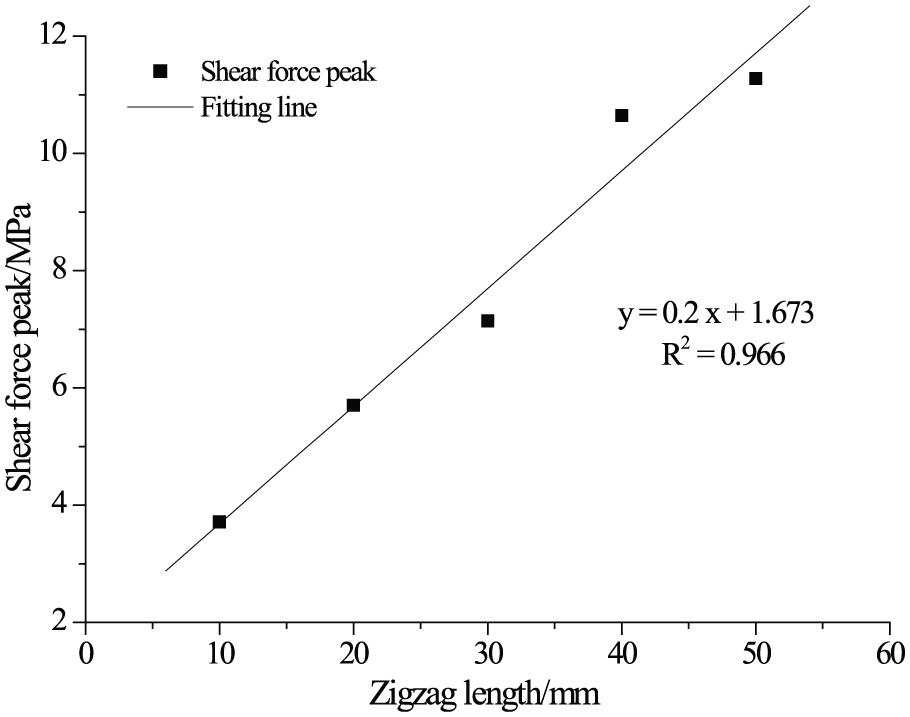
Linear regression relationship between shear force peak and zigzag length of Samp. 2.
Similarly, the #3, #4, and #5 zigzags with lengths of 30, 40, and 50 mm of Samp. 2 were chosen to comparatively analyze the shear-slip differences, and the variation curves of shear force and AE energy during shear-slip of the #3, #4, and #5 zigzags from Samp. 2 are shown in Figure 10.

Variations of shear force and AE energy during shear-slip of the (a) #3 zigzag, (b) #4 zigzag, and (c) #5 zigzag from Samp. 2.
From Figure 10(a), the complete shear-slip period (from the first shear-slip event to the last before final failure) of the #3 zigzag is 6943–7571 s, and the duration is 628 s including three small micro-fracture events. For the #4 zigzag, the shear-slip period is 8818–9880 s (in Figure 10(b)), and the duration is 1062 s including 20 small micro-fracture events. Moreover, the shear-slip period of the #5 zigzag is 10,685–11,831 s (in Figure 10(c)), and the duration is 1146 s including 40 small micro-fracture events.
Figure 11 shows the comparative curves of shear force drop and AE energy of each micro-fracture event from the three zigzags during shear-slip, and the horizontal time coordinate of each micro-fracture event is set to its actual occurrence time minus the statistically same starting time.

Comparative curves of (a) shear force drop and (b) AE energy of the #3, #4, and #5 zigzags with different lengths from Samp. 2.
From Figure 11, the variation rules of shear force drop and AE energy of Samp. 2 are same with that of Samp. 1. In summary, the following two points were obtained based on statistical analysis: (1) shear force peak at the point of each zigzag failure on a sample gradually rises with the increase of zigzag length, while the variation trend of AE energy is not obvious. In addition, there is a significant linear correlation between shear force peak and zigzag length, and (2) the duration of shear-slip increases with the increase of zigzag length, and the number of micro-fracture events approaching to final failure of a zigzag also significantly rises. Simultaneously, the two totalities of shear force drop and AE energy before zigzag failure rise with the increase of zigzag length, while the changing rules of their average values are just opposite.
Shear-slip characteristics of zigzags with same length and different widths
A total of six zigzags with same length of 50 mm and same height of 1 mm were elaborately sculptured on Samp. 3, and the width of the #1, #2, and #3 zigzags were 2, 1.5, and 2 mm, respectively, while the width of the #4, #5, and #6 zigzags were 3 mm. In addition, the shear-slip time period of each zigzag was recorded during the experiment. Based on the six zigzags, the shear-slip characteristics and AE associated with zigzag width can be comparatively analyzed.
The variation curves of shear force and AE energy during the complete shear-slip process of Samp. 3 were shown in Figure 12. As a whole, shear force peak at the point of final failure of each zigzag rises with the increase of zigzag width, while the variation of AE energy is not obvious. Taking the different widths into account, the #2, #3, and #5 zigzags with the widths of 1.5, 2, and 3 mm, respectively, were selected to comparatively analyze the shear-slip characteristics in detail. The variation curves of shear force and AE energy during shear-slip of the #2, #3, and #5 zigzags from Samp. 3 are shown in Figure 13.

Variations of shear force and AE energy during the complete shear-slip process of Samp. 3.

Variations of shear force and AE energy during shear-slip of the (a) #2 zigzag, (b) #3 zigzag, and (c) #5 zigzag from Samp. 3.
From Figure 13(a), the complete shear-slip period (from the first shear-slip event to the last before final failure) of the #2 zigzag is 7975–8797 s, and the duration is 822 s including three micro-fracture events. For the #3 zigzag, the shear-slip period is 10,439–11,580 s (in Figure 13(b)), and the duration is 1141 s including 16 micro-fracture events. Moreover, the shear-slip period of the #5 zigzag is 15,146–16,680 s (in Figure 13(c)), and the duration is 1534 s including 54 micro-fracture events.
Figure 14 shows the comparative curves of shear force drop, AE energy, and duration of each micro-fracture event from three zigzags during shear-slip, and the horizontal time coordinate of each micro-fracture event is set to its actual occurrence time minus the statistically same starting time.

Comparative curves of (a) shear force drop, (b) AE energy, and (c) duration among the #2, #3, and #5 zigzags from Samp. 3.
From Figure 14, shear force drop and average duration show an overall trend of gradual decrease with a certain level of fluctuation during shear-slip, while AE energy dramatically fluctuates. According to the statistical totalities and average values of shear force drop, AE energy, and duration, the two totalities of shear force drop and AE energy before zigzag failure rise with the increase of zigzag width, while the changing rules of three average values are just opposite. Especially, prior to final failure of a zigzag, the duration continually reduces.
Differences of characteristic parameters between shear-slip and friction process on zigzag
According to the complete shear-slip curves of Samps. 1–3, respectively, shown in Figures 4, 8, and 12, the shear-slip and friction process of the #3 zigzag of each sample were chosen to comparatively analyze the differences between shear-slip of an intact zigzag and friction on rough plane of a sheared zigzag. In the test, the shear-slip time period of each zigzag and friction time period of each rough plane between zigzags were recorded. Figure 15 shows the variation curves of shear force and AE energy during shear-slip and friction of the three zigzags from Samps. 1–3, respectively.

Variations of shear force and AE energy during friction and sliding and shear-slip of (a) the #3 zigzag of Samp. 1, (b) the #3 zigzag of Samp. 2, and (c) the #3 zigzag of Samp. 3.
From Figure 15, the friction and sliding period of the zigzag of Samp. 1 is 6752–8596 s, and that of shear-slip is 8596–9600 s. For Samp. 2, the two periods are 5800–6588 s and 6588–7571 s, respectively, and that of Samp. 3 are 8801–9740 s and 9740–11,583 s, respectively. As the duration of friction and sliding is closely related to the interval between two adjacent zigzags, only shear force and AE energy are necessary to be further analyzed. From Figures 16–18, shear force peaks characterized by more stable at the stage of friction and sliding are totally lower than that of shear-slip stage, while that of shear-slip stage shows a trend of linear increase with loading. In addition, the AE energy and duration at the stage of friction and sliding are also higher than that of shear-slip stage.

Contrast of (a) shear force drop, (b) AE energy, and (c) duration between friction and shear-slip of Samp. 1.

Contrast of (a) shear force drop, (b) AE energy, and (c) duration between friction and shear-slip of Samp. 2.

Contrast of (a) shear force drop, (b) AE energy, and (c) duration between friction and shear-slip of Samp. 3.
In summary, the significant differences between friction and shear-slip of a zigzag of simulated fault are clearly demonstrated, and thus, the friction and shear-slip stages can be apparently identified based on the variations of characteristic parameters including shear force drop, AE energy, and duration.
Discussion
Our tests suggest that shear force and corresponding AE energy correspond with micro-fracture events during zigzag gouge shear-slip, and the variations of shear force and AE energy are closely related to the length and width of zigzags of a simulated fault. In addition, the characteristic parameters including shear force, AE energy, and duration are significantly different between friction and sliding on rough plane of a sheared zigzag and shear-slip of an intact zigzag.
The stress characteristics during gouge slip have been fruitfully investigated, and all the studies indicate that stick-slip initiates when shear stress exceeds fault strength and there will be a drop on shear stress.20,22 Similarly, this conclusion has also been revealed in our work, while fault strength here means the failure strength of a zigzag, and the strength value varies from small to large with shear-slip of a zigzag until final failure, as shown in Figure 3. In addition, the failure strength rises with the increase of zigzag length and width according to Figures 8 and 12.
Different gouge granules were applied in fault-slip experiments to analyze the effects of granular gouge slip,23–28 and it was revealed that the variation of gouge granules may change the initial compaction rates and then affect the pressure dependent of those gouges. However, we elaborately designed several kinds of zigzags with different lengths and widths possibly describing a kind of natural fault gouge to analyze the shear-slip characteristics. According to sections “Shear-slip characteristics of zigzags with same width and different lengths,”“Shear-slip characteristics of zigzags with same length and different widths,” and “Differences of characteristic parameters between shear-slip and friction process on zigzag,” the significant differences of shear-slip characteristic parameters mainly including shear force, AE energy, and duration were discovered by shearing the zigzags with different lengths and widths, as well as the differences between friction and sliding on rough plane of a sheared zigzag and shear-slip of an intact zigzag.
The results from our experiments may reveal the characteristics of stress and energy under different conditions of simulated fault gouges and provide some basis for verifying the slip stages and precursors of fault instability. Unavoidably, there are still some defects on the experimental results due to the tiny processing error of zigzags on simulated fault samples, such as Figure 12, in which shear force peak of the last zigzag is obviously larger than that of two adjacent zigzags in despite of same width and loading conditions during shear-slip. In addition, more parameters including slip displacement should be recorded and analyzed in future research about shear-slip characteristics of a simulated fault with zigzag-type gouge. Simultaneously, the work may provide some explanations for rockbursts induced by geological structure instability. 29
Conclusion
Micro-fracture events will generate before completely failure of a zigzag with shear-slip, and the micro-fracture events are more intensive as it approaching to final failure. In addition, micro-fracture events can be accurately identified by AE energy monitoring.
Shear force peak at the point of each zigzag failure on a sample gradually rises with the increase of zigzag length, and there is a significant linear correlation between shear force peak and zigzag length, while the variation trend of AE energy is not obvious. In addition, with the increase of zigzag length, the number of micro-fracture events before final failure of a zigzag significantly rises. Simultaneously, the two totalities of shear force drop and AE energy before zigzag failure also increase with the increase of zigzag length, while the changing rules of their average values are just opposite.
Two totalities of shear force drop and AE energy before zigzag failure rise with the increase of zigzag width, while the changing rules of the two average values are opposite. Especially, prior to final failure of a zigzag, the duration continually reduces.
The friction and sliding, and shear-slip stages of a fault can be apparently identified based on the variations including shear force drop, AE energy, and duration. Shear force peaks characterized by more stable at the stage of friction and sliding are totally lower than that of shear-slip stage, while that of shear-slip stage shows a trend of linear increase with loading. In addition, the AE energy and duration at the stage of friction and sliding are also higher than that of shear-slip stage.
Footnotes
Academic Editor: Longjun Dong
Declaration of conflicting interests
The author(s) declared no potential conflicts of interest with respect to the research, authorship, and/or publication of this article.
Funding
The author(s) disclosed receipt of the following financial support for the research, authorship, and/or publication of this article: The authors gratefully wish to acknowledge the collaborative funding support from the National Natural Science Foundation of China (51574225), the Fundamental Research Funds for the Central Universities (YC150001), and a Project Funded by the Priority Academic Program Development of Jiangsu Higher Education Institutions (PAPD).