
Abstract
Train-induced vibrations will undoubtedly influence the stability of slopes near railway lines. To monitor the effects of such vibrations on slope stability, a wirelessly networked vibration test system was established, which included wirelessly networked vibration meters, high-precision and high-speed three-dimensional sensors and a remote wirelessly networked data server system. This system represents the first attempt to monitor the effects of train-induced vibrations on the stability of slopes in China. It enables real-time and long-distance monitoring by means of remote transmission with a low cost and high efficiency. The duration, frequency, amplitude, peak acceleration and peak particle velocity were adopted as measures for evaluating the influence of train vibrations. Simultaneously, we used additional monitoring technologies to verify the conclusions of the wirelessly networked vibration test system. The monitoring results indicated that the peak particle velocity was much higher near the track and gradually decreased with increasing distance. When the distance between the measurement point and the road axis was 12 m (H = 0 m), the maximal peak particle velocity was 0.4 mm/s, which remained below the maximum safe value.
Keywords
Introduction
With the development of China’s transportation infrastructure and the promotion of operational safety awareness, research on stability and deformation prediction for slopes subjected to micro-quakes has aroused interest among scholars. Vibrations from passing trains will lead to damage to the rock mass that will undoubtedly affect the stability of nearby slopes. Thus, it is important to monitor the influence of the vibrations from passing trains. 1 The stability of rock slopes subjected to micro-seismic activity has been previously monitored by various researchers. In a previous study by our group, Xu 2 successfully conducted micro-seismic monitoring on the left-bank slope of the Jinping first-stage hydropower station. Through real-time monitoring and analysis of the left-bank slope stability, we identified potentially hazardous regions. Train-induced vibrations have also been monitored in the Chawu segment of the Datong–Qinhuangdao railway by Meng, 3 and the characteristics of the train-induced vibrations were analysed and compared with those of blasting vibrations. By analysing stress data, He 4 monitored the reinforcement effect of pre-stressed anchor cables and predicted their deformation tendency to ensure the safe production of coal. Degrande and Schillemans 5 measured free field vibrations and track responses during the passage of a high-speed train. These experimental data can be used to validate numerical prediction models for train-induced vibrations. Kouroussis et al. 6 presented an overview of the most common monitoring techniques, compared them with a modern approach based on the use of optical fibres and presented an in-depth discussion of the evolution of numerical models. Hanif et al. 7 explored the influence of vibration loads on rock mass structures and slope stability in Xiaolongtan. They analysed the main stresses in the horizontal and vertical directions and revealed the superposition effect of the stress waves. Kouroussis et al. 8 combined traditional and modern theory and used a range of numerical analyses and experimental results to conduct a broad analysis of the effects of vehicle characteristics on ground- and track-borne vibrations from railways.
However, the research on train-induced vibrations discussed above has primarily relied on traditional monitoring methods, in which the tasks of cable arrangement and data collection are tedious and time-consuming. With the development of modern monitoring technology, wireless sensor systems have been widely applied for the vibration monitoring of bridges,9–11 buildings 12 and mines. 13 However, such systems have rarely been applied for monitoring train-induced vibrations on rock slopes. On 24 November 2014, a landslide caused a train to derail, and 12 carriages fell into the Han River. The accident occurred on the Xiang–Yu train line, which is located only 1 km away from the present monitoring points. Train-induced vibrations are one of the most critical factors influencing the occurrence of landslides. Once a landslide has occurred, it can cause significant losses.
In the research presented in this article, a wirelessly networked vibration test system (WNVTS) was established, and the train-induced vibration monitoring of an existing rock slope was conducted in Ankang, China. The monitoring data were transmitted in real time over a 3G wireless local area network (WLAN), and the instrument was also remotely controlled over the network. Thus, the tasks of cable arrangement and data collection were greatly simplified, and the speed at which the monitoring information could be obtained was considerably improved.
The WNVTS
The proposed WNVTS consists of a number of blasting vibration monitoring systems (TC-4850N; Figure 1), a signal transmission system, a data processing system and an auxiliary measuring system. The TC-4850N system is produced by the Chinese Academic of Sciences, Chengdu, and each system consists of a high-precision and high-speed three-dimensional (3D) sensor and a wirelessly networked vibration meter. The signal transmission system consists of wireless high-speed relays, a wireless data relay station and a public network server. 14 The data processing system consists of blasting vibration telemetry software running on a host computer, PDA or smartphone. The auxiliary measuring system consists of a set of multi-point extensometers (DDWXR-5002) and strain gauges (YBJ-4060). All instruments are powered by solar energy (Figure 2). The operating principle of the WNVTS is illustrated in Figure 3.

The TC-4850N vibration monitoring system.

The power supply system for the instrument.

The operating principle of the WNVTS.
The wireless data transmission in the monitoring system is performed in point-to-multipoint mode. Each TC-4850N system supports two different addresses, 15 which can be configured as ‘master’ and ‘slave’ modules. The master module connects to the computer, and the slave module connects to the TC-4850N. Each slave module has a unique ID. Thus, each master module can access data from several different slave modules, and the user can control the condition of the apparatus and analyse the collected data using the computer. After set-up, the monitoring system can automatically record and transfer dynamic waveforms throughout the entire passage of a train. The data transmission is not limited by time or distance, as data can be received from anywhere at any time as long as the host device can connect to the Internet.
Methodology
Description of the studied slope
The slope is located on the existing Xiang-Yu train line passing through the city of Ankang in Shaanxi Province. The monitoring range is 100 m. The slope along the railway consists of strongly weathered mica-quartzose schist. At the toe of the slope, the rock mass is an over-broken, soft-hard interphase with a joint fissure.
Monitoring indexes and evaluation criteria
The influence of the vibrations induced by passing trains was monitored using the strain gauges, multi-point extensometers and vibration meters. 16 The vibrational influence on the concrete structure was monitored using strain gauges that were mounted on the sheet-pile wall, and the data were collected by a CWM80X system. 17 For this project, the safety value of the concrete strain is 5000 µε, and the slope deformation was monitored using multi-point extensometers. 18 The particle velocity induced by the vibrations from passing trains was monitored using the TC-4850N systems.
Instrumentation
Vibration meters were buried at depths of 0, 2, 5 and 10 m. Each multi-point extensometer was embedded in a hole measuring approximately 80 mm in diameter and 6 m deep. Then, each hole was grouted from the bottom to 20 cm below the top of the protective tube. Four multi-point extensometers were thus buried at depths of 2, 5, 10 and 15 m. The strain gauges were mounted on the surface of the slope at heights of 3, 4 and 6 m from the railway. 16 The layout of the vibration measurement points is shown in Figure 4.

Layout of vibration measurement points.
Data pre-processing
To obtain more effective vibration signals, the monitoring signals must be processed. This signal pre-processing includes the following three steps: removal of the direct current (DC) signal component, denoising and filtering.19,20
DC removal
The DC signal component, which should be removed from the original signal, was estimated using the mathematical expectation value calculated from the recorded signals.
Suppose that the vibration signals are as follows

The mean value is determined as follows

The signal sequence after the removal of the mean value is as follows

where N is the number of sampled data points.
Denoising
The signal should also be denoised to decrease the influence of interference and smooth the vibration curve. 21 In this study, the vibration signal was processed using the averaging method, which is based on the following formula

where xi are the sampled data, yi are the results after denoising, m is the number of data points, 2N + 1 is the number of averaging points and hn are the weighted averaging factors. The weighted averaging factors should satisfy the following equation


For the five-point weighted average (N = 2), we define

Thus, we obtain the following formulas

Digital filtering
A digital filter can be used to remove noise signals or false signals, improve the signal-to-noise ratio, reduce interference and separate different frequency components. Frequency-domain analysis is typically adopted for digital filtering. 22 The expression used in the frequency-domain analysis method is

where X is the discrete Fourier transform of the input signal x and H is the frequency response of the filter function. The variable fu is defined as the upper-limit frequency, fd is defined as the lower-limit frequency and

According to equations (9) and (10), the interference signal can be filtered by establishing a MATLAB program.
Analysis of monitoring results
The vertical direction was defined as the X-direction, and the horizontal direction was defined as the Y-direction.
Analysis of strain signals
The variation in the strain at the measurement points versus time during the passage of a train is shown in Figure 5.
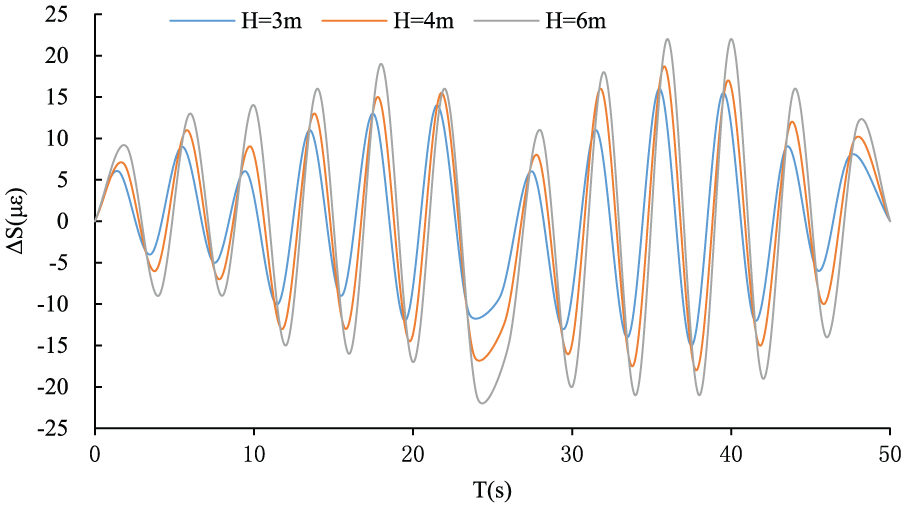
The variation in the strain from the measuring points.
The results show that the maximum strain variation occurred at Point C (Figure 4) and that the surface strain distributions were different before and after the passage of the train. The surface strain varied between −25 and 25 µε, which was within the allowable variation. In addition, the strain was more sensitive to vibrations at higher positions. In summary, all surface strains remained within the allowable range, and thus, the structure of the slope was found to be safe.
Analysis of deformation signals
Each multi-point extensometer consists of three displacement sensors. The deformation monitoring results are shown in Table 1. The peak deformation is the maximum value among all data measured over 1 month. As Figure 6 shows, the maximal deformation occurred when the train was passing by the slope. Once the train had passed, the deformation returned to normal.
Monitoring results of deformation.


Deformation at the measurement points.
The results show that the deformation increases with increasing height. At the same measurement point, there is also an obvious variation in the deformation with depth, but the law governing that variation is more complicated.
Analysis of vibration signals
The monitoring results show that the peak particle velocity (PPV) in the Y-direction was less than that in the X-direction but was of the same order of magnitude. 23 Therefore, this article considers only the PPV in the direction perpendicular to the horizontal plane (the X-direction). The vibrational waves that are generated by the interaction between the wheels and the track during the passage of a train will propagate to the soil and the surrounding areas through the roadbed, which can induce secondary vibrations on a nearby slope. 24 The vibration velocities at Point D (H = 0 m) during the first 2 s of train passage are shown in Figure 7. The PPV monitoring results (for a train passing at a speed of 95 km/h) are shown in Table 2.

The vibration velocity of D point in 2 s (H = 0 m).
PPV monitoring results.
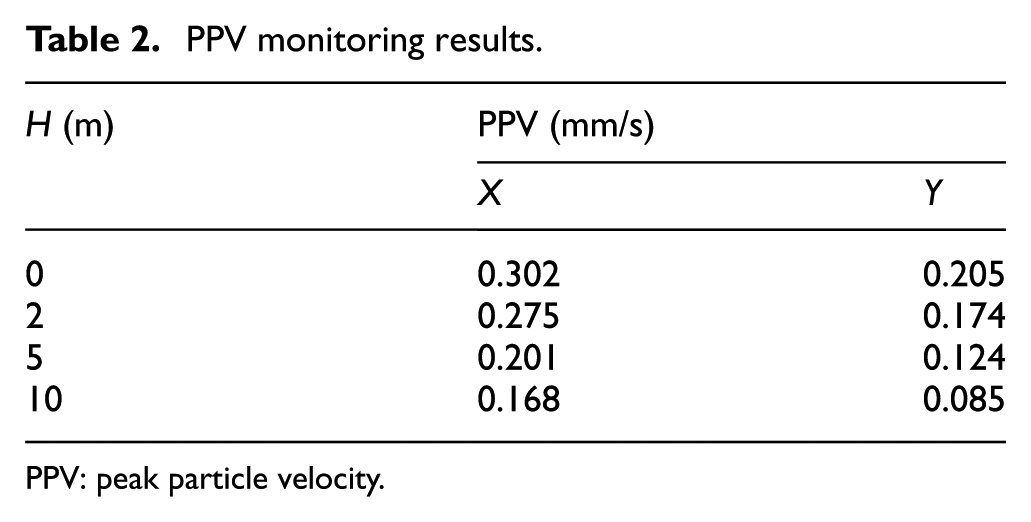
PPV: peak particle velocity.
Based on the PPV monitoring results collected over 1 month, the variations in the PPV versus the speed of the train at all measured heights are shown in Figure 8.

The PPV of measuring points.
Figure 8 and Table 2 show that the PPV decreased from 0.302 mm/s (H = 0 m, V = 95 km/h) to 0.168 mm/s (H = 10 m, V = 95 km/h) as the distance between the measurement point and the road axis increased. There was a positive correlation between the vibration intensity and the vehicle speed. The vibration intensity decreased with increasing distance, indicating that as the earth transmitted the vibrations, it exerted a damping effect. 7
Conclusion
The WNVTS was established to monitor the slope deformation, the variation in the internal stress and the PPV in an existing slope adjacent to a railway track. The developed system incorporates remote monitoring, wireless data transmission and information management. This system represents the first attempt to monitor the effects of train-induced vibrations on the stability of a railway-adjacent slope in China. The vibrations that are generated by the interaction between the wheels and the track during the passage of a train will propagate to the soil and the surrounding areas through the roadbed, which can induce secondary vibrations on the slope. According to the monitoring results and related data from the literature, the basic characteristics of railway vibration for the studied slope can be summarised as follows:
The vibrations generated by the passage of a train are continuous and have a duration that is related to the speed and length of the vehicle.
The vibration intensity is proportional to the vehicle’s weight and speed.
The earth has a damping effect on the vibrations, which becomes more obvious as the waves travel farther from the track.
The PPV in the horizontal direction is of the same order of magnitude as that in the vertical direction.
The earth has a filtering effect on high-frequency vibrations. The amplitudes of vibrations at all frequencies are attenuated with an increasing propagation distance, but low-frequency vibrations are less strongly attenuated.
The maximal observed PPV was less than 0.4 mm/s, which was below the maximum safe value, but this does not necessarily mean that the slope is safe. This is because of two aspects of the effects exerted by train-induced vibrations on the slope stability. The first is related to the cumulative nature of the induced effects (which has been ignored in this work). The second is the fact that the total displacement is related not only to the vibration intensity but also to the number of ongoing vibrations. Therefore, it is necessary to continue vibration monitoring at the studied site.
Footnotes
Declaration of conflicting interests
The author(s) declared no potential conflicts of interest with respect to the research, authorship, and/or publication of this article.
Funding
The author(s) disclosed receipt of the following financial support for the research, authorship, and/or publication of this article: This work was partially supported by the National Natural Science Foundation of China (grant no. 41272285), the Shaanxi Postdoctoral Fund and the Special Fund for Basic Scientific Research of Central Colleges of Chang’an University (nos 2014G2260009 and 310821161028).