
Abstract
In the changing environment of the Internet of Things, optimal energy management in smart spaces requires intelligent and reliable energy-aware-based context sensing and technologies that are capable of recognizing and analyzing the big-data user pattern. In this article, we propose an intelligent and reliable standby power management system. The system uses physical and virtual user behavioral pattern analysis based on energy-aware management to cut-off the standby power of office appliances in the office environment. We propose a two-step priority power-aware method. The first step entails physical perception and management that controls devices through user recognition and device relationship scenarios. The second step is virtual perception and management that controls the standby power by collecting user behavioral patterns and performs an analysis based on a rule mechanism. The proposed system was applied to three locations (offices A, B, and C) in the university test-bed. Power consumption was reduced to 23% of the original consumption through the elimination of unnecessary standby power consumption.
Keywords
Introduction
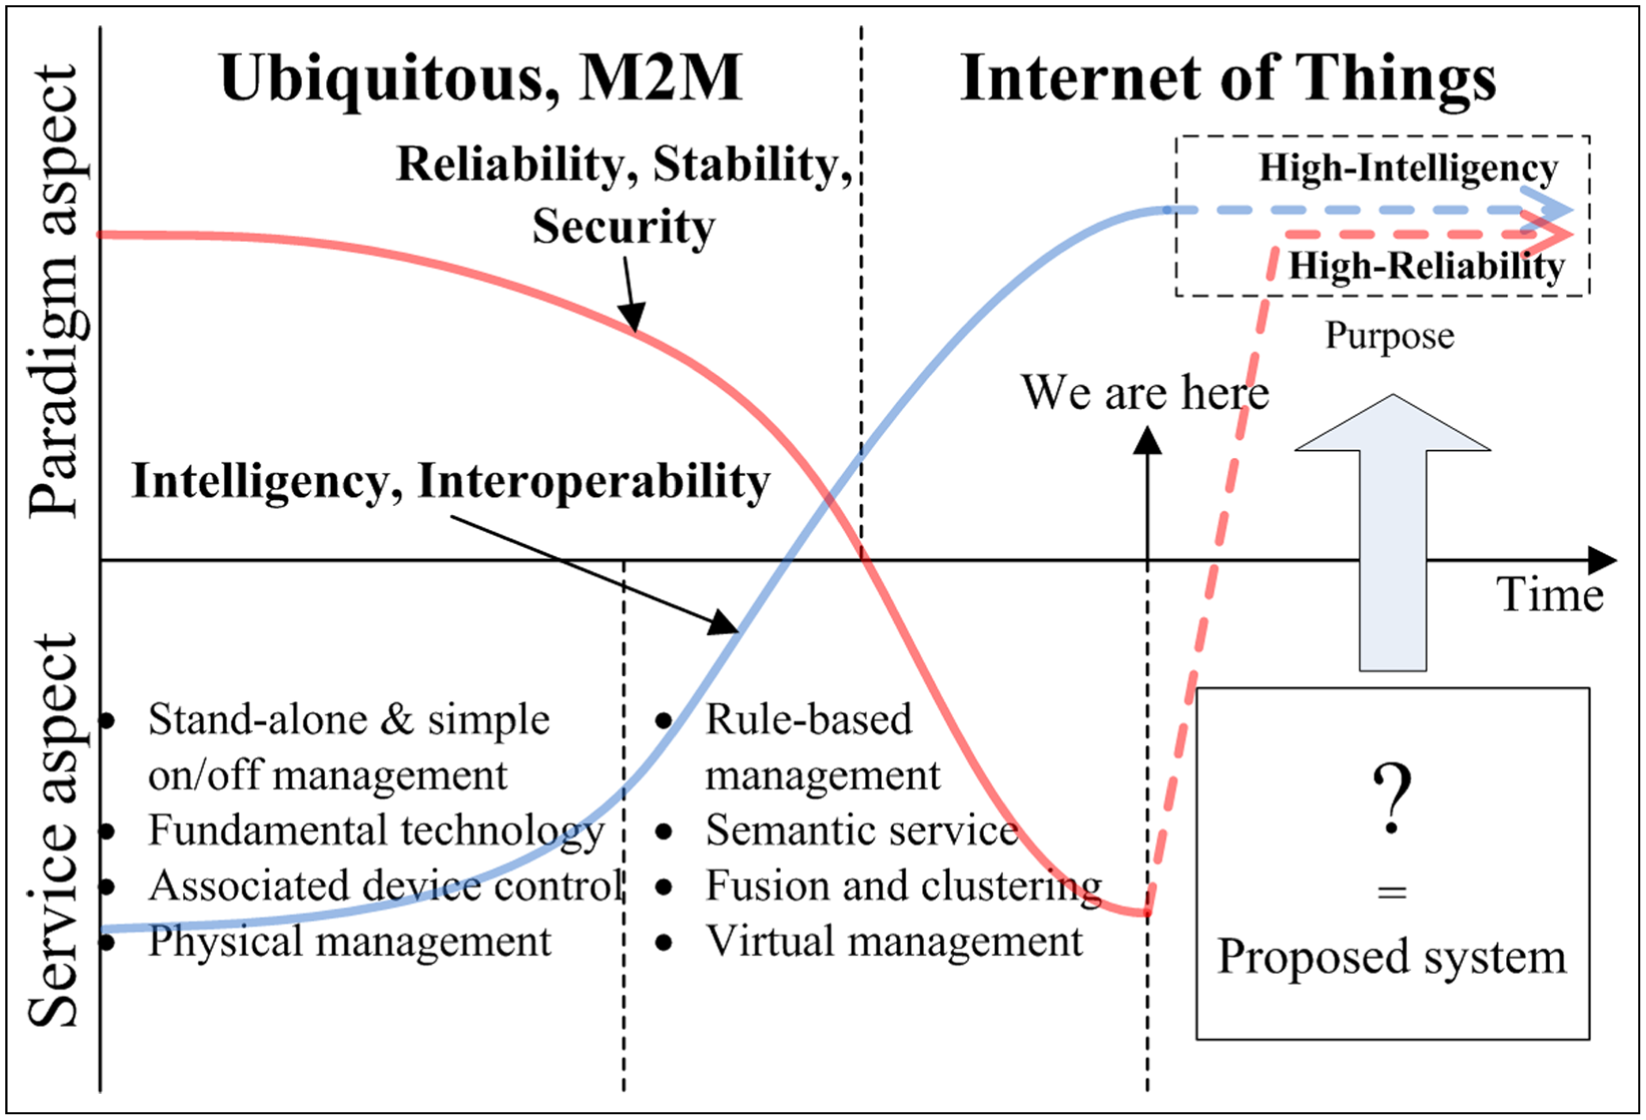
In the fast-changing environment of the Internet of Things (IoT), 1 intelligent and reliable energy-aware context-sensing technologies and big-data user pattern cognition and pattern analysis are required to provide a more intelligent and efficient service to users. 2 IoT systems should be able to provide a more accurate and convenient environment for users through the intelligent analysis of energy-aware and big-data technologies for intelligence and the reliable collaboration of sensor devices in the smart space. 3 Figure 1 shows the paradigm shift resulting from current IoT technology. Past IoT technology was developed based on ubiquitous computing and M2M, 4 which was only a source technology for stand-alone systems and network devices based on a simple on/off system. Although this core technology increases the reliability and stability of the device, it does not increase the interoperability and intelligence of the system. However, as communication technologies and IoT devices have evolved,5–7 it is reasonable that intelligent services that are semantic and convergent could increase the interoperability and intelligence between devices compared to the past.7–10
Paradigm shift of Internet of Things in smart spaces.
Although there are many papers and related technologies, 11 prototype frameworks and rule-based technologies in the market do not guarantee stability and security.12–15 User pattern recognition-based power management systems in existing buildings and the smart environment are currently simple on/off control systems that control each device separately based on the power plug.16,17 In addition, these systems inefficiently control the energy usage because of the complex control environment and the difficulty associated with predicting the behavioral patterns of users. Typically, the systems are operated by user-controlled timers that are directly set by the users. These settings are based on the observation of inconsistent user behavioral patterns and complicated by the difficulty of predicting irregular events. We propose to solve the two abovementioned problems by developing an energy-aware-based office standby–power management system (OS-PMS) through the two-step priority of physical and virtual user habitual pattern analysis (Table 1).
Current system versus proposed system.

IoT: Internet of Things.
Figure 2 shows our concept of the proposed system. The objective of this work is the management of power plugs intended to block off standby power and reduce power consumption in the office. This is accomplished by applying a two-step procedure to achieve priority management based on user habitual analysis and power plug control. The two-step priority is motivated by the inability of current power monitoring systems (PMSs) to provide an ideal power-aware-based intelligent service in the complex environment of smart spaces. Provision of a more accurate rule-based virtual management service first requires a narrowing in the scope of user recognition through the perception of a physical event in order to provide a concrete context factor. The system detects the first event, namely, that of users turning on a light switch and personal computer (PC), and it detects the presence of a person through physical perception and management by PMS; only the associated standby power management system (S-PMS) is controlled by user A. The next step involves the virtual perception and management that blocks the standby power of the office appliances (fax, copier, and coffee makers). This is accomplished by the S-PMS based on the analysis of user power patterns and rules predicted from historic user power consumption. 12

Concept of the proposed system.
Rule-based intelligent office environments first require the system to detect whether an office is occupied by anyone. 18 The current system detects the occupants using a motion sensor or ultrasonic sensor; however, in this system, it detects the occupants by the operation of a light switch and PC power state (Figures 4 and 5). The state of the light switch determines office occupancy, and if user A’s PC is detected to be in the “on” state, based on its power consumption by PMS, the server instructs the S-PMS to switch to the “on” state by associated device control scenarios. In other words, it controls the office appliances that are only directly associated with user A. Once the time comes for rule-based management, at this time, server controls S-PMS by rule-based management. In this case, a process is required that analyzes and stores the power consumption data of the office appliances to the database (DB) for some defined period for use in the application of the rule. In this work, 23% of the power consumption is decreased through the application of the proposed system to offices A, B, and C for 7 days when compared to the power consumption of the previous 7 days.
Problems associated with current systems are as follows:
Technical imbalance. Current technologies are being developed from stand-alone-based fundamental technology into a state-of-the-art intelligent semantic technology for energy efficiency. It incurs technical imbalance problem in a transition period.
Unreliability. An intelligent semantic technology for energy efficiency does not give a reliable service because of the complex control environment and difficulty of predicting habitual behaviors of users.
Benefits and contributions of the proposed system are as follows:
Energy efficiency. Proposed system provides efficient energy management by cutting off the standby power of office appliances.
Reliability. Proposed system is a virtual management system (rule-based management) based on a physical system (associated device control); therefore, it is possible to accept unpredictable physical user events in the virtual management period.
Intelligence. Proposed system can provide intelligent and automatic management of standby power consumption through close inter-working between the physical and virtual management.
This article is organized as follows. Section “Related works” presents the related works, and section “Energy-aware-based OS-PMS” presents the total configuration and architecture of the proposed system. In section “System design and implementation,” the prototype of the proposed system is applied to a test-bed in the actual offices A, B, and C. Section “Results of implementation” provides an analysis of the power consumption results and they show how much the power consumption decreased. Section “Conclusion” concludes the article and presents the prospects.
Related works
In this section, we discuss the literature on the proposed system. This section is divided into three subjects: first is IoT-based management systems, second is IoT-based standby power management technologies, and third is standby power management by user prediction.
IoT-based energy management system
S Tompros et al. 19 proposed a novel network architecture, generally applicable to domestic appliances, to solve the energy waste problem in the home. The proposed system performs real-time estimation of the energy consumption without smart metering devices, control of domestic appliance energy use by user-defined limits, or autonomous management of standby devices targeting minimal energy consumption. The difference with our proposed approach is that it deals with the whole issue of energy consumption when the system is not in standby power.
IoT-based standby power management
A review of IoT-based standby power management technologies reveals the following. G Zhang et al. 20 proposed the IoT-based energy-saving application in a building by analyzing various energy-saving operations for avoiding energy waste caused by personal carelessness and standby power. Collotta and Pau 21 proposed an energy management system for smart homes by addressing the impact of standby appliances and high-power rating loads in peak hours on the energy consumption charges to consumers. J Heo et al. 22 presented a control mechanism for standby power reduction using IEEE 802.15.4–based ZigBee protocol and verified and implemented reliability and reduction effect of standby power in a similar living pattern. J Han et al. 23 proposed a home energy management system (HEMS) to reduce power consumption by an easily controllable home device. It reduces the waiting time and turns off the home device and the power outlet simultaneously, so it actively reduces the standby power. The proposed HEMS provides an easy way to add, delete, and move home devices to other power outlets. These papers all deal with standby power; however, these systems are designed for user-centric convenience and not for system reliability.
Standby power management by user prediction
Publications involving standby power management by user prediction–based literatures include S Lee et al., 24 who proposed an automatic standby power reduction system based on user-context profiling and appliance usage by predicting the probabilities of future appliance usage. It predicts the probabilities of future appliance usage by conditional probability using Bayes’ theorem and showed that power consumption in standby mode can be reduced in a real test-bed.
There are many more published articles involving standby power, energy management in IoT environments, and energy reduction system by user habitual prediction, but these systems just increase the energy efficiency, QoS, and user satisfaction, and it could not control the energy ideally because they could not cover many errors in the complex control environment and difficulty of predicting behavioral patterns of users. So, in this article, we propose a stable and intelligent energy management system based on reliable technology for energy efficiency by the fusion of physical and virtual management to address these three factors: the energy efficiency, reliability, and intelligence.
Energy-aware-based OS-PMS
Priority step 1 (PS1): physical management
S-PMS manages according to user occupancy and device relationship. Figure 3 illustrates the proposed system’s configuration and architecture. User 1 first came into the office and turned on the light by controlling the smart light switch (SLS). In addition, user 1 turned on the PC to use the computer; then, PMS checked the PC’s power and sent the PC’s current state to the server. Whereupon the server turned on the S-PMS 1–2 related with user PC 1 and S-PMS primary controls the office appliance loads. At that time, the on/off state sensing units SLS and PMS send the current state to the central server; the server checks the user access in the office, and it determines that the person who entered is user 1 when PC 1 is turned on. The server controls the S-PMS through the associated device control scenarios by turning on the S-PMS related to user 1 and provides the first service by allowing only permitted devices associated with user 1 to be available.

System configuration and architecture.
Priority step 2 (PS2): virtual management
S-PMS manages through past user habitual behavior analysis and rule application. After performing the first PS1, the user who came into the office uses the appliances in connection with the S-PMS and the central server controls the S-PMS after a certain period by the rule-based management through collecting the past using the schedule of the S-PMS. The server requires a process for collecting the power data of office appliances for two weeks in advance, generating a schedule and rule by analyzing the collected user power usage pattern. The server applies the schedule and rules to automatically block the standby power by turning on/off the S-PMS.
Central server (user pattern analysis and rule-based management server)
The proposed system comprises three components (Figure 4): the central server, gateway, and IoT sensors. The central server consists of five factors, namely, the service manager (SM), power analysis manager (PAM), context manager (CM), network manager (NM), and DB.
SM—the proposed system consists of two management factors, that is, physical management and virtual management. The SM enables associated device control by physical management and rule-based management by virtual management.
PAM—the PAM provides power analysis and user pattern analysis for rule-based management.
CM—the CM determines the present situation through the analysis of context information. The CM has a rule that gathers the contexts using the information gathering/classification learning manager based on a context model. It has a rule that collects and classifies the information. It also learns through analyzing past data.
NM—the NM module manages ZigBee and Ethernet communication between the IoT sensors and gateway.
Gateway—the Gateway collects the current states of the SLS, PMS, and S-PMS to manage the office appliances.
IoT sensor—the IoT sensors are SLS, PMS, and S-PMS. They are sensing devices that detect the current light condition and power consumption of office appliances. It sends the data to the gateway by ZigBee wireless communication.

Central server architecture.
System design and implementation
Overall system configuration
Figure 5 shows the overall hardware configuration of the proposed system. The central server is connected to the gateway by Ethernet. The gateway is connected with an SLS, PMS, and an S-PMS based on ZigBee. The SLS is a ZigBee-based intelligent smart switch and is accessible by remote control. The current state of the light is sent to the server at the time when the user turns on/off the SLS and indicates whether the office is currently occupied. The PMS is only connected to the user’s PC. When the user turns on the PC, the PMS sends the PC power usage information to the server, thus allowing the PC that is running and the user who is using the PC to be determined. S-PMS enables remote control from the server by ZigBee and is directly connected to each office appliance to monitor the power usage information of the device and block the standby power.

Hardware configuration of the proposed system.
System test-bed
Figure 6 shows a test-bed of the proposed system installed in offices A, B, and C, Chung-Ang University in Korea. The test-bed contains four types of system control units (gateway, PMS, S-PMS, and SLS) and five office appliances (printer, fax, copier, paper shredder, and coffee maker) as represented in Table 2. We also attempted to include an air-conditioner appliance in this experiment; however, it was excluded from the test-bed because of the installation difficulties and constraints of the control conditions, despite the air-conditioner’s standby power of 5.8 W.

Test-bed of the proposed system: (a) office A, (b) office B, and (c) office C.
Number of system control units and office appliances.

PMS: power management system; S-PMS: standby power management system; SLS: smart light switch.
Each office has one gateway and SLS. The PMS is installed in each user’s PC to monitor the PC’s on/off state. In addition, S-PMS is installed in each office appliance to monitor and control power consumption. Table 2 shows the status of system control devices and office appliances installed in each office A, B, and C.
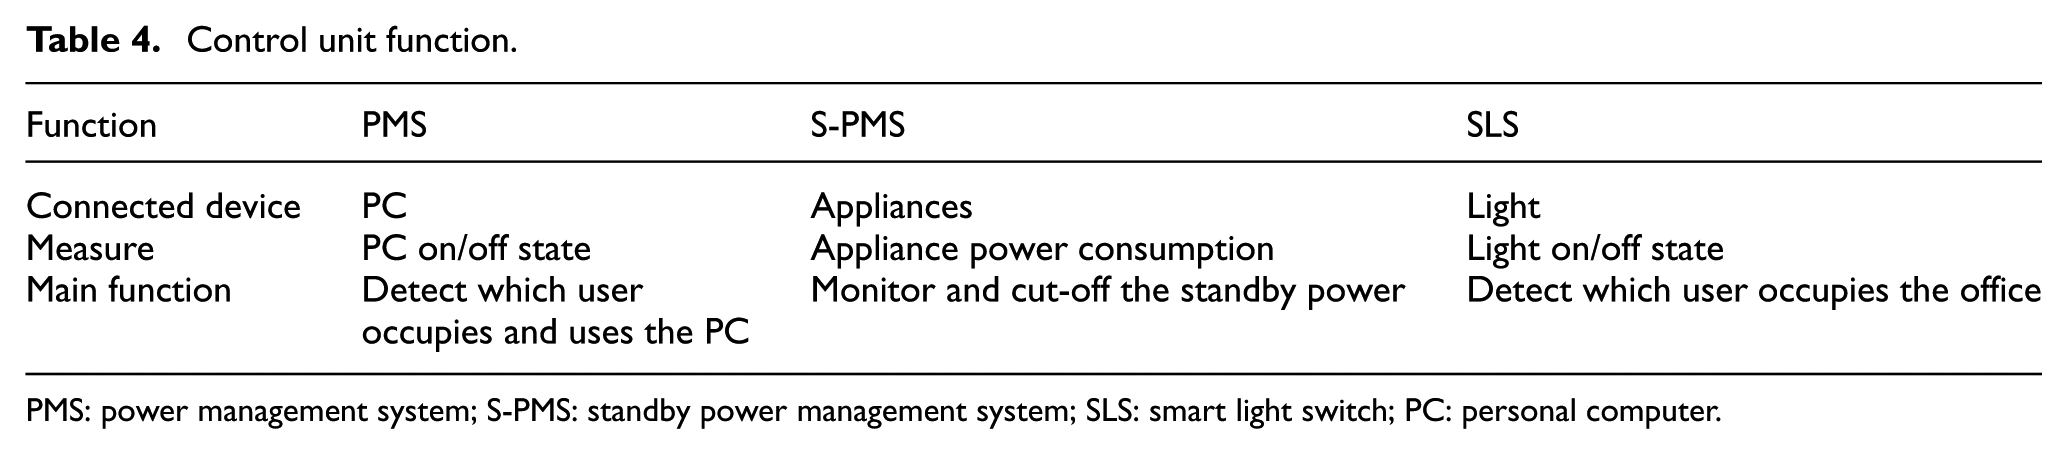
Table 3 shows the prototype and detailed specifications for the system control device. The gateway is an Ethernet- and ZigBee-based communication unit for state monitoring and remote control between the server and SLS, PMS, or S-PMS. Networking can be automated through a home area network interface and web service interface. The PMS and S-PMS are ZigBee-based wireless communication remote control units for real-time power consumption monitoring. The difference between PMS and S-PMS is that the PMS is the only real-time power monitoring unit connected to the user PC; however, S-PMS is a power monitoring and power control unit connected to office appliances. SLS is a touch pad based on the on/off switch of the light and is a remote control unit by ZigBee wireless communication. SLS sends the real-time light on/off state to the gateway. Table 4 shows the function of each control unit.
Prototype of the system control units and the specifications.

PMS: power management system; S-PMS: standby power management system; SLS: smart light switch.
Control unit function.
PMS: power management system; S-PMS: standby power management system; SLS: smart light switch; PC: personal computer.
Control algorithm
Priority step 1: physical management—associated device control
Figures 7 and 8 show the control algorithms of the proposed system. The algorithms are divided into two categories: the first is the power supply algorithm and the second is the power-off algorithm of S-PMS. The first user arrives at work and turns on the SLS to brighten the room. As SLS is a ZigBee-based wireless lighting controller, and it sends the current light conditions to the central server. The server recognizes that the light is on and waits to determine whether the PC is turned on. The PMS connected to the PC periodically monitors the power of the PC and, when the PC is on, the PMS sends the information as to whether any user has turned on the PC and transmits this information to the server. The server turns on the S-PMS of the office appliances related to the user’s PC. That is priority step 1, the associated device control. The following figures and tables represent a simulation of the associated device control.

Total system algorithm.

(a) S-PMS power supply algorithm and (b) S-PMS standby power cut-off algorithm.
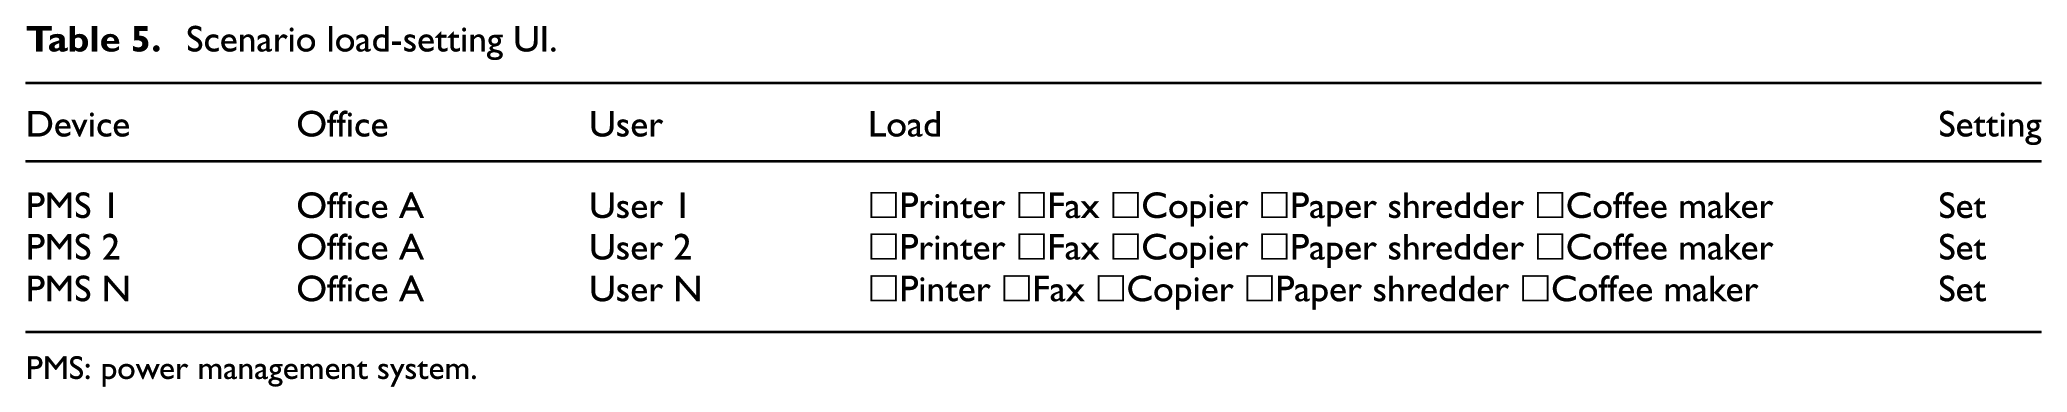
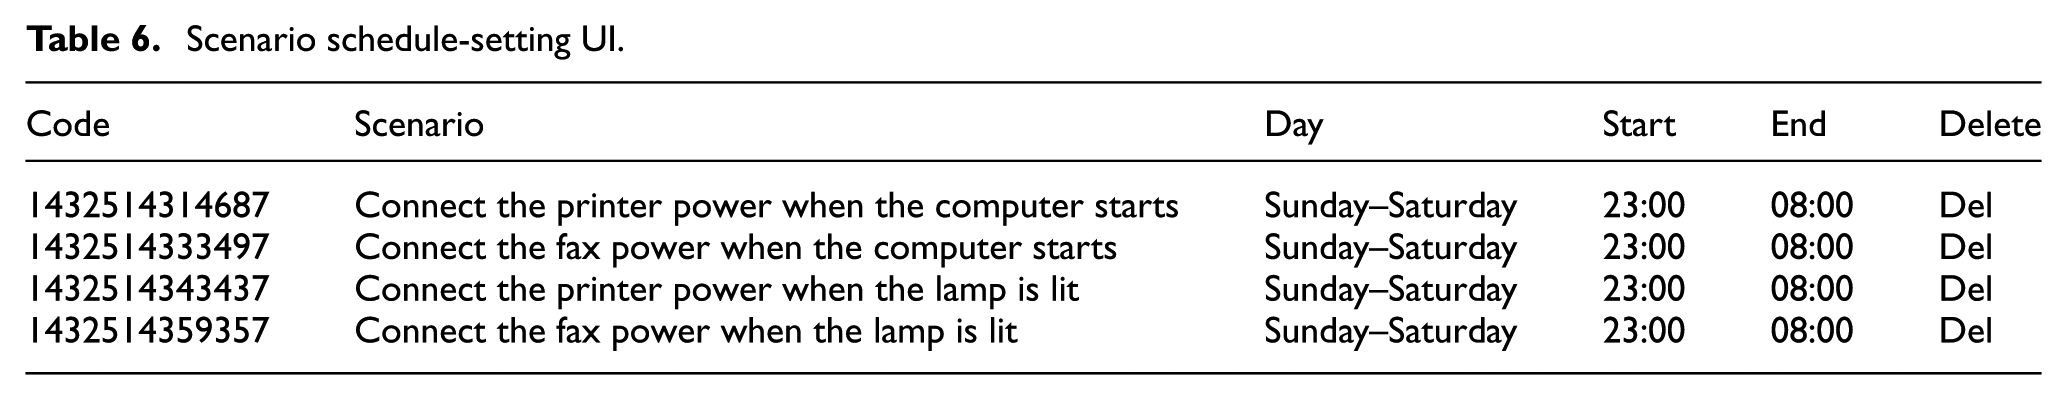
Figure 9(a) shows the associated device control architecture. It consists of four modules: the ADC manager (AM), scenario manager (SMR), schedule manager (SCM), and user database (UDB). User scenarios and schedules are managed by the SM and SCM. They are configured by the user through a scenario-setting user interface (UI) and stored in the UDB. In this way, the simulator user can assign the office appliances associated with each user, and it is possible to define scenarios based on PCs and office appliances that are mostly used. If the user’s PC is turned on, this is detected by the server, which performs associated device control by first turning on the S-PMS related to the office appliances. Scenarios can be defined as shown in Tables 5 and 6. Codes are assigned automatically and the scenario can be registered by the users by assigning commonly used office appliances, whereupon the PC of the user is turned on and the associated appliances are automatically connected to S-PMS. The users are able to set the day of the week, start/end time, and remove their settings using the delete icon.

(a) associated device control and (b) scenario-setting UI.
Scenario load-setting UI.
PMS: power management system.
Scenario schedule-setting UI.
Priority step 2: virtual management—rule-based device control
After performing priority step 1 for a specified period of time (if the time is reached to reserved time for rule-based management), the server performs priority step 2 in which S-PMS is controlled by rules created by the acquisition of past behavioral patterns. S-PMS needs to collect user patterns and set up a schedule in advance based on these power usage patterns. The work presented in this article shows that this system collected all power usage data associated with a particular user over 14 days to analyze the user’s power usage in the office, set the rules, and apply this information in the real office environment. Figure 10 shows the rule-based management architecture and schedule-setting simulator simulation of this system.

(a) Rule-based management and (b) rule-based schedule setting.
The rule-based management architecture has four managers: the control manager, learning manager, rule-based scheduler, and DB. The user’s power pattern was collected and learned by the learning manager, and these power data were analyzed by the rule-based scheduler according to the user name, appliance type, using time, and power consumption. The central server controls each S-PMS automatically through the gateway by the rule. The rules are created by each user’s habitual usage of office appliances during the past 14 days. Moreover, it is important to note that these rules are also updated by special events generated during step 1. As mentioned in section “Overall system configuration,” unpredicted appliance usage events are indeed possible for each user. In addition, the user can adjust the rule by the rule-based schedule-setting simulator. A user can add a new schedule, user setting, schedule setting, on/off time, delete setting, and so on.
In the next section, the user’s habitual power pattern in three spaces (offices A, B, and C) is analyzed by data acquisition and the measurement of power consumption for all office appliance power over 14 days to evaluate the proposed system. Moreover, a user’s habitual power consumption is used to create the rules that verify the extent to which the standby power consumption was reduced. The proposed system was applied to the actual test-bed for 7 days through associated device control and rule-based scheduling.
Results of implementation
Data analysis
Analysis of the power consumption of office appliances for 2 weeks
Figure 11 shows the power consumption graph for 2 weeks. The blue and orange bars of the graph represent the power graph of the first and second weeks, respectively. The graph only shows the consumption for three devices: the coffee maker, fax, and copy machine. The power analysis graphs of the paper shredder and printers were excluded from this article because they show a similar power curve. This graph shows that there are many standby power regions on weekends, and these regions could be blocked by S-PMS all day. Figure 12 shows the power consumption of each office appliance for weekdays.

Power consumption graph of office appliances for 2 weeks.

Graph of the coffee maker power consumption per day.
Analysis of the coffee maker power consumption for 2 weeks
Figure 12 shows an analyzed power data graph of the coffee maker for each day over a 2-week period. The blue and orange bars of the graph show the power graphs of the first and second weeks, respectively. As shown in Figure 11, the power consumption of the coffee maker indicates frequent use on Tuesday, Thursday, and Friday, that is, the days on which the standby power may be blocked. In addition, the data analysis shows that the coffee maker belonging to office A was analyzed and it was determined that the standby power can be blocked for the period 18:00–9:00 (16 h); the coffee maker belonging to office B was analyzed and it was determined that the standby power can be blocked for the period 19:00–08:00 (14 h).
Analysis of the fax power consumption for 2 weeks
Figure 13 shows an analyzed power data graph of the fax machine for each day over a 2-week period. The machine shows high power usage from Monday to Thursday, and the other days were analyzed to be able to block the standby power. The data analysis shows that the fax machine belonging to office A was analyzed and it was determined that the standby power can be blocked for the period 20:00–9:00 (14 h); the fax machine belonging to office C was analyzed and it was determined that the standby power can be blocked for the period 05:00–09:00 (5 h).

Graph of the fax power consumption per day.
Analysis of the copy machine power consumption for 2 weeks
Figure 14 shows an analyzed power data graph of the copy machine for each day over a 2-week period. The copier showed high power usage from Monday to Friday, and it was analyzed to block the standby power during weekends. The data analysis showed that the standby power of the copier belonging to office A can be blocked for the period 24:00–8:00 (9 h), and the standby power of the copier belonging to office B can be blocked for the period 23:00–09:00 (11 h).

Graph of the copy machine power consumption per day.
Importantly, unpredictable variables such as those represented by the blue regions shown in Figure 14 can be changed. This would avoid the problem that occurs if the user were to unavoidably use the appliance during the time that the electric power is cut-off based on a rule on the basis of past power data. However, as the proposed system is a two-step priority power-aware system, if the users are using the office appliances, in other words, if the user’s PC and SLS are continually in an “on” state, even when the time is reached to turn off the appliance because of rule-based management, appliances can be used without a problem. Because the SLS and PC states are still on, it is possible to use the appliances even when an unexpected event occurs. It updates the unexpected event generation time and power consumption data to the server, and it reflects and applies the updated rules for the next time.
The next section shows how it can save power during 7 days by the proposed system based on an analysis of the power data during 14 days through the application of associated device control and rule-based management in offices A, B, and C.
Actual scenario application
Energy reduction scenario setting
This section shows how much power can be saved through the application of the proposed system to the actual offices A, B, and C by analyzing the power data for 14 days as previously proposed. The proposed system was applied to the test-bed offices A, B, and C, and power reduction rate was analyzed for 7 days to allow real office users to use the five appliances (fax, printer, coffee maker, shredder, and copier) in the office. The mandatory requirement of the scenario is that users had to turn off the light inside the office when all users leave the office and PC control is excluded from the target. First, the associated device control scenario-setting conditions are the “power cut-off condition” and “power come back on condition.” The power cut-off condition is a real-time monitoring of the power consumption of the PC > PC power off > power off the S-PMS associated with the user > check the light switch inside the office > SLS is off > turn off the power of all devices. The power come back condition is as follows: divide the SLS into office A, B, and C regions > check whether the office light is on > light is on > power on the local PMS > real-time monitoring of the instantaneous power of the PC > PS is on > return the power of S-PMS associated with a user. Table 7 shows the device control scheduling timetable in this scenario.
Device control scheduling timetable through user pattern analysis.

Application of scenario and results
An actual test of the power-saving scenario was performed for 7 days. Figure 15 shows the result of the power consumption for 7 days prior to the actual test period and power consumption for the actual test period whether the proposed system is applied or not. The power consumption is compared for weekdays, weekends, and the entire week. In Figure 16, the actual power-saving results are calculated by comparing the data with last week data of the actual test period and optimal power-saving results are calculated by comparing the data in same period whether the proposed system is applied or not. Actually, it gives a total 23% of the actual power reduction rate by applying the proposed system, while it gives a total 31.7% of the optimal power reduction rate.
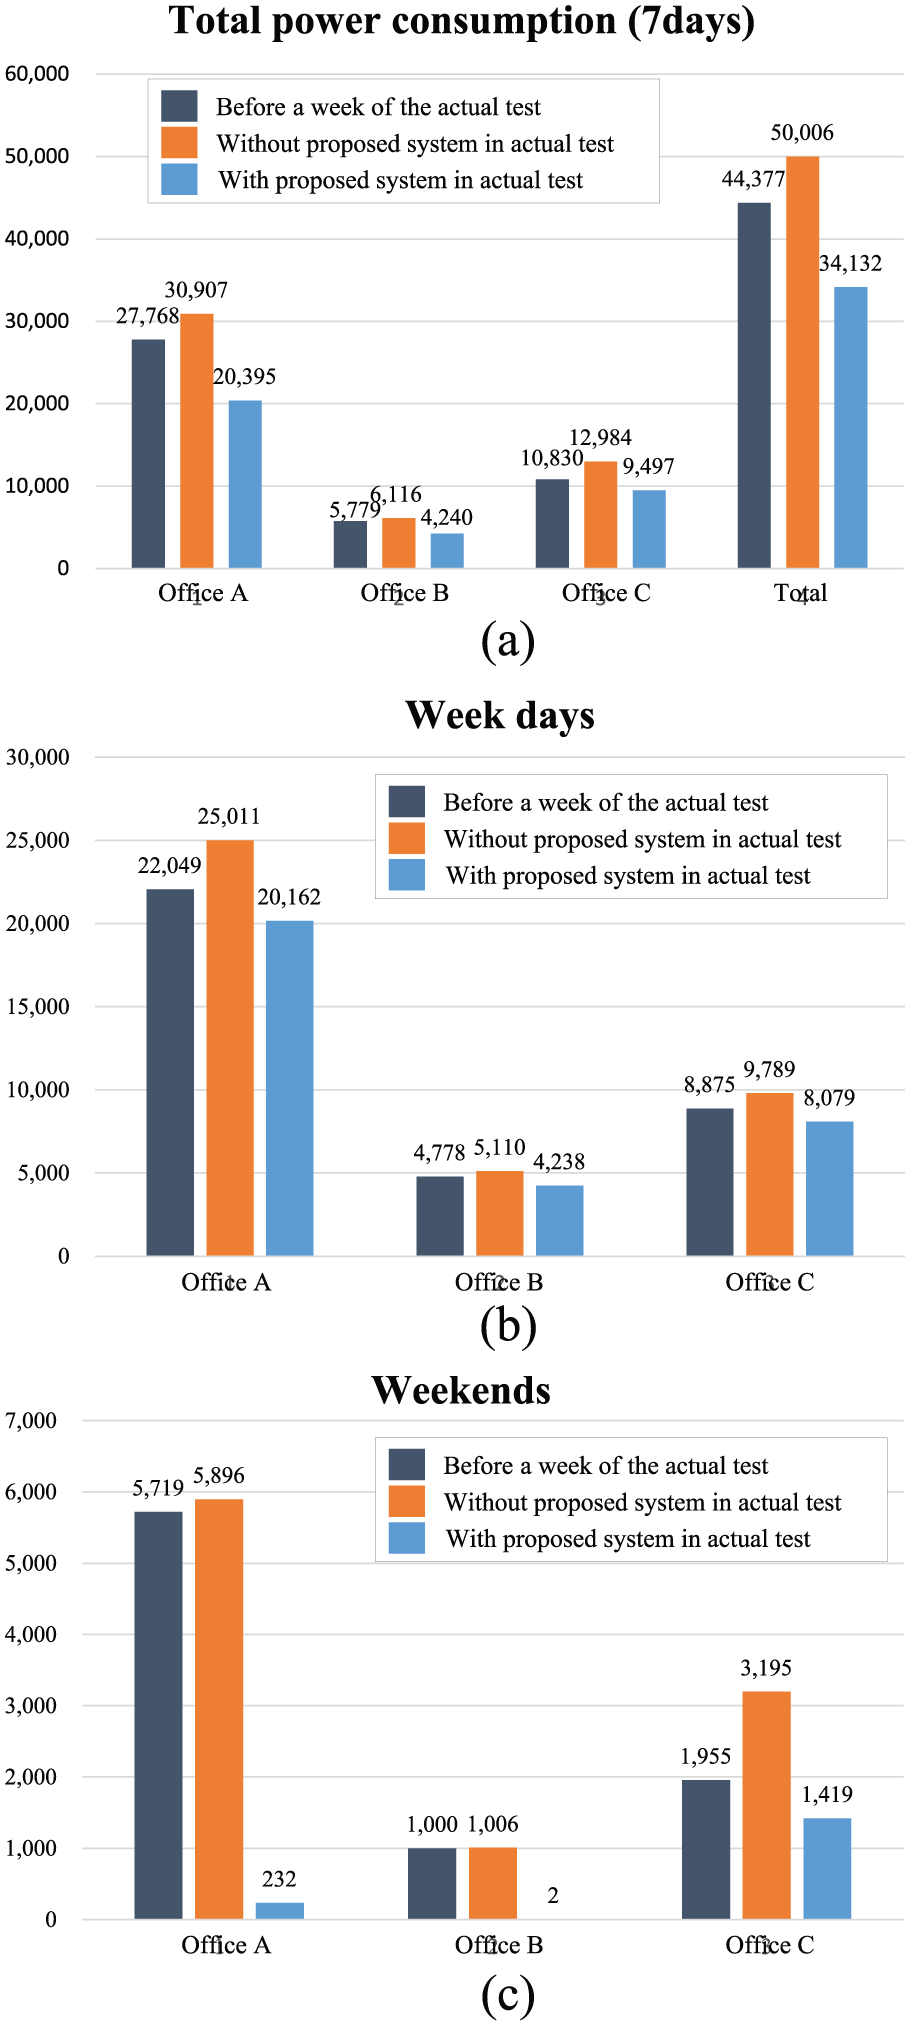
Power consumption of the office appliances through the proposed system for 7 days: (a) total power consumption and reduction rate, (b) power consumption and reduction rate on the weekdays, and (c) power consumption and reduction rate for the weekend.

Optimal and actual power reduction.
The purpose of this article is to provide more accurate services to users by physical and virtual management. The purpose of the proposed system is not how much standby power is reduced but how stably the standby power reduction service is provided without any discomfort to users. For example, if a rule-based management service is provided to users based on past data, inevitably device power will be shut down automatically while users are still present and working in the office. For this unreliable situation, physical management–based virtual management is required. Therefore, our research team added Figure 17 to present the average error rate per total reduced standby power in a day by dividing into two categories.
The average error rate per total reduced standby power in a day with only virtual management;
The average error rate per total reduced standby power in a day with both physical management + virtual management.

Average error rate per total reduced standby power in a day.
In this graph, there are a maximum of 5.8% average errors per total reduced standby power in a day with only virtual management. However, it was showed there are 0% average errors per total reduced standby power in a day with physical management and virtual management. The reason is that the virtual management is implemented when the users are present in the office by detecting the user through the physical management so that erroneous services are not provided to the users.
Significance of the result
The results showed the two sides of the aspects in Figure 1: the paradigm and service aspects. In terms of the paradigm aspect, the current Information and Communication Technology (ICT) era comprises IoT, Cloud, Big data, and Mobile (ICBM). In this era, the intelligence and interoperability of network devices continue to increase, but the reliability is less than in the past. The purpose of this work is to design and provide a more intelligent and accurate rule-based virtual management service.
Reliability of proposed system. Figure 14 shows that users and appliances may experience many unpredictable events in the IoT environment based on only virtual management. However, this system is a virtual system based on a physical system; therefore, it is possible to accept and update physical unpredictable user events in the virtual management period by associated device control.
Intelligence of proposed system. Virtual management of the proposed system can provide user habitual pattern-based management automatically by monitoring the power consumption and scheduling of office appliances. It can provide intelligent and automatic management of standby power consumption by cutting off the period through close inter-working between the physical and virtual management.
Conclusion
In the changing environment of the era of the IoT, the most important objective is the balancing of the intelligence and stability of IoT device. Past IoT technology has been developed based on highly original and fundamental technology except for the device intelligence and interoperability; however, current IoT is developed based on highly semantic technology except for the device stability and reliability. Our work aimed to address these shortcomings to give a balanced development of IoT device technology. The results presented in this article show an OS-PMS that uses the pattern analysis of physical and virtual user devices in energy–IoT environments. The first step involves physical management to control the S-PMS by associated device control scenarios with the aim of reducing the scope of user recognition through the perception of physical user events to provide concrete context factors. The second step entails virtual management to control the S-PMS according to users’ habitual patterns. The system predicts the next step of S-PMS on/off time by the pre-made user habitual rule. It is important to note that special unpredicted events and variables of user behavior in the office can be allowed during the virtual management period. It is possible to continually use the office appliances because the SLS and PC states are still on. This is the reason for proposing this two-step priority power-aware system by physical and virtual management. The proposed system is expected to simultaneously provide intelligence and stability to the IoT system in the various changing environments of the IoT. Furthermore, from now on, research on big-data analysis for long-period power data will be conducted using annual data. Analyzing this annual power data is expected to be useful for future energy–IoT fields; for example, power reasoning system through the seasonal variation of power consumption, and demand and response forecasting system by analyzing seasonal device usage pattern.
Footnotes
Academic Editor: Yuwang Yang
Declaration of conflicting interests
The author(s) declared no potential conflicts of interest with respect to the research, authorship, and/or publication of this article.
Funding
The author(s) disclosed receipt of the following financial support for the research, authorship, and/or publication of this article: This research was supported by a grant from the Human Resources Development (no. 20154030200860) of the Korea Institute of Energy Technology Evaluation and Planning (KETEP) funded by the Korea government Ministry of Trade, Industry and Energy, and by the Chung-Ang University Research Scholarship grants in 2015.