
Abstract
The accurate localization of end-users and resources is seen as one of the main pillars toward the successful implementation of context-based applications. While current outdoor localization mechanisms fulfill most application requirements, the design of accurate indoor localization mechanisms is still an open issue. Most research efforts are focusing on the design of mechanisms making use of the receiver signal strength indications generated by WLAN (wireless local area network) devices. However, the accuracy and robustness of such mechanisms can be severely compromised due to the random and unpredictable nature of radio channels. In this article, we develop a methodology incorporating various algorithms capable of coping with the unpredictable nature of radio channels. Following a holistic approach, we start by identifying the wireless equipment parameter setting, better meeting the implementation requirements of a robust indoor localization mechanism. We then make use of RANdom SAmple Consensus paradigm: a robust model-fitting mechanism capable of smoothing the data captured during the space survey. Using an experimental setup, we evaluate the benefits of integrating the floor plan and an ordinary Kriging interpolation algorithm in the estimation process. Our main findings show that our proposal can greatly improve the quality of the information to be used in the development of particle-filter-based indoor localization mechanisms.
Keywords
Introduction
The accurate localization of end-users and resources is seen as one of the main pillars toward the successful implementation of context-based applications. Context-based and customized services will heavily rely on the effectiveness and accuracy of localization mechanisms. The provisioning of a wide variety of such services will be based on the use of wireless access points (APs) strategically deployed in public sites. In this way, users will get access to end services via their mobile devices based on their location.
While current outdoor localization mechanisms fulfill most context-aware application requirements, the design of accurate indoor localization mechanisms is still an open issue. Indoor localization is therefore a major research and development topic in the area of information technologies. Due to the widespread use of mobile devices incorporating IEEE 802.11 and Bluetooth technologies as prime network access interfaces, most efforts are focusing on solutions based on these two technologies.1,2 Among the various approaches being pursued, received signal strength indicator (RSSI)-based localization mechanisms have been extensively studied for more than 15 years now.3,4 These methods make use of the power level of the RSSI to estimate the distance between two wireless devices, typically an AP and a mobile device. However, the actual implementation of RSSI-based indoor localization solutions faces major challenges due to the unpredictable nature of the radio channel resulting from the shadowing and multipath experienced by the radio signals.5–7
Among all the different approaches to develop RSSI-based indoor localization algorithms, 8 we point out those relying on the use of particle filters. 9 This technique has proven to be effective in other problems coping with noisy data, such as robot localization 10 or scene classification. 11 The main advantage on the use of particle filters is the management in conjunction of several location hypotheses. This allows for coping with the uncertainty on the distance estimation between a reference point and a target derived from the presence of noisy data. Moreover, the efficiency of the algorithm can be adapted to low-resource devices by selecting the number of particles.
From the above, it is clear that the accuracy of the RSSI-based indoor localization algorithms rely on the estimation of the actual RSSI values and the proper setting of the parameters of the model relating the RSSI and the distance between a reference point and the location of a target within a given environment. One of the main goals of this work is therefore to improve the RSSI estimation of the log-distance path loss model making use of robust model fitting. 12 Since our work focuses on indoor environments, we incorporate into our methodology a spatial statistical analysis algorithm. The latter looks into the main architectural features that may affect the estimation of the RSSI and key parameters used in the signal propagation model. We show that the integration of such features is not only straightforward but also more important, and it integrates naturally into the operation of an indoor localization systems based on particle filters.
An overall scheme of the proposed system is shown in Figure 1, where dotted lines represent those stages out of the scope of this work but considered for future developments. The work herein focuses on the robust and accurate model estimation used on the RSSI-based localization mechanisms. The main goal is therefore to enhance the accuracy and robustness of the particle weights by taking into account the unpredictable nature of the channel and the structural features affecting the RSSI levels. The estimation is performed for every particle
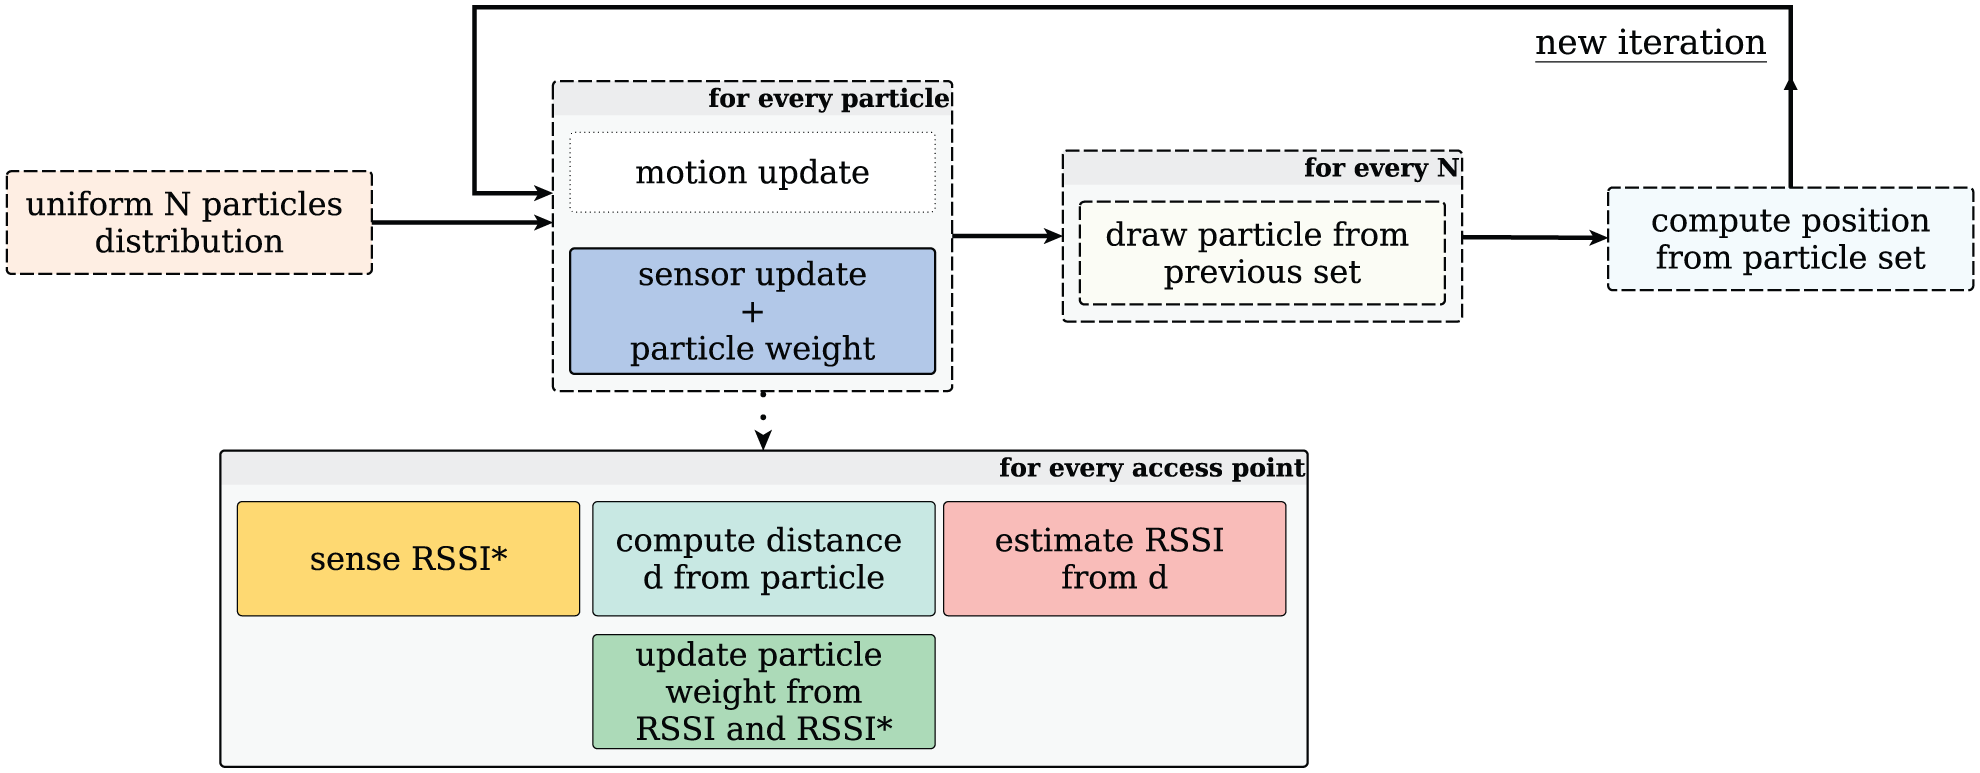
Overall proposal scheme.
While many articles have introduced RSSI-based localization mechanisms, most of them do not properly describe the operating conditions of the experimental scenarios, which limit the reproducibility of the experiments. In this study, we take, particularly, care on justifying the choice of the experimental setup and scenarios. We also motivate our choice on the model-fitting and statistical analysis algorithms used on the processing of the data captured during our trials. Furthermore, our results also show the relevance of including the floor plans on the estimation process. In other words, our study identifies the structural features describing the underlying operating conditions when evaluating an RSSI-based localization mechanism.
The article is organized as follows. Section “RSSI-based distance estimation” introduces the formulation of the RSSI-based distance estimation model. We then evaluate the convenience of using 2.4 GHz versus 5 GHz IEEE 802.11 WLAN (wireless local area network) technologies on the development of an indoor localization mechanism.1,2 In section “Environment definition and experimental setup,” we introduce the experimental environment and describe the surveys conducted during our field trials. In section “Robust model estimation integrating spatial characteristics,” we fit the channel propagation model to the experimental data captured using the RANdom SAmple Consensus (RANSAC) paradigm, 13 in conjunction with a spatial characterization. In section “Experimental results,” we evaluate the signal propagation modeling while we interpolate the results obtained using an ordinary Kriging estimator. The improvements obtained over baseline results validate the appropriateness of the proposal, and we discuss the effect of a proper RSSI distance estimation to be used in the development of particle-filter-based indoor localization mechanisms. Finally, section “Conclusion and future work” outlines our main conclusion and future work plans.
RSSI-based distance estimation
In this section, we introduce the indoor propagation model used to estimate the distance between an AP and a mobile device. Specifically, we adopt the indoor propagation model based on the log-distance path loss model proposed in Rappaport: 12

where
All the parameters in equation (1) can be experimentally measured except n, which needs to be estimated. Classical approaches determine the n value that minimizes the estimation error in a set of ground truth preliminary measurements. This is usually done using the least squared error as metric. However, this approach has serious limitations as the wireless signal is very noisy and its propagation is negatively affected by the structural characteristics of the environment. 12 The distribution of these variations cannot be estimated a priori, as they may suddenly lie outside the expected range of values. Unfortunately, the integration of the structural characteristics is not always available making unfeasible the development of accurate and robust standard trilateration localization mechanisms. 14 We have to, therefore, develop a methodology making use of algorithms capable of coping with the unpredictable nature of radio channels and the structural features of the target environments. Fortunately, this information integrates naturally into the operation of an indoor localization systems based on particle filters.
IEEE 802.11 parameter setting
In order to conduct our experiments, we had to set up an experimental platform meeting our study requirements. The experimental platform consisted of a set of wireless IEEE 802.11 APs deployed in an indoor environment. Current IEEE 802.11 APs can operate in two different frequency bands (2.4 and 5 GHz) and at three different power levels (low, middle, and high). Our first task consists of identifying the best configuration of these two parameters satisfying the design and development requirements of an RSSI-based indoor localization mechanism. In particular, we are interested in developing indoor localization mechanism, and then the wireless AP should be configured to capture the attenuation of the signal as a function of the distance between the AP and the mobile devices.
In that sense, we carried out a preliminary set of experiments, where a TP-LINK AC1750 Archer C7 and a RaspBerry Pi devices were used as the APs and the mobile device, respectively. Throughout this first set of experiments, we set up the AP at a fixed location and the RaspBerry Pi was placed at increasing distances of 1 m length from the AP, ranging from 1 to 15 m under line-of-sight (LOS) conditions, in order to sense the level of the signal transmitted by the AP. That process was repeated for the two bands (2.4 and 5 GHz) and for each one of the three power levels of the AP (low, middle, and high).
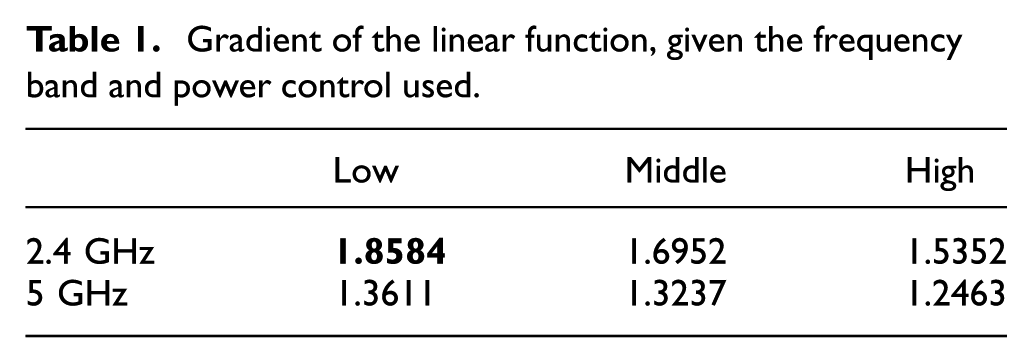
Using the data gathered during this first set of experiments, we then modeled the relationship between the distance and the attenuation of the signal using linear regression. That is to say, we modeled the attenuation rate of the signal as a function of the distance by the slope/gradient of the linear function that models such relationship. The data and the linear regression model are depicted in Figure 2 for each of the two bands under study. Table 1 provides the gradients for both bands and the three power levels. As expected, the signal attenuates at a higher rate when using the low-power mode of operation, being this attenuation higher for the 2.4-GHz band. However, a closer look at the results depicted in Figure 2 reveals that in the 5-GHz band, the signal attenuates to levels that may render it impractical for the purpose of locating a mobile device within a span distance beyond 10 m. Since our main goal is to develop an indoor localization mechanism, we should choose a setting allowing us to identify changes on the RSSI levels within the expected area of interest. From the results depicted in Figure 2 and Table 1, we can conclude that we should operate the AP on the 2.4-GHz frequency band in low-power mode.
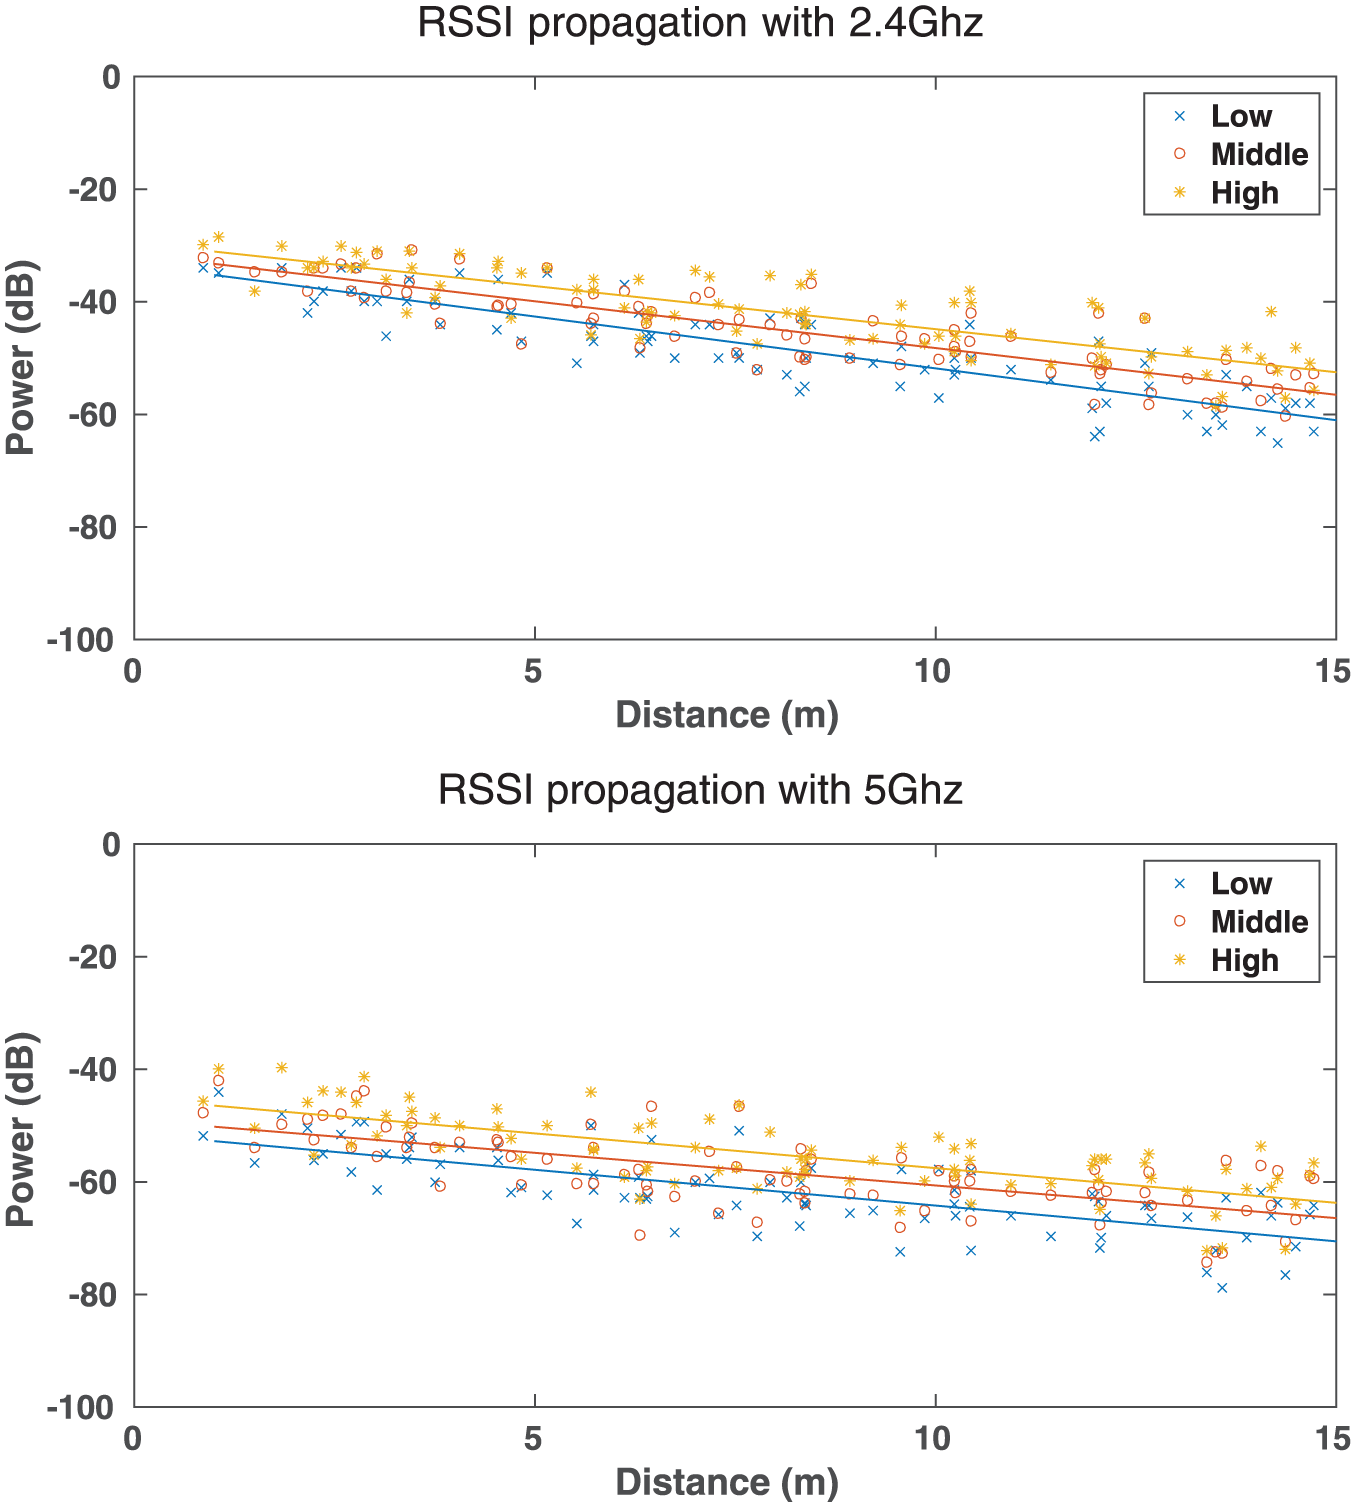
Study of the RSSI attenuation for different AP power levels and two different frequency bands: 2.4 GHz (top) and 5 GHz (bottom).
Gradient of the linear function, given the frequency band and power control used.
Environment definition and experimental setup
We set up our experimental platforms in one of the labs of the Albacete Research Institute of Informatics, University of Castilla-La Mancha, Spain. The lab’s layout and dimensions are similar to those used in comparable research studies. 5 We have accordingly defined the layout of the experimental equipment taking into account the RSSI levels observed in section “IEEE 802.11 parameters setting.”Figure 3 shows the floor plan of the lab. The lab dimensions are 28.7 m long and 6.4 m wide, that is, its total area is 183.68 m2.

Experimental environment layout. White squares and cylinders denote the location of APs and MPs, respectively.
The benchmark lab is divided into four accessible zones, identified in the figure by capital letters A, B, C, and D, and two professor offices which were intentionally non-accessible during our experimental sessions. This division was made in that way with the only purpose of making the environment as realistic as possible, in which we will typically have to deal with non-public access areas. More specifically, zones A and C are two computer labs of 9 m long and 6 m wide, each. Zone B is a corridor of 10.7 m long and 1.2 m wide. Zone C is a meeting room of 5 m long and 5 m wide. The two computer labs are furnished with tables located against the walls. The meeting room is furnished with a table and chairs placed in the middle. Some sample views of the experimental environment are shown in Figure 4.
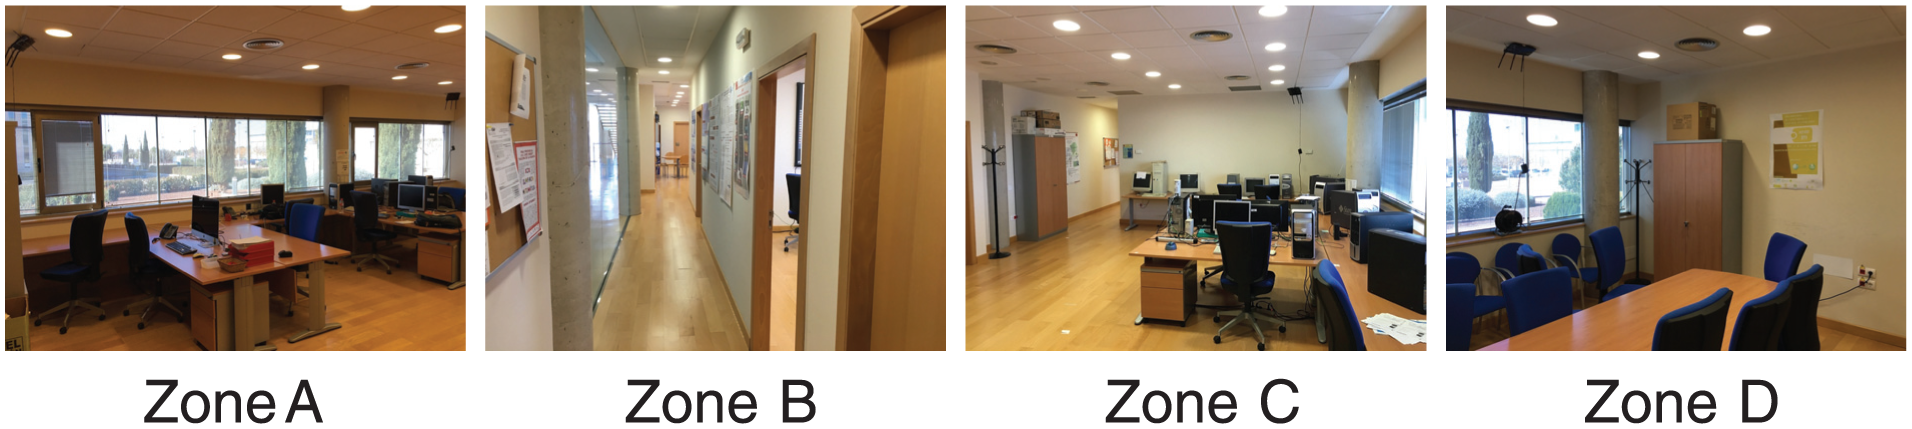
Experimental environment.
As shown in Figure 3, our experimental wireless platform consisted of five wireless APs. All five APs were of the brand TP-LINK AC1750 Archer C7 implementing the IEEE 802.11ac standard. Taking as origin reference coordinates, the lower left corner of the figure, two APs (AP1, AP2) were installed in Zone A at positions (0.58 m, 5.13 m) and (8.82 m, 5.90 m). Two other APs (AP4, AP5) were placed in Zone C at positions (20.64 m, 5.12 m) and (28.87 m, 5.73 m), and the last AP (AP3) was placed in Zone D at position (15.41 m, 5.65 m). All of them were fixed to the ceiling, as can be observed in Figure 4. We then set up the transmission channels to be used during our trials. This task required a preliminary survey of the wireless channel occupancy due to the presence of other APs in the building. Based on the results of the survey, we assigned channels 1 (2.412 GHz), 3 (2.422 GHz), 5 (2.432 GHz), 7 (2.442 GHz), and 9 (2.452 GHz) to AP1, AP2, AP3, AP4, and AP5, respectively.
In order to carry out the survey, we also had to define a set of measurement points (MPs). We uniformly distributed the MPs as presented in Figure 3. A total of 29 MPs were defined: 10 in Zone A, 6 in Zone B, 9 in Zone C, and 4 in Zone D.
The data acquisition was carried out by measuring the RSSI power level of all the APs at each MP during 1 s. The device used for this purpose was a Raspberry Pi equipped with an IEEE 802.11ac radio operating in the 2.4-GHz band. The device was placed on a robot platform at 1 m high. In order to prevent signal impairments due to the presence of staff, our first survey was conducted outside the regular working hours.
Despite this, we also analyzed the effect of the space occupancy in a preliminary experiment where we gathered data in the environment under three different scenarios: low occupancy (1–2 people in the environment), medium occupancy (4–8 people), and high occupancy (9–16 people). These scenarios correspond to the expected number of people at different hours of the day in the real environment. For each of these three scenarios, we measured the RSSI power levels from every AP–MP combination. This resulted into 145 measurements per scenario. We then performed a Friedman 15 test at a 95% confidence level using the exreport tool (available at: http://exreport.jarias.es/). The null hypothesis established the three scenarios as equivalent regarding their effect over the RSSI propagation. The hypothesis was not rejected, and therefore, we can state that based on the expected space occupancy, the RSSI transmission is not significantly affected by the number of people in the environment. Based on these premises, we can extrapolate the results from the experimentation for every expected space occupancy.
Robust model estimation integrating spatial characteristics
In this section, we undertake the model estimation of the RSSI/distance function making use of the data captured. As we intend to integrate the RSSI propagation model in a particle filter localization algorithm, we assume the likelihood estimation for a set of position hypotheses corresponding to the particles. These assumptions allow us to initially categorize each measurement. Instead of a binary LOS/non line of sight (NLOS) categorization of the RSSI measurement samples, we propose a more complex spatial analysis. Our approach defines a different category for each combination of AP and the zone where the MPs are located. This results into 20 different categories, 5 APs, and 4 different zones.
Furthermore, in order to carry out a robust estimation of n, we made use of the RANSAC algorithm. 13 RANSAC is an iterative method for estimating a mathematical model from a set of data likely to contain outliers. The use of RANSAC is fully justified by the unpredictable nature of the radio channel. RANSAC iteratively estimates models from random subsets of the original data that are then evaluated against the complete data set. The algorithm finishes after a certain number of iterations or when some conditions about the model fitting are met. In our case, the underlying idea about using RANSAC is to obtain the value of n in an estimation process where outliers are involved.
In order to illustrate the benefits of our approach, in the following, we first present the results for the case when we do not make use of the floor plan in the model-fitting process. In this first case, we include the model-fitting results using RANSAC and the least-squared-error algorithm results. For the second case, once having shown the benefits of using the RANSAC algorithm, we incorporate the floor plan into the model-fitting process.
Case A: without floor plan
In this first set of results, we illustrate the benefits of using a robust model-fitting algorithm, that is, RANSAC, over a least-squared-error algorithm. Figure 5 depicts the RSSI and distance relationship obtained using the RANSAC algorithm (green line) and the least-squared-error algorithm (blue dashed line) for every AP, namely, AP1 to AP5. In this figure, we also present the outlier measurements (in red) that are not involved in the generation of the RANSAC model during its last iteration. From the figure, it is clear that the model estimation obtained using RANSAC mainly differs from the one obtained by the least-squared-error method in the presence of a large number of outliers. From this analysis, the values obtained for n for each one of the five APs where

Original (blue dashed line) and RANSAC (green line) estimation of the RSSI/distance relationship from a set of measurements.
Case B: with floor plan
In this section, we undertake the model estimation using the spatial characterization consisting of 20 categories: each one correponding to the tuple (AP, MP zone). Therefore, the number of different path loss coefficient factors, n, is 20. As already stated, we use the RANSAC algorithm to determine the values of
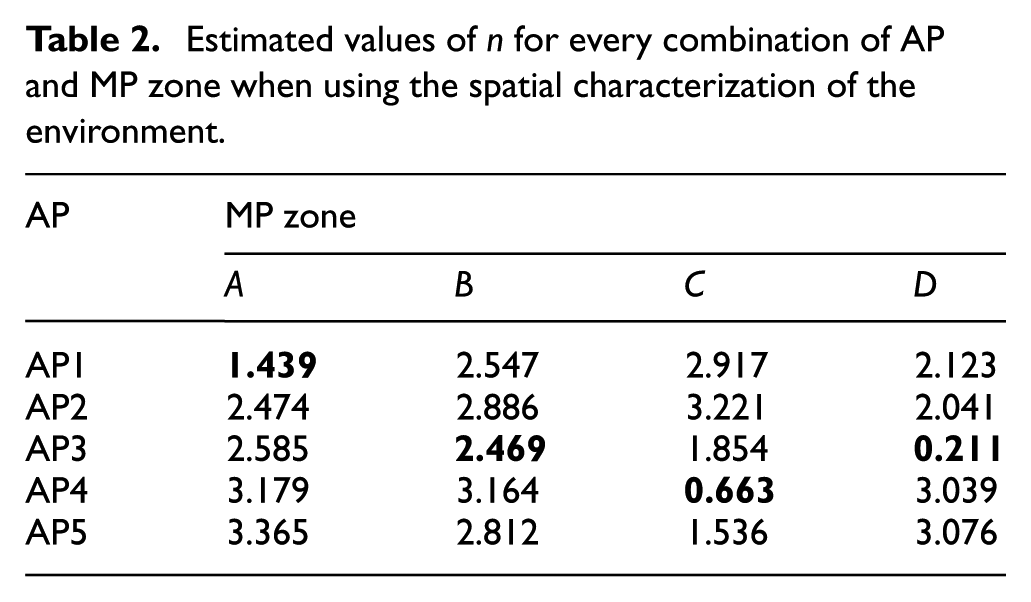
Figure 6 shows the results obtained using the RANSAC algorithm. Different to the previous case, we note that the fact of incorporating the spatial characteristics on the model-fitting process has a great impact on the model outcome. Table 2 summarizes the corresponding estimated values of
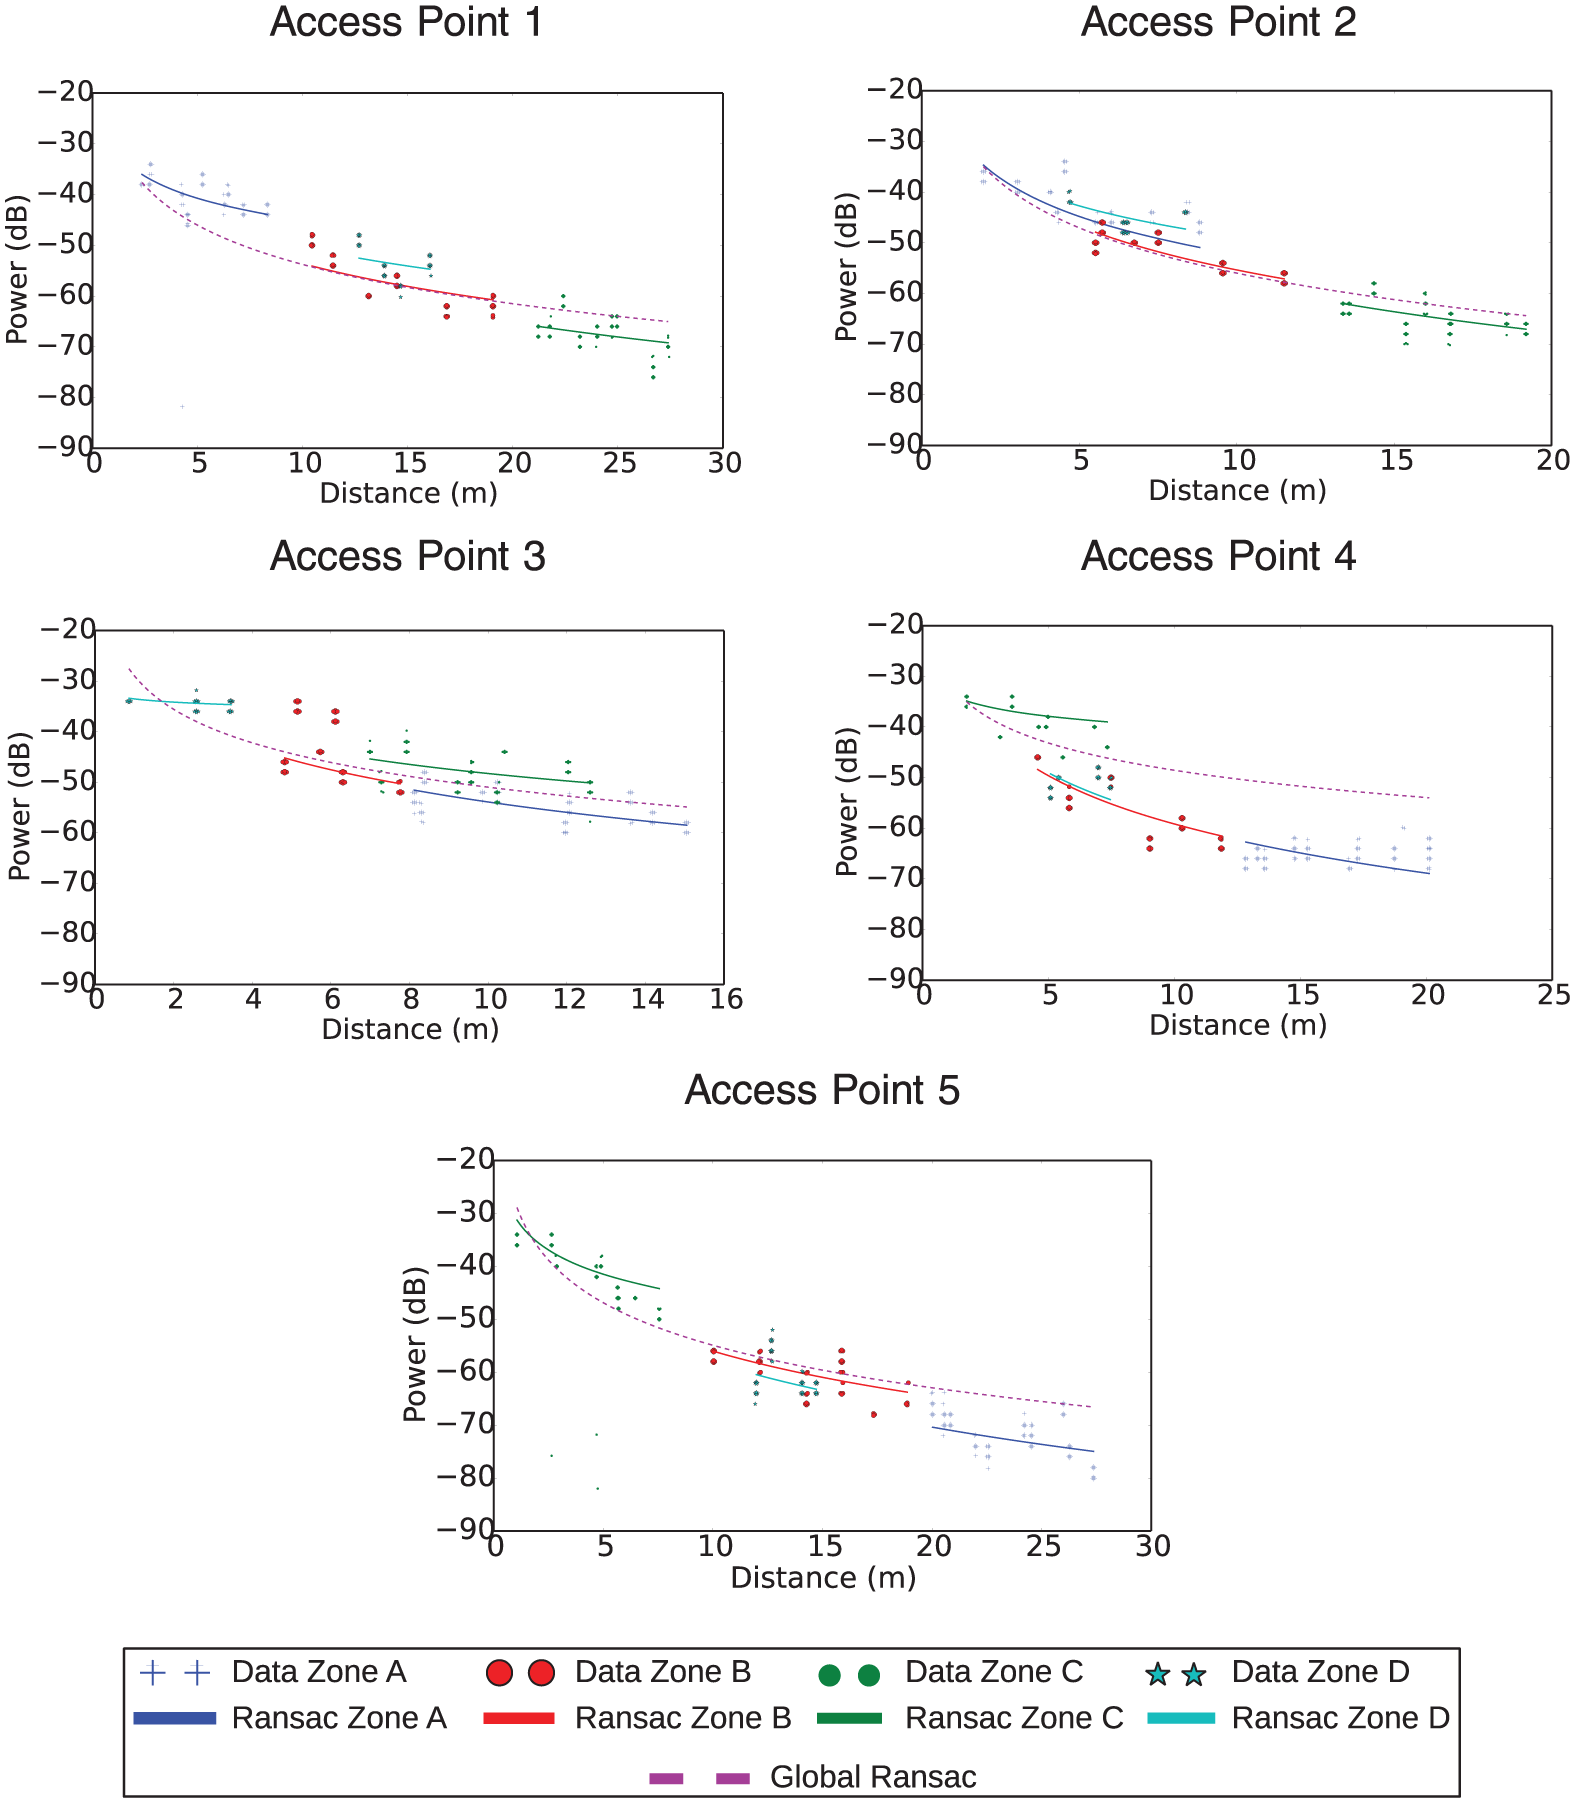
RANSAC estimation of the RSSI/distance relationship from subset of characterized measurements.
Estimated values of n for every combination of AP and MP zone when using the spatial characterization of the environment.
Experimental results
The main objective of this work is to establish the basis for an indoor particle-filter-based localization algorithm relying on RSSI propagation. The performance of this algorithm will depend on a proper modeling of the RSSI/distance, which has been depicted and validated in previous sections. Here, we carry out a statistical analysis to test our proposal while considering the spatial distribution of the evaluation environment.
The experimentation was carried out as follows. We performed an additional measurement stage following the procedure previously presented in section “Environment definition and experimental setup.” Each measurement is annotated with the RSSI power level and the identifier of the transmitting AP. Moreover, the ground truth includes the position of the MP. This information can be used to compute the error on the RSSI estimation, which is performed using the propagation model from equation (1). This model takes the distance between emitter and receiver as argument, which can be computed from the position of the AP. It also uses a path loss coefficient factor n that should be previously established. We then evaluate two different scenarios: (a) the classical computation of factor n, which is estimated (per AP) using the least-squared-error principle; (b) our proposal, which consists of a novel establishment of the n factor based on the RANSAC algorithm in conjunction with a spatial characterization of the environment.
From each combination of measurement and AP, we acquire a set of RSSI values that are aggregated to a single averaged value for visualization purposes. This value is then compared to the RSSI value estimated from the propagation model and using the ground truth distance between both points. This method leads into 145 errors used to generate heat maps representing their spatial distribution along the environment. As we rely on a subset of 29 positions of the environment (MPs), we should interpolate these data to generate representative heat maps. Instead of classical interpolation algorithms, we opted by the Kriging technique, 16 which has obtained very promising results in different research fields like wireless sensor networks 7 or agriculture. 17 Kriging extends the simplistic distance method by a realistic spatial correlation model. It determines the experimental variogram defined as a function of sample of a phenomenon and the distance between the corresponding sampling location. In parallel to this process, we also compute two error metrics where the whole set of measurements are considered with no aggregations. Concretely, we estimate the mean absolute error (MAE) and the mean squared error (MSE) that emphasize differences in the RSSI estimation.
Baseline scenario
The baseline scenario is shown in Figure 7, where we present the error when a path loss coefficient factor n for the RSSI propagation model per AP is obtained from a least-squared-error principle. Up to five different n values, the corresponding five APs are estimated. This map has been generated using a Kriging spatial interpolation from the average error computed from the measure points. From these MPs, we computed a MSE of 50.22.

Baseline absolute RSSI power (db) error.
Impact of RANSAC
The second scenario refers to the integration of the RANSAC algorithm in the modeling of the RSSI propagation. The resulting error heat map is presented in Figure 8, where a small decrease in the error can be appreciated when compared with the results of Figure 7. The MSE computed from the RANSAC estimations is 46.55.

Absolute RSSI power (db) error with RANSAC estimation.
Impact of spatial characterization
The third scenario considers the spatial characterization previously described in section “Robust model estimation integrating spatial characteristics.” This characterization involved the categorization of all the measurements as belonging to a specific category. Each category comes from the combination of AP and the zone of the MP. Taking into account that the benchmark scenario consists of four zones and five APs, up to 20 different categories are considered. The spatial characterization allowed for a fine grain modeling of the RSSI propagation. Figure 9 shows a heat map where the modeling errors are graphically presented. Moreover, the MSE has been successfully decreased to 12.82.

Absolute RSSI power (db) error with RANSAC estimation and spatial characterization.
The error on the RSSI propagation estimation is illustrated in Figure 10. The figure shows the benefits of incorporating the spatial characterization: a significant error reduction in the RSSI estimation. Despite this, the inherent noise in the RSSI transmission is translated into small errors, which encourages the design and development of localization algorithms for indoor positioning capable of coping with uncertainty.

Mean squared and absolute RSSI power error obtained in the three scenarios.
Conclusion and future work
In this work, we have presented an in-depth model fitting and spatial characterization of the wireless RSSI levels in an indoor environment. In this analysis, we have depicted and analyzed the different parameters to be tuned, mainly the power level of the APs and frequency bands. We have proposed two enhancements to the model-fitting estimations of the path loss coefficient factor n, which is a key parameter of the RSSI propagation model proposed in Rappaport. 12
Our approach naturally integrates the RANSAC algorithm and a spatial characterization of the environment. The RANSAC algorithm, in conjunction with the spatial characterization, has proved particularly useful due to the presence of outliers characterizing the RSSI nature. The experimentation carried out allowed us to quantify the error on the RSSI estimation taking into account the spatial features of the target environment. The use of the well-known Kriging technique also allowed us to interpolate the results obtained from isolated measurement locations to the whole environment.
Our immediate research efforts will be focused on the development of an indoor localization and tracking mechanism based on particle filters. The mechanism to be developed will take advantage from the accurate modeling of the RSSI propagation presented in this work. Our findings should facilitate the work of researchers and practitioners interested in the actual development and deployment of indoor localization solutions. Moreover, we also have in mind to extend this study to incorporate different technologies, such as Bluetooth.
Footnotes
Academic Editor: Florentino Fdez-Riverola
Declaration of conflicting interests
The author(s) declared no potential conflicts of interest with respect to the research, authorship, and/or publication of this article.
Funding
The author(s) disclosed receipt of the following financial support for the research, authorship, and/or publication of this article: This work has been partially sponsored by the “Programa Nacional de Innovación para la Competitividad y Productividad, Innóvate—Perú” of the Peruvian government, under grant no. FINCyT 363-PNICP-PIAP-2014; by the Spanish Ministry of Economy and Competitiveness under grant nos TIN2015-66972-C5-2-R, TIN2013-46638-C3-3-P, and TIN2015-65686-C5-3-R; and by the Regional Council of Education, Culture and Sports of Castilla-La Mancha under grant no. PPII-2014-015-P.