
Abstract
Crowdsensing systems are developed in order to use the computational and communication capabilities of registered users to monitor specific variables and phenomena in an opportunistic manner. As such, the Quality of Experience is not easily attained since these systems heavily rely on the user’s behavior and willingness to cooperate whenever an event with certain interest needs to be monitored. In this work, we analyze the data acquisition phase, where pedestrians opportunistically transmit to vehicles to further disseminate it in the city according to their trajectory. This highly dynamic environment (sensors and data sinks are mobile, and the number of users varies according to the region and time) poses many challenges for properly operating a crowdsensing system. We first study the statistical properties of vehicular traffic in different regions of Luxembourg City where pedestrians share their computational resources and send data to passing cars. Then we propose an Erlang distribution to model the vehicles’ dwelling times and develop a Markov chain accordingly. We model the system using two different queues: we use a single server queue to model the vehicle traffic, while we use an infinite server queue system to model the pedestrian traffic.
Keywords
Introduction
Crowdsensing systems are formed by collaborating users who lend their computational and communication resources to aid in different tasks, such as monitoring different regions with an interest for different reasons. These systems are now possible and promise a paradigm shift in the Internet of Things (IoT) and wireless sensor networks (WSNs), among others. Indeed, the number of resources can be increased considerably if users, who are now equipped with mobile devices (which do not significantly suffer from battery restrictions since they can connect their phone to an electric outlet in many available opportunities during their daily routine), are willing to aid and support a specific monitoring task.
WSNs are the main component of the IoT, where small, inexpensive nodes with communication capabilities are deployed in a region of interest (RoI) to monitor certain variables such as pollution, noise, and temperature, among others. These nodes can operate distributedly with little or no human intervention. Hence, one primary performance metric is system lifetime, directly related to average energy consumption by each node. Also, by placing thousands or millions of these devices throughout the city to report certain events, the amount of transmitted information to a data sink, most likely using the 5G communication infrastructure, may hinder the communication capabilities of many other users in the surroundings. In this regard, having complete coverage of sensor nodes in a city may be unpractical or economically challenging.
Crowdsensing may alleviate both problems: energy consumption of battery-restricted devices and massive use of communication resources in cellular systems. Using the built-in sensors of mobile devices of people walking near the event of interest, the use of fixed and specific nodes installed in that region becomes less demanding, that is, fewer sensor nodes are required, and they may transmit less information, effectively reducing energy consumption. Moreover, if the event occurs at a different location, the fixed infrastructure of conventional WSNs may pose an insurmountable obstacle to monitor extended areas efficiently. To reduce data transmission to the nearby cellular base stations, the alternative is to use the vehicles passing by, which may transit many different points of a city and can perform short-range data transmissions to different points in their trajectories, or even, to other vehicles that may be recruited to act as data mules disseminating information in the region, effectively reducing the number of transmission in the cellular infrastructure. This futuristic scenario may occur sooner than expected with the development of smart cities, where many devices, architectures, systems, applications, and services are connected, installed, recruited, and designed with the objective to improve the quality of life of people living or visiting the city, simplifying operations and procedures, communicating emergency events, providing additional security to habitants, monitoring pollution levels, reducing reaction times of authorities, and so on and so forth.
In this work, we study, analyze, model, and evaluate the quality of experience (QoE) of the data acquisition phase (pedestrians-to-vehicles) of a crowdsensing system that allows users to publish specific events that may occur in the city and that registered users agree to collaborate. For example, a final user may wish to detect different urban fauna in a particular public park at some time of the day. Then, this user may publish the event of the type: Please use the microphone of mobile devices to record birds singing near you. The user would also determine the region’s area to monitor and the event’s duration, say for example, 20 min at 100 m around the point of interest. This event will be received only by pedestrians inside this region while any other user outside this area does not receive it. Pedestrians or bystanders inside this region may choose to aid in the monitoring of this event at the reception of the event alarm and start recording using their mobile devices. Then, this information would be automatically transmitted to vehicles passing by inside the same region. These vehicular users are not alerted by the event to avoid unnecessary distractions (we assume that people in vehicles cannot aid in reporting the event due to their short time inside the RoI and because they may be driving), but rather they have already consented to collaborate by acting as data mules receiving this information and transport it to different points in their trajectory (which for autonomous vehicles may be very accurate but for many other drivers, using real-time maps and driving applications, the points that the vehicle may pass in their trajectory may also be very approximate to the one suggested by the driving application) that may include, for instance, the intended receiver, their workplace, the urban fauna research facilities, and so on. These data are not aimed at reporting emergency events or real-time data in the sense that many of these events may not be reported due to the lack of either pedestrians or vehicles in the area or because data could not be successfully transmitted in the RoI. Besides, data may take many hours to arrive at the final destination due to the trajectory of the transporting vehicles or may not arrive since the vehicle changed its trajectory. In this regard, this is an opportunistic, non-real-time, monitoring system. Other potential applications may be focused on monitoring water or other substance leakages, pollution detection (using photos or video), health-related services, 1 and road conditions, among others.
Other works such as Wang et al. 2 have been published in this area where a secure communication among vehicles is developed using blockchain. However, Xu et al. 3 propose incentives for vehicles to better recollect the sensed data following the sensing distribution. Unlike our work, they assume that data are present throughout all of the city and are not concentrated in RoIs as in our case. Furthermore, Pandey et al. 4 present a mathematical modeling of delay and throughput at the medium access control (MAC) layer using the IEEE 802.11 protocol for directional location–aided routing position–based routing protocol. They also use the Simulation of Urban MObility (SUMO) simulator but not the real Luxembourg traces. They focused on communications among vehicles while we studied the communication between pedestrians and vehicles.
Evidently, the proposed system performs satisfactorily when enough people are present in the RoI. Hence, we study the performance of the system considering different zones in Luxembourg City that may attract enough resources to provide an adequate QoE that we evaluate in terms of the success transmission probability and also because we have enough real vehicle traces in these regions to perform an accurate system modeling.
Building on the above, our work focuses on a crowdsensing system where pedestrians can use the sensors in their mobile devices, such as cameras, accelerometers, and gyroscopes, to take relevant readings in an RoI and then send these data to a remote location using vehicles as data mules. As such, the dwelling time of pedestrians in the RoI and the dwelling times of vehicles in the same region are of primary importance to develop an accurate analysis. To this end, we use real vehicle traces to calculate the mean, variance, and coefficient of variance (CoV) of vehicles passing certain regions to model the crowdsensing system accurately. Then we develop a Markov Chain to study the system’s performance in different vehicle traffic, namely, low, medium, and high traffic conditions.
Note that not all pedestrians in the RoI are cooperating in the system; only a fraction of them, the ones inscribed and active in such application, are the ones cooperating in the monitoring tasks. The same applies to vehicles since not all vehicles act as data mules. Then, we refer to pedestrians and vehicles as the active users, collaboratively sensing and transporting data, for the crowdsensing system. Hence, pedestrians and vehicles that are not inscribed in the system are ignored for our study.
We limit our study to the packet transmissions from pedestrians to vehicles inside different RoIs, with different traffic conditions and different pedestrian traffic loads. Data dissemination from vehicles to the final destinations represents an entirely different problem that we believe has been thoroughly studied before,5,6 while the problem of data acquisition, from pedestrians to vehicles, has been largely overlooked before. In this regard, if vehicles acting as data mules have not correctly received the respective data, the data dissemination may not be efficient. Our work provides a detailed analysis of this first stage in crowdsensing systems.
Based on the above, our main contributions of this work are as follows:
We study and analyze a crowdsensing system composed of pedestrian mobile devices that capture relevant data from the environment and passing vehicles that act as data mules in smart city environments.
We develop a mathematical analysis that captures the main dynamics of a system by obtaining the packet success transmission probability in different traffic conditions.
We statistically characterize the vehicle traffic in terms of the mean, variance, and CoV of vehicle dwelling times in different RoIs to accurately model the system performance.
We derive a Markov Chain based on the Erlang distribution that effectively captures these statistical properties mentioned above.
We provide clear guidelines to select the system parameters that allow the system to adapt to different pedestrian concentration conditions. As we show in the following sections, if the number of active pedestrians reporting an event is too high, it may hinder the system operation by producing a high number of packet collisions, drastically reducing the successful packet transmission probability. To avoid this, the transmission probability must be selected carefully.
The rest of the article is organized in the following manner: In section “Related work,” we present some recent and relevant crowdsensing systems related to or similar to our proposed work; then, in section “Crowdsensing operation scenario,” we detail our system model and main assumptions. Following this, we develop the mathematical analysis in section “Vehicular traffic analysis,” used to evaluate the system performance, presenting its main representative results in section “Teletraffic analysis and system model.” We end this article with our main conclusions and future research.
Related work
In this section, we briefly discuss previously published works related to mobile crowdsensing systems (MCSs) that consider pedestrians and/or vehicles for its operation.
From the perspective of using vehicles in crowdsensing applications, many efforts have been made to select the adequate vehicles that better disseminate or convey the sensed data. In Zhu et al., 7 the authors investigate how mobile vehicles can be optimally selected in order to collect maximum data from the urban environment in a future period of tens of minutes. The application scenario is generalized to a realistic online setting where vehicles continuously move in real time, and the data center decides to recruit a set of vehicles immediately. Also in Chakeri et al., 5 they propose a solution to the problem of sensing coverage of regions located out of the autonomous vehicles’ (AVs) planned trajectories. They tackle this problem by dynamically modifying the AVs’ trajectories and collecting sensing samples from regions. In Wang et al., 8 a novel vehicle selection algorithm is developed to maximize the sensing range with little cost while the vehicle selection problem was proved to be NP-complete. Specifically, they modeled the interaction between servers and candidate vehicles as a Markov decision process and formulated the maximum spatial temporal coverage (STC) optimization as a deep reinforcement learning process. Vehicular crowdsensing uses vehicles’ mobility to collect fine-grained city-scale data, as mentioned in Agarwal et al. 6 Their work aims to understand drivers’ and passengers’ perspectives; they developed Turn2Earn, a generic vehicular crowdsensing system that incentivizes drivers to take specific routes for data collection. The authors uncovered novel insights, including the viability of offered routes due to road closure, issues with electric vehicles, and selection bias among the drivers. This work’s conclusions can be applied to our system to increase the number of vehicles in the RoI. In similar research, the authors of Sun et al. 9 proposed a two-tier sensing scheme for optimizing the sensing mechanism and data processing. In the routing layer, they build a weighted graph model based on vehicle fog and propose a new routing strategy to maximize each vehicle’s utilization. Furthermore, in Xiang et al., 10 a novel operation model for Mobility-on-Demand-Vehicular-Crowdsensing (MOVE-CS) is designed, at the heart of which lies a spatial-temporal differentiation-aware task recommendation scheme empowered by sub-modular optimization. Applied to the dataset, their design would essentially benefit both the drivers and platform, thus possessing the potential to improve vehicle crowdsensing systems. However, the data acquisition procedure form pedestrian mobile device is not considered in all these works. Instead, they focus on how to best deliver this data already in possession of vehicles.
From the perspective of human interaction in crowdsensing systems, in Domaszewicz and Parzych, 11 the authors study a company setting. The rationale for this is that everyday employees learn about things happening in their company. This includes plain facts witnessed while on the job, related or not to one’s job responsibilities. Many of these facts, which are called “occurrence data,” are known by employees but remain unknown to the company. In the spirit of mobile crowdsensing, they propose intra-company crowdsensing (ICC), a method of “extracting” occurrence data from employees. In ICC, an employee occasionally responds to sensing requests, each about one plain fact. They build the concept of ICC, proposing a model of human–system interaction, a system architecture, and an organizational process. This work is an example of one of many possible event monitoring but no vehicles are considered for the data dissemination. In Kutsarova and Matskin, 12 sensors are not the common built-in sensors in mobile devices but rather on wearable devices. The contributions of this article are twofold. First, they enhance the capabilities of an MCS by enabling the integration of various Bluetooth wearable devices. Second, they perform a simulation that models different scenarios representing dangerous events. Through the MCS simulation, the authors identify essential parameters that need to consider when building such systems. The simulation can also be used to find the optimal configuration of the MCS. The results of their work can be easily applied to our proposal by considering data from wearables in addition to sensors of mobile devices with minimum modifications to the analysis presented below. However, we do not delve into the details of wearables used as data sources.
There are also many works using unmanned aerial vehicles (UAVs) to support the crowdsensing system. In Xu et al., 13 the paper first proposes a mathematical model for task allocation for UAVs in crowdsensing. Then, for the effectiveness of data sensing, three algorithms are proposed to allocate tasks to minimize the incentive cost while ensuring the quality of sensing data. This work can be used as an alternative when there are no pedestrians in the RoI or for time-sensitive real-time events that require higher computational resources than the one proposed in our work. However, this alternative may not be applicable for a conventional event reporting due to the high implementation and maintenance costs. Conversely, we propose using mobile devices and vehicles already present in the RoI. Hence, no extra costs are involved. Also, in Sahraoui et al., 1 the authors present a smart coordination mechanism between UAVs and ground vehicles (GVs), which sense information such as body temperature and breathing rate of people, to support various monitoring applications, including discovering the presence of infectious diseases. In their framework, namely, GUAVA, aerial vehicles and GVs are equipped with Global Positioning System (GPS) devices and thermal cameras to monitor specific geographic areas and detect humans’ vital parameters. At the same time, it discovers duplicated data by identifying matching faces in thermal video sequences with the GaussianFace algorithm. In this case, vehicles are producing the data, instead of pedestrians. Similarly, in Xiang et al., 14 the authors propose novel studies on the utilization of delivery drone resources to fill the voids in urban crowdsensing. Accounting for interdependency between flying/sensing and drone delivery weight, they jointly optimize route selection, sensing time, and delivery weight allocation to maximize delivery and sensing utility under drones’ energy constraints. That problem is formulated as a non-convex mixed-integer non-Linear programming problem, which is proved to be NP-hard. Again, the use of UAVs is justified for specific events; in this case, disease monitoring may not be adequate for low-priority or non-emergency events, where opportunistic transmissions are well-suited, like the one we propose.
In Chen et al., 15 the authors develop CrowdTracking, that is, a crowd tracking system in which people can collaboratively track the moving vehicle by taking photos, especially in areas where video cameras are deficient. In other words, the underlying support of CrowdTracking is an MCS. As a result, by continuously collecting photos of the moving vehicle on different roads, the vehicle can be tracked and localized almost in real time. This is a very different application from the one we propose since vehicles are not acting as data mules, but instead vehicles are the event being monitored. However, this application can also be implemented in our system where pedestrians can take photos of specific cars passing by, and these photos can be later transmitted to other vehicles passing by to disseminate this information to police patrols (that may be looking for that car in the area) for example. Another relevant application of vehicle crowdsensing is the one developed in Ali et al., 16 where mobile crowdsensing is considered. MCS is a developing category of IoT applications that are used in Intelligent Transportation Systems (ITS) to improve the transport system. The MCS-based Dynamic Traffic Efficiency Framework (MCS-DTEF) for traffic congestion control is presented in this work. The essential characteristics of MCS-DTEF are that traffic detection can be performed without deploying sensor devices on both sides of the road. The traffic data can be collected in real time, and traffic flow can be predicted and managed according to current situations, reducing fuel consumption and driving time. Simulation of the Urban Mobility simulator is used for the evaluation. Similar research can be found in Zambrano et al. 17 This work focuses on developing an ITS for the city of Quito that allows smart decision-making to direct heavy-haul transporters that want to enter the city via one of its main access routes. Technologies such as Sensor Web Enablement (SWE), in association with the Message Queuing Telemetry Transport (MQTT) communication protocol, facilitate the development of a vehicular management platform/system capable of sending notifications in real time and issuing instructions to drivers regarding traffic delays along routes and average speeds, among others. The proposed system supports a network of heterogeneous sensors. In these works, interaction with pedestrians is not considered.
In the work presented in Hirth et al., 18 they first used a simulation study to analyze a simple crowdsensing system concerning the detection performance of spatial events to highlight the potential and limitations of a pure crowdsourcing system. The results indicate that even if only a small share of inhabitants participate in crowdsensing, events that have locations correlated with the population density can be easily and quickly detected using such systems. On the contrary, events with uniformly randomly distributed locations are much harder to detect using a simple crowdsensing-based approach. A second evaluation shows that hybrid systems improve the detection probability and time. Finally, they illustrate how to compute the minimum number of fixed sensors for their studied scenario’s given detection time thresholds. The results are very relevant for our proposal since we are not considering uniformly distributed events in the city, but rather events concentrated in specific areas that we consider to be of particular interest due to their touristic or work-related nature, and high pedestrian and vehicular concentrations are expected.
Crowdsensing operation scenario
In this work, we consider that certain locations in Luxembourg City (but for all cities in general) are of main interest due to high pedestrian and vehicular traffic. Note that when there are no pedestrians or vehicles, event reporting and data transmissions would be relatively low and probably insufficient for the crowdsensing application. Conversely, when many pedestrians in the region report the event, packet collisions may occur, also hindering the system operation. To study both scenarios, we consider a certain radius to study the effect of having low and high surfaces for the regions of interest.
We assume that pedestrians voluntarily offer their sensing and computational resources by subscribing to a crowdsensing service or platform. By doing so, whenever a particular event requires sensing in a specific area, this petition is only broadcasted to users inside the RoI, while users outside this region are not alerted. Also, users that were outside (inside) the RoI, that due to their movement enter (leave) this area, are alerted (no longer alerted) regarding this event to start (stop) the data transmissions to the vehicles passing by. We refer to pedestrians and vehicles that have been previously registered in the application and are aiding in reporting the event as active users.
Computational resources of pedestrians are sensors commonly found in modern mobile devices such as audio, video, and photographs, among others. In this sense, an event could simply be a petition from a user of the crowdsensing platform for pedestrians to send photographs of local urban fauna inside the RoI for ecological purposes at a specific time of the day.
After an active pedestrian has agreed to collaborate in a specific event, his or her mobile device will transmit the sensed data to vehicles passing by in an automatic and unassisted manner. In fact, we assume that pedestrians may not want to remain in the area looking for active vehicles to transport their information. As such, if no active vehicles are near, the data are lost or if no active pedestrian is present at the moment of the event, the reporting of such event is also lost. Given this, we are considering an opportunistic system completely based on the behavior of active users in the RoI. Accordingly, the QoE is analyzed in terms of the success packet transmission.
To transmit these data packets, we are considering a Slotted ALOHA protocol that is well suited for these highly dynamic conditions due to its simplicity and rapid transmissions. Building on this, whenever a mobile device has a packet ready to transmit, with duration of
Vehicles that have received a packet do not require any intervention from the drivers or passengers, and these packets are relayed to the final destination according to the vehicle’s trajectory. The system to relay information using vehicles as data mules has been studied before, and we refer the interested readers to Gallego-Tercero et al. 19 for further details. Conversely, in this work, we only study the QoE of the crowdsensing system from the mobile sensors to the data mules. Also, note that multiple vehicles may receive the same packet, which would provide a certain redundancy for this data but would not degrade the operation of the system.
Vehicular traffic analysis
In this section, we describe in detail the data and procedure to obtain the vehicle dwelling time.
First, we have to mention that we obtained real vehicle traces from the Luxembourg SUMO Traffic (Lust) scenario, 20 where the SUMO simulator was used to represent the real traffic related to 24 h of activity, where close to 300,000 vehicles were monitored in the real streets of Luxembourg City.
Then, we identified three different traffic conditions, namely, high, medium, and low, as follows:
High traffic conditions are identified in the period of 8:46–8:56 hours, when people likely leave their houses to go to school or work.
Medium traffic conditions are identified in the period of 12:45–12:55 hours, when people likely take a lunch break or doing a different activity from the morning tasks.
Low traffic conditions are identified in the period of 23:30–23:40 hours, when most people are at home and very few cars are in transit.
Although the crowdsensing application may be most adequate in the morning or early afternoon, for completeness purposes, we wanted to study the system’s performance even in scarce traffic conditions. It is important to note that the mathematical model developed in this work does not depend on the vehicular traffic conditions because the Markov Chain considers only the vehicular traffic arrival rate and dwelling time statistical properties. Also, the vehicular traffic considered in this work corresponds to real vehicular traces that reflect the regular operation in Luxembourg City for 24 h. In this sense, the traffic conditions are not explicitly selected by us, but rather, they occur naturally throughout the day in the monitored regions. Based on these two observations, it is possible to obtain performance metrics of the system at any time, irrespective of the traffic conditions by simply identifying the vehicle arrival rate and dwelling time properties at the periods of interest. However, to produce representative results, we opt to generate numerical results in the three aforementioned traffic conditions. These conditions were identified in Codeca et al. 20 based on the number of vehicles in each street.
During these periods, we closely monitor all vehicles passing (i.e. keeping track of the X and Y coordinates at intervals of 1 s) by different RoIs that we also identified in Luxembourg City. The rationale for considering these points is that many pedestrians can be found in these areas, very close to streets where vehicles are passing by and near to pedestrian crossings or traffic lights, assuring that there are enough opportunities to share information among people and vehicles.
In these regions, we placed a virtual circle of 25 and 50 m around the site of interest, effectively delimiting the RoI, that is, there is an event ongoing in this zone that is of great interest to monitor using the computational resources of pedestrians inside it and this information will be sent to the destination using vehicles inside the same region as data mules. Hence, we monitor vehicles inside these imaginary circles whose radii correspond to conventional communication distances of WiFi, ZigBee, and Bluetooth systems. Note that higher or smaller radius can be considered. The effect of this is that for higher (smaller) communication radius, the number of vehicles increases (decreases) inside the RoI, which entails that more (less) vehicles are available to receive data packets from pedestrian users. However, the vehicle mobility patterns are not affected by this; only the dwelling times are increased (decreased) but not the statistic properties (abstracted by the Erlang distribution) since these are independent of the crowdsensing system and only depend on the driver skills and type of roads. In this regard, higher RoIs would improve the system’s performance but not significantly after a specific value (minimal values of RoI would entail that none or very few vehicle falls inside this area). This is because these additional number of vehicles are receiving the same information, that is, copies of the same packet. As such, a high value of the RoI only increases the redundancy of information in the smart city. One disadvantage of a high RoI value is that if two or more sites of interest are close to each other such that vehicles passing by may be found inside two or more RoIs of different sites, the packet collision (due to the interference among pedestrians in different locations) may increase accordingly. This would be especially true for touristic and business/commercial regions in relatively large cities where many locations may be found close to each other. Building on this, the proposed 25 and 50 m can be considered as two specific study cases of the proposed crowdsensing system, but different values can be used, using the same methodology proposed in this work and just adjusting the vehicle dwelling times.
The sites of interest are the following:
Schlassbréck Bridge: located between avenues Monté de Clausen and Rue Sosthéne Weis. The red circle represents the RoI. The geographic coordinates are latitude: 49.611606, longitude: 6.135966, and the Cartesian coordinates are 7659.36, 6990.67, as shown in Figure 1.
Justice Palace: located between Boulevard Franklin Delano Roosevelt and René Konen Tunnel. The red circle represents the RoI. The geographic coordinates are latitude: 49.067192, longitude: 6.133443, and the Cartesian coordinates are 7458.40, 6507.01, as shown in Figure 2.
The Art Gallery Schorten: located between avenues Emile Reuter and Royal Boulevard. The red circle represents the RoI. The geographic coordinates are latitude: 49.612210, longitude: 6.126719, and the Cartesian coordinates are 7458.40, 6507.01, as shown in Figure 3.
Sofitel Luxembourg Le Grand Hotel: located between Boulevard d’Avranches and Rue du Laboratoire. The red circle represents the RoI. The geographic coordinates are latitude: 49.606562, longitude: 6.138878, and the Cartesian coordinates are 7848.34, 6421.97, as shown in Figure 4.
The International School of Luxembourg Asbl: located between Boulevard Rue de Bouillon. The red circle represents the RoI. The geographic coordinates are latitude: 49.600454, longitude: 6.104350, and the Cartesian coordinates are 5328.02, 5838.60, as shown in Figure 5.
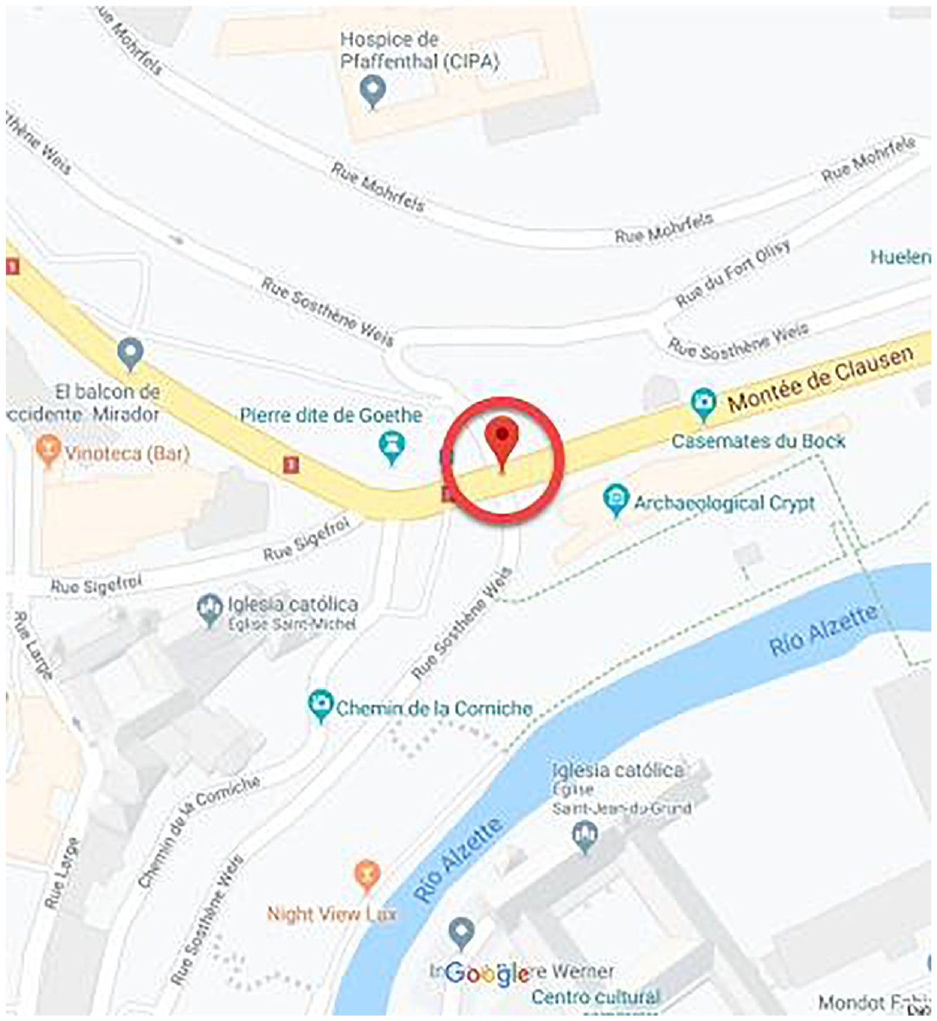
Schlassbréck Bridge.

Justice Palace.

Art Gallery Schorten.

Sofitel Luxembourg Le Grand Hotel.

The International School of Luxembourg Asbl.
Based on the geographical locations and periods of interest, we calculate the arrival rate to the RoI and vehicles’ dwelling times by closely following each vehicle trajectory every second. In Figure 6, we present the number of cars inside the RoI at the Schlassbréck Bridge for different RoI radii and vehicle traffic conditions. (We do not present these figures for the rest of the interest locations for reasons of space and because they do not add any relevant information since the figures we show are representative.).
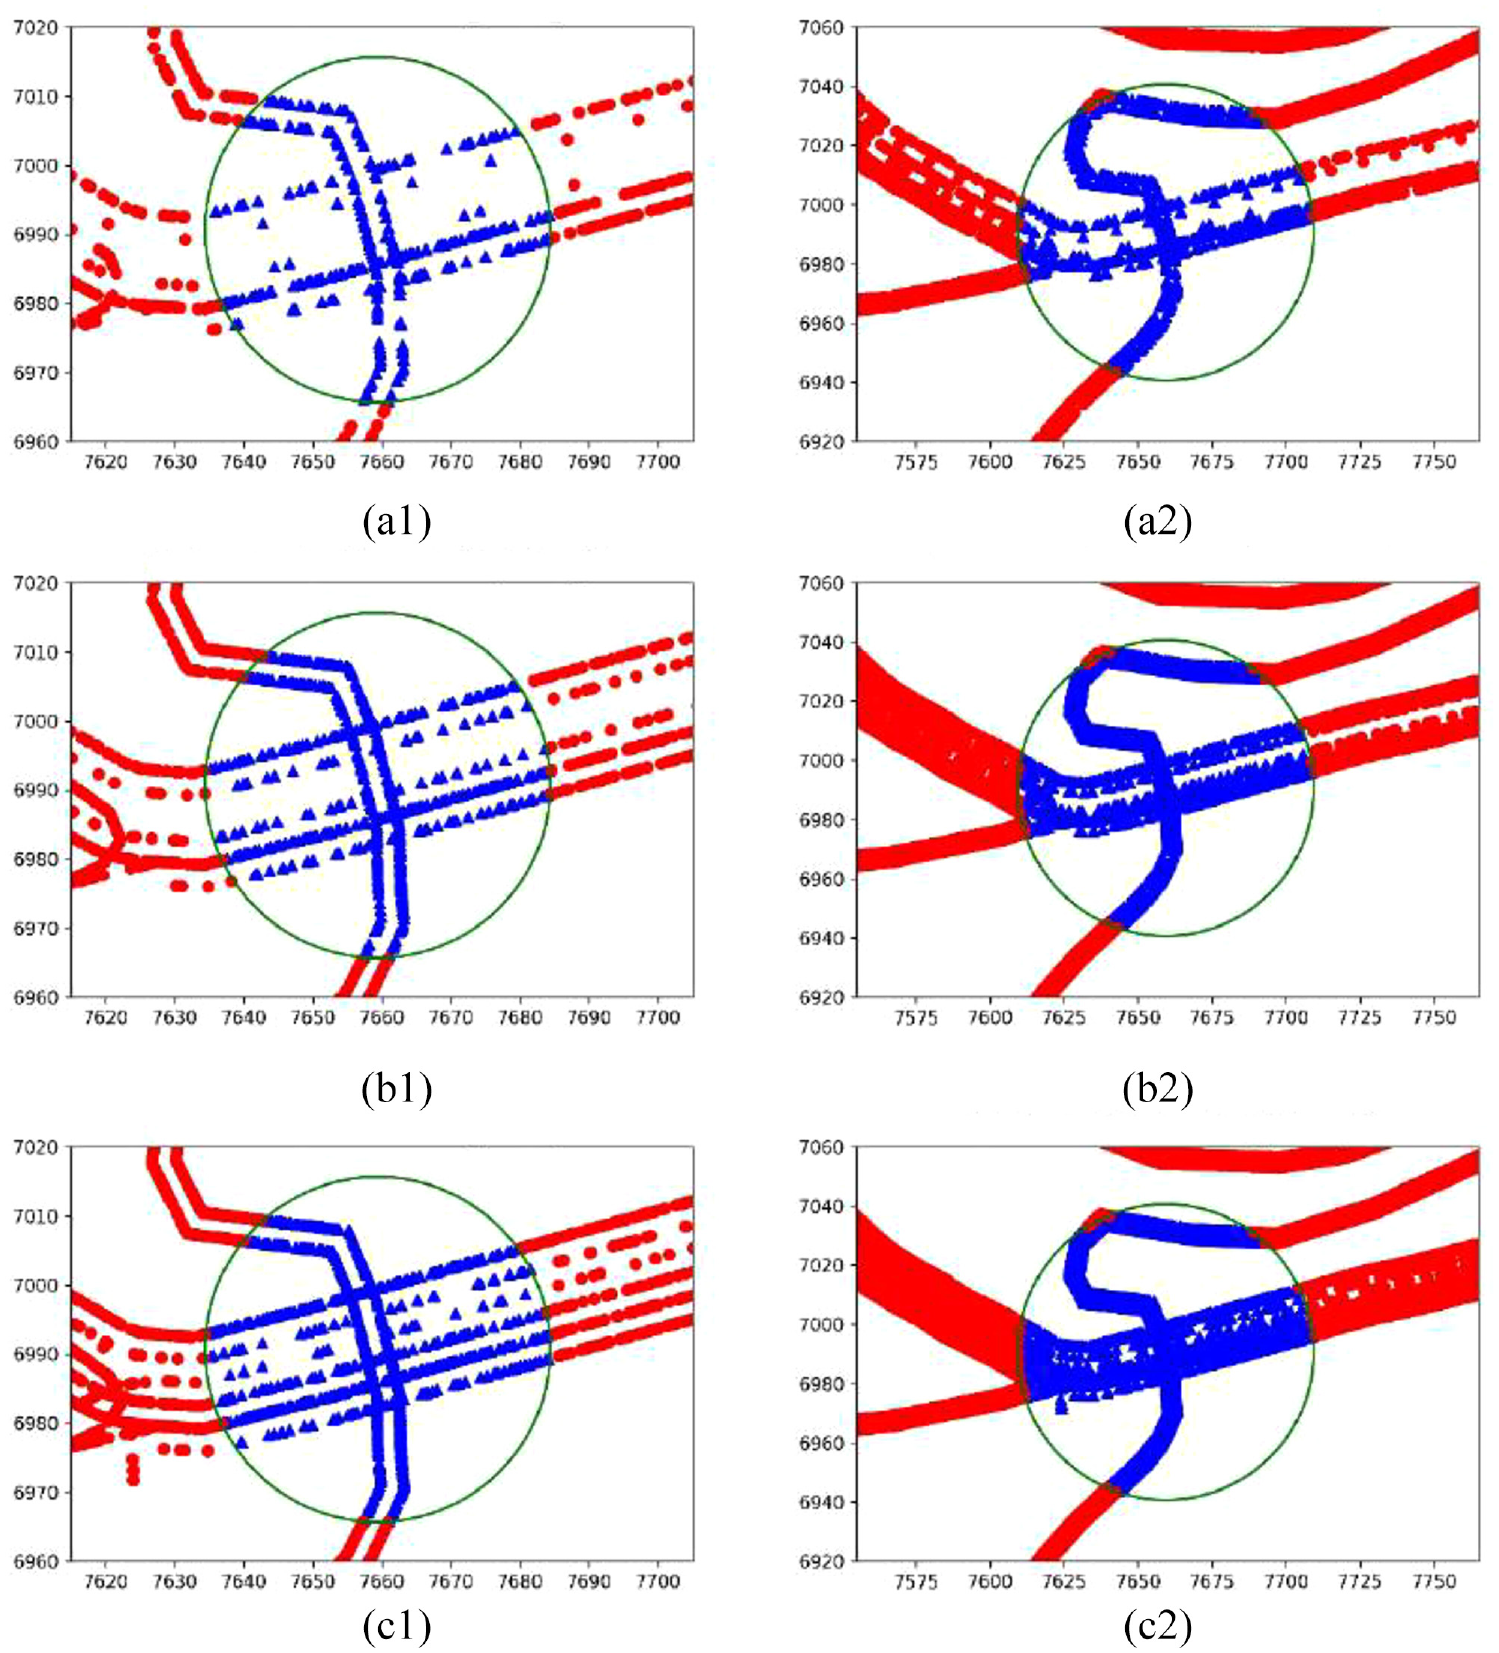
Number of vehicles inside the Schlassbréck Bridge region with different radius length and vehicle traffic conditions: (a.1) low traffic conditions, RoI with radius of 25 m, (a.2) low traffic conditions, RoI with radius of 50 m, (b.1) medium traffic conditions, RoI with radius of 25 m, (b.2) medium traffic conditions, RoI with radius of 50 m, (c.1) high traffic conditions, RoI with radius of 25 m, and (c.2) high traffic conditions, RoI with radius of 50 m.
Building on this, from the moment a vehicle enters the specific RoI, we start a counter to measure the total dwelling time of such vehicle which is stored to calculate the mean,

Histograms of dwelling times in the Schlassbréck Bridge region with different radius length and vehicle traffic conditions: (a.1) low traffic conditions, RoI with radius of 25 m, (a.2) low traffic conditions, RoI with radius of 50 m, (b.1) medium traffic conditions, RoI with radius of 25 m, (b.2) medium traffic conditions, RoI with radius of 50 m, (c.1) high traffic conditions, RoI with radius of 25 m, and (c.2) high traffic conditions, RoI with radius of 50 m.
From this statistical behavior, the main parameter is the CoV that we use to propose a hypothetical distribution. Indeed, to model the system with a Markov chain, we propose to use an exponential distribution if the
CoV of the dwelling times for different locations, traffic conditions, and coverage radius.

From these results, it is clear that for most cases, the CoV is lower than one, with a few exceptions, with a value not much greater than one. Hence, we model the system using an Erlang distribution and for the cases where
Also, using the real vehicle traces, we obtained the arrival rate (
Arrival rate for different locations, traffic conditions, and coverage radius.

Parameters of the Erlang distribution
We now explain in detail the procedure to find the Erlang parameters. It is well known that the Erlang distribution can be derived through the sum of
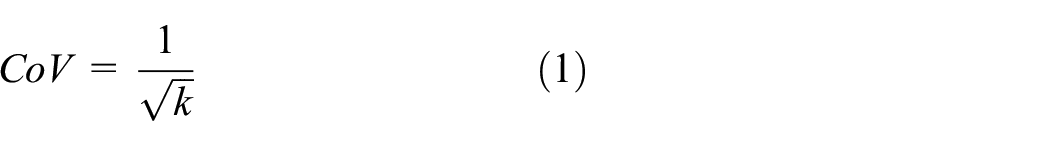
And we also know that the sum of the

Then, solving for


where
Values of
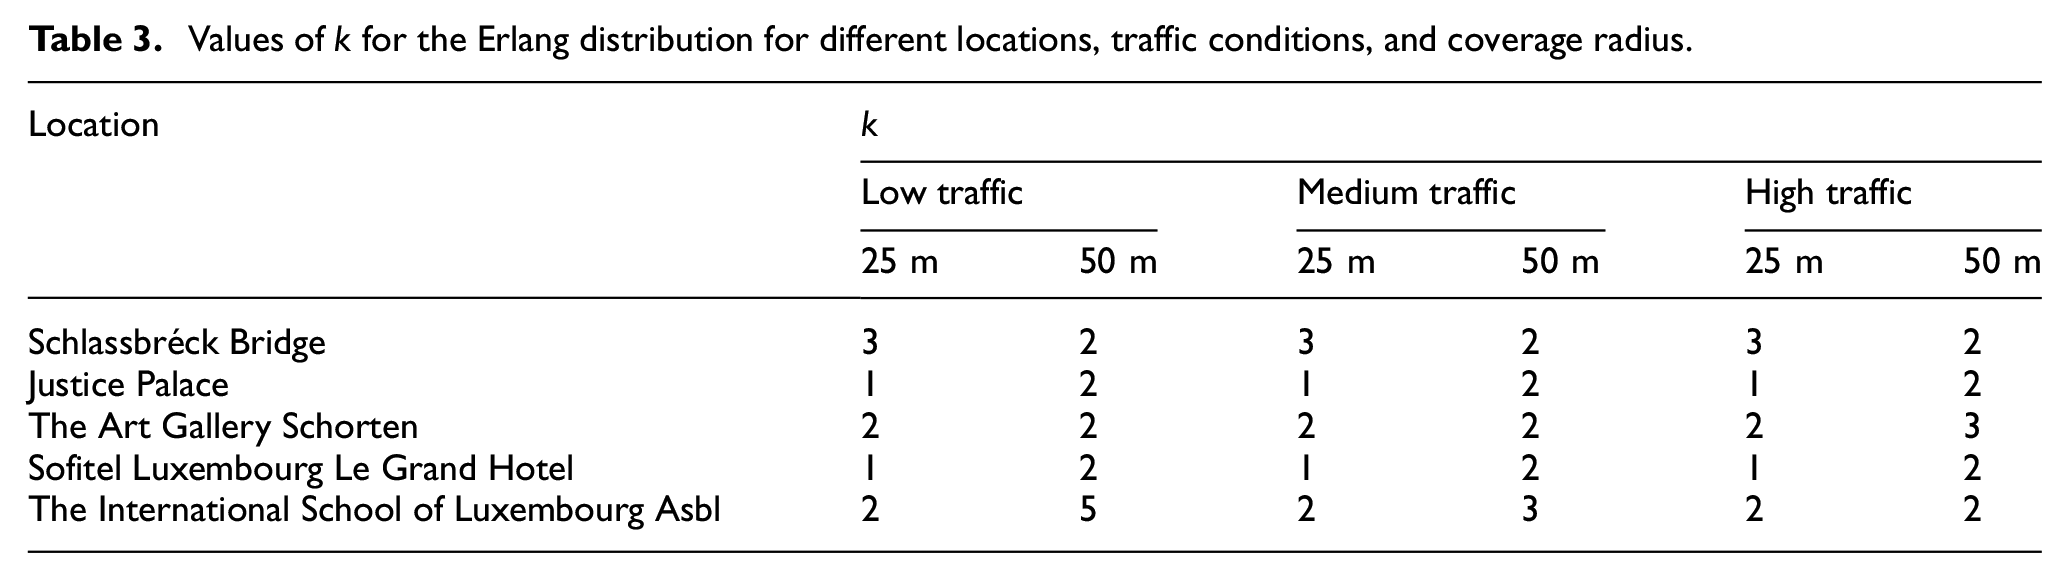
Values of

Teletraffic analysis and system model
In this section, we develop a mathematical analysis to study the performance of the proposed crowdsensing system. To this end, we use the CoV calculated from real vehicle traffic presented in the previous section to accurately model the main dynamics of the system, namely, arrival and departures of vehicles and pedestrians in the RoI and the data packet transmission in the system.
Pedestrian users: infinite server queue
For the pedestrian traffic, we do not have any real traces to model dwelling times of mobile sensors in the RoI. Consider that we focus our study on users in a certain area that offers their resources to monitor certain variables. In other words, these are not conventional pedestrians passing by or in transit to a specific destination. To the best of our knowledge, there are no reported data on the behavior of this type of user. Hence, we use an exponential distribution as a first attempt to model the system.
Building on this, pedestrians in the RoI are the users offering their sensing capabilities using their mobile phones. In this sense, these users receive a message to sense a certain variable inside the RoI collectively. Then, dwelling times of these users are not easy to measure due to the fact that to this date, not many of these crowdsensing applications are in operation. Consider, for instance, that pedestrians were passing by this region on their way to work or school. Then, when an event (petition of the crowdsensing service) is required to be monitored, the pedestrian users may choose to remain longer times in this area, capturing more data until the event is over, or they may just take a few readings and continue their way, or any other behavior in between. To overcome this handicap, we assume an exponential distribution to approximate the pedestrian dwelling time in the RoI. The exponential approach allows a straightforward extension for different distributions, or more specifically, distributions with different values of the CoV, such as the Erlang and hyper-exponential distributions, following a similar procedure to the one used for the vehicular traffic or even another type of exponential-based distributions (phase-type distributions) such as the Coxian distribution.
In addition, we assume that pedestrians can leave the RoI in many different directions since they are not restricted by the street direction or lanes and pedestrians can choose to close or leave the crowdsensing application or simply stop reporting the event by clicking “cancel” in the application, for example. We assume that vehicle users cannot leave the system in this way since they are busy driving. Then, even if the pedestrian is still inside the RoI and has reported data before, the pedestrian may choose to stop the collaboration in the system. Hence, there can be multiple pedestrian departures and the departure rate is directly proportional to the number of pedestrians in the RoI. However, note that based on this exponential assumption for pedestrian dwelling times, we also assume that the departure of these users is a Poisson process. As such, the probability that two or more users leave the system simultaneously is close to 0, 21 as it is considered for the Erlang B equation, for example. Then, although many users can leave the RoI for a short period, the departure occurs one by one.
This can be seen as a queue with multiple servers, that is, pedestrians do not need to wait for the previous pedestrians in the queue to leave before they can leave since they can go outside this region in many different directions.
Vehicular traffic: single server queue
In this case, we do have real vehicle traces that can be used to model the traffic in different conditions and locations accurately. Then, recall that vehicle dwelling times have a CoV different to 1, mostly lower than 1 and in some cases slightly higher than 1, as shown in Table 1. Hence, vehicle dwelling times cannot be modeled using an exponential distribution. Instead, we propose using the Erlang distribution to model dwelling times with
Another important issue is the vehicular environment, the lanes, and traffic direction restrict the vehicle departures. Hence, for simplicity, we consider that vehicles leave one by one, as in the pedestrian case, and the departure rate remains constant due to the movement restriction for vehicles. Also, we assume that vehicle users cannot leave the system by opting out to aid in the event since the user may be driving and have no access to his mobile device. Hence, vehicle departure occurs only by the moving dynamics of the car.
This can be seen as a First-In, First-Out (FIFO) system with a single server. In this case, the lane acts as the attending server.
Complete system
Given this, we develop a Continuous Time Markov Chain (CTMC), depicted in Figure 8, that models the main dynamics of the system: pedestrian arrivals, vehicle arrivals, pedestrian departures, and vehicle departures.

Markov Chain describing all dwelling times using an exponential distribution.
Exponential model
We first consider exponential dwelling times to have a base model that can be further extended to consider distributions with
In state
Vehicle arrival: this occurs with rate
Pedestrian arrival: this occurs with rate
Vehicle departure: this occurs with rate
Pedestrian departure: this occurs with rate
For the states in the frontier of the system, that is, when the system is in state
This Markov Chain is numerically solved to find the stable state probabilities,

Erlang model
We now develop the Markov Chain, where vehicle dwelling times are approximated using an Erlang distribution, which closely matches the statistical parameters of the scenarios where the

Markov Chain describing pedestrian dwelling times using an exponential distribution and vehicle dwelling times using an Erlang distribution.
In state
Vehicle arrival: this occurs with rate
Pedestrian arrival: this occurs with rate
Vehicle departure from phase
Vehicle departure from the system: this occurs with rate
Pedestrian departure: this occurs with rate
Note that the departure rate from each phase of the Erlang distribution is different from the departure rate of the system. In other words, dwelling time in each phase
This Markov chain is also numerically solved to find the steady-state probabilities

for any value of

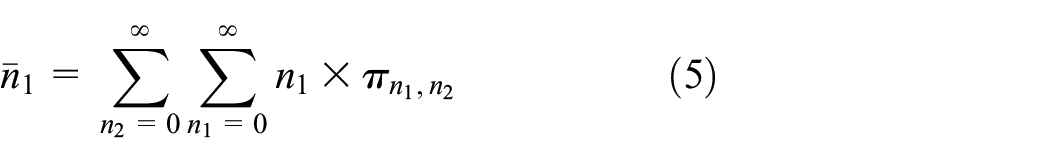
Also, the average number of pedestrians in the region is calculated as

Success packet transmission probability
Since the S-ALOHA protocol is considered in this work, a packet from a pedestrian mobile phone to a vehicle is successful when a single transmission occurs in a time slot at the moment that at least one car is passing by. If multiple cars pass by, all the vehicles receive the same packet, which adds a certain redundancy to the system. If there are no cars at the moment of the packet transmission, the packet is lost since pedestrians are not expected to remain in the area for the crowdsensing process. Also, we assume that all active pedestrians in the RoI (pedestrians who are subscribed to the crowdsensing service, who are inside the RoI, and have accepted to lend their resources for this specific event, that is,

where

Numerical results
We now present the most relevant results to study the QoE of the proposed crowdsensing system, which is analyzed in terms of the success transmission probability, that is, the probability that a mobile device takes a reading with its built-in sensors inside a particular RoI and transmits it without collisions to one or multiple passing vehicles, also inside the RoI at the time of the event.
We first compare the case when the coverage radio is low (25 m), which would represent lower energy consumption to active pedestrians in the RoI. In Figure 10, we present the success transmission probability for different values of the transmission probability of the S-ALOHA protocol,

Success packet transmission probability for different RoI radius and vehicular traffic conditions: (a.1) low traffic conditions, 25 m RoI, (a.2) low traffic conditions, 50 m RoI, (b.1) medium traffic conditions, 25 m RoI, (b.2) medium traffic conditions, 50 m RoI, (c.1) high traffic conditions, 25 m RoI, and (c.2) high traffic conditions, 50 m RoI.
These results show some major points to analyze the QoE that this system can offer in such settings. First, note that for low pedestrian traffic loads, as the transmission probability increases, the success transmission probability also increases since there are very few mobile nodes performing simultaneous transmissions. Hence, the collision probability is also very low. However, as the number of pedestrians increases (higher values of
We now analyze the impact of the number of phases,

Success packet transmission probability for different values of
Then, given this, we can argue that the exponential distribution, with
Conclusion
In this work, we develop a teletraffic analysis to model both the vehicular and pedestrian traffic of potential users registered in a crowdsensing system cooperating to collect data with mobile devices from people walking in an RoI and send this data to passing vehicles in the same region. This analysis considers the main statistical properties of real vehicle traffic by developing a Markov chain using an Erlang distribution to model vehicle departures.
We evaluate the QoE of a crowdsensing system using real vehicle traces in Luxembourg City to accurately model the dwelling times of vehicles in different regions of potential interest in the near future. To the best of our knowledge, no previous works study the system’s performance in terms of the packet successful transmissions from pedestrians to vehicles in such a dynamic and realistic environment.
From the derived results, we can clearly see that the transmission attempts must be carefully calibrated in terms of pedestrian and vehicular traffic. If many active mobile sensors are present, the transmission probability has to be low to avoid packet collisions hindering the overall system operation, while in low pedestrian conditions, this value should be increased.
As such, we can conclude that the crowdsensing applications must be aware of the system conditions to appropriately select the system variables to guarantee an adequate QoE, specifically in such environments where sensors (pedestrians) and intermediate data sinks (vehicles) are mobile and there are few opportunities to convey the required information.
In future works, we plan to investigate the use of fixed sensor nodes in addition to sensors provided by mobile devices of users to improve the system performance. Also, the use of drones to recollect the information is of great interest, with the main objective to reduce energy consumption (compared to the case of using cellular systems) and guarantee the QoE required.
Footnotes
Handling Editor: Peio Lopez Iturr
Declaration of conflicting interests
The author(s) declared no potential conflicts of interest with respect to the research, authorship, and/or publication of this article.
Funding
The author(s) disclosed receipt of the following financial support for the research, authorship, and/or publication of this article: This paper was partially supported by IPN SIP project number 20220736 and 20211164.