
Abstract
With the rapid development of electric vehicles and artificial intelligence technology, the automatic driving industry has entered a rapid development stage. However, there is a risk of traffic accidents due to the blind spot of vision, whether autonomous vehicles or traditional vehicles. In this article, a multi-sensor fusion perception method is proposed, in which the semantic information from the camera and the range information from the LiDAR are fused at the data layer and the LiDAR point cloud containing semantic information is clustered to obtain the type and location information of the objects. Based on the sensor equipments deployed on the roadside, the sensing information processed by the fusion method is sent to the nearby vehicles in real-time through 5G and V2X technology for blind spot early warning, and its feasibility is verified by experiments and simulations. The blind spot warning scheme based on roadside multi-sensor fusion perception proposed in this article has been experimentally verified in the closed park, which can obviously reduce the traffic accidents caused by the blind spot of vision, and is of great significance to improve traffic safety.
Introduction
Traffic accidents can result in injuries and fatalities as well as significant financial losses, and blind spots in vision are one of the major contributors to them. For drivers, blind spots can be formed for various reasons, which can be mainly classified as A-pillar obstruction, moving object obstruction, building obstruction, terrain obstruction, and so on. At the same time, with the rapid development of electric vehicles as well as artificial intelligence, the autonomous driving industry has also entered a phase of rapid development. Some studies have shown that autonomous driving can effectively reduce the rate of man-made traffic accidents and is a safer way to travel than manual driving. The current autonomous driving field can be divided into two major directions: self-driving vehicles and vehicle-infrastructure coordination. 1 The essential difference between the two lies in the distribution of technology and the cost between the vehicle side and the roadside.
Vehicle-infrastructure coordination is to replace some of the on-board units with roadside sensing and computing units to collaborate with the vehicle-side sensing and decision making. The advantages of roadside sensing devices are that they can be installed at a higher height and have an aerial view, so they are hardly blocked and can minimize the number of blind spots, and interact with the roadside data and the vehicle-side data in real time to realize the connected autonomous driving of vehicles. 2
Although autonomous vehicles are equipped with abundant sensors, most of which are mounted on the exterior of the vehicle, the height limitation of sensor mounting and the obstruction of other static and dynamic objects make it impossible to achieve all-round perception within a certain distance. The factors that cause blind spots in the driver’s field of view also apply to autonomous vehicles, except for the A-pillar occlusion. Due to the existence of a blind spot, it is unable to judge the whole driving situation in advance and react in time, which will cause accidents in many cases. This problem must be overcome for autonomous vehicles to achieve commercialization. 3
For instance, if there are obstacles around the intersection as showed in Figure 1, the autonomous vehicle cannot sense some of them through the vehicle-side sensing device, resulting in a blind spot similar to the driver’s. On this condition, if pedestrians or vehicles cross the road from the blind spot, the automatic driving vehicle cannot make timely judgments and actions, so it is very easy to cause traffic accidents. Obviously, using roadside sensing devices to sense and send the sensing results to vehicles for early warning is an effective method, which can effectively reduce the incidence of traffic accidents caused by perceived blind spots.

Simulation schematic diagrams of blind spot warning and all-round perception.
On the other hand, advances in wireless communications allow information sharing through real-time vehicle-to-pedestrian (V2P), vehicle-to-vehicle (V2V), vehicle-to-infrastructure (V2I), and vehicle-to-network (V2N) communications. Vehicle-to-everything (V2X) communications use cases can be mainly divided into safety, non-safety, and infotainment services. Safety services aim to reduce accidents and risks to pedestrians, vehicles, and other road-traffic participants. Non-safety services are used by Intelligent Transport Systems (ITS) to improve traffic management in order to improve the efficiency of the existing road network and minimize adverse impacts of traffic such as congestion and its subsequent impacts on economic productivity and environmental quality. 4
Therefore, this article designs a fusion perception algorithm based on roadside unit (RSU) to achieve accurate real-time all-round perception. Combining the object classes detected by the image with the distance information obtained from the LiDAR point cloud (the laser spots reflected from the laser emitted by the laser emitter onto the objects), the type and location information of obstacles can be sent to the nearby vehicle in real time with 5G and V2X technology for the purpose of early warning. The feasibility is verified by simulation experiments, and it is important to improve the safety of vulnerable traffic groups.
This article is organized as follows: section “Related work” introduces the relevant research status in the fields of object detection, 3D LiDAR point cloud object detection, and multi-sensor fusion. In section “Proposed methods,” the developed fusion algorithms are presented step by step, including the extraction and processing methods of camera and LiDAR data. In section “Experimental and simulation results,” some tests and simulations are conducted to analyze the effect of the proposed methods. Conclusions are drawn in section “Conclusion.”
The main contributions of this article are as follows:
Based on roadside sensing equipments, the sensing data of LiDAR and camera are fused to improve object detection accuracy and sent to the nearby vehicles in real time through 5G and V2X technology, which can effectively reduce the incidence of traffic accidents caused by blind spots in the field of vision.
Through the effective object detection technology, semantic information is extracted and assigned to the LiDAR point cloud based on 2D detection results. Using semantic labels as an important parameter of clustering greatly improves the success rate of clustering.
Related work
Image object detection
Object detection algorithms can be divided into two categories: algorithms based on traditional computer vision and algorithms based on deep learning. 5
Most of the object detection algorithms based on traditional computer vision are based on manual features. The commonly used detectors include VJ (cascade), 6 HOG (Histogram of Oriented Gradient), 7 and DPM (Deformable Parts Model). 8 This kind of algorithm, however, has two limitations: one is the high time complexity and window redundancy caused by its region selection strategy and the other is the low robustness of manually constructed features. These two limitations have been solved in the depth learning.
The image object detection algorithm based on deep learning is mainly divided into two-step detection and one-step detection. The core of the two-step detection is CNN (convolutional neural network). First, the target candidate frame in the image is obtained and then the features of the samples are extracted to obtain more accurate target frame coordinates and category information, which has higher detection accuracy and positioning accuracy. Common two-stage detection algorithms include RCNN, 9 SPP-Net, 10 Fast RCNN, 11 and Faster R-CNN. 12 One-step detection is to directly return the location of the target frame and the corresponding category information, which has a faster detection speed. Common one-stage detection algorithms include YOLO, 13 SSD, 14 RetinaNet, 15 and CenterNet. 16 Now YOLOv5 has achieved the detection accuracy comparable to the two-step detection on the basis of ensuring the detection speed.
The two-step detection and one-step detection have their own advantages in detection accuracy and speed. Subsequently, the fusion network of these two types of detectors has also appeared, which further improves the accuracy and speed of object detection. However, the object detection algorithm based on deep learning has a strong dependence on the computing power of hardware facilities, and the real-time performance of embedded terminal cannot be guaranteed sometimes.
3D LiDAR point cloud object detection
LiDAR 3D point cloud object detection algorithms can be divided into two categories: algorithms based on clustering and algorithms based on deep learning.
Clustering is to partition a dataset into different classes or clusters according to some specific criteria (such as the distance criterion), so that the similarity of data objects within the same cluster is as large as possible while the difference of data objects not in the same cluster is as large as possible. That is, the data in the same class are clustered together as much as possible after clustering, and the different data are separated as much as possible. There are many methods of clustering, including hierarchical methods, partition-based methods, density-based methods, grid-based methods, model-based methods, and so on. The two most commonly used methods are K-means clustering and DBSCAN (Density-Based Spatial Clustering of Applications with Noise) clustering, which are hierarchical-based and density-based methods, respectively.
Laser point cloud 3D object detection methods based on deep learning can be broadly classified into voxel-based methods and point-based methods, which are based directly on the original point cloud. Point-based methods extract features directly from the original point cloud using the PointNet network or their variants. The PointNet algorithm 17 is first proposed by Qi et al. 18 and improved to PointNet++ algorithm. Various algorithms have been derived from this algorithm, such as Point-RCNN 19 and 3D-SSD. 20 Voxel-based methods generally involve transforming the point cloud of the unstructured data into 3D voxels or into a 2D top view grid. The representative algorithms of voxel-based methods are VoxelNet, 21 SECOND, 22 PV-RCNN, 23 and so on. PV-RCNN combines the two methods with innovative improvements.
Multi-sensor fusion
The main sensors used in the autonomous driving industry include LiDAR, industrial cameras, and millimeter wave radar. The three types of sensors have their own advantages and disadvantages as well as the applicable working conditions. To achieve better sensing effect and improve the robustness of the system, two or more sensors are usually used together for sensing.
Multi-sensor fusion perception can be divided into two categories: pre-fusion and post-fusion. Pre-fusion, also known as data layer fusion, fuses the data from multiple sensors at the data layer and outputs the sensory results. Post-fusion is the fusion of the sensory results generated by each sensor’s independent processing through filtering algorithms or graph optimization methods.
Liang et al. 24 proposed a multi-sensor fusion algorithm based on camera and LiDAR. The LiDAR point cloud is transferred to the BEV (Bird’s Eye View) image and then fused with the features of the camera image. The fused images are fed into a deep learning network for 2D and 3D detection.
Vora et al. 25 proposed a fusion perception algorithm PointPainting. PointPainting works by projecting LiDAR points into the output of an image-only semantic segmentation network and appending the class scores to each point. The appended (painted) point cloud can then be fed to any LiDAR-only method.
Proposed methods
As shown in Figure 2, the fusion perception algorithm proposed can be divided into four main steps, including process of image, pre-processing of point cloud, map point cloud into image, and DBSCAN clustering. First, YOLOv5-based algorithm is used to get the classes and locations of traffic participants. And the corresponding areas will be colored to convert the original images into sematic images in this article. At the same time, the LiDAR point cloud is range filtered and ground segmented to obtain the elevated point cloud within the effective range. Then, the LiDAR 3D point cloud is reprojected onto the image by coordinate transformation with semantic information attached. Finally, the point cloud with semantic labels is clustered with DBSCAN, and the 3D size and location information of each detected object are sent to the vehicle for blind spot warning via V2X technology.
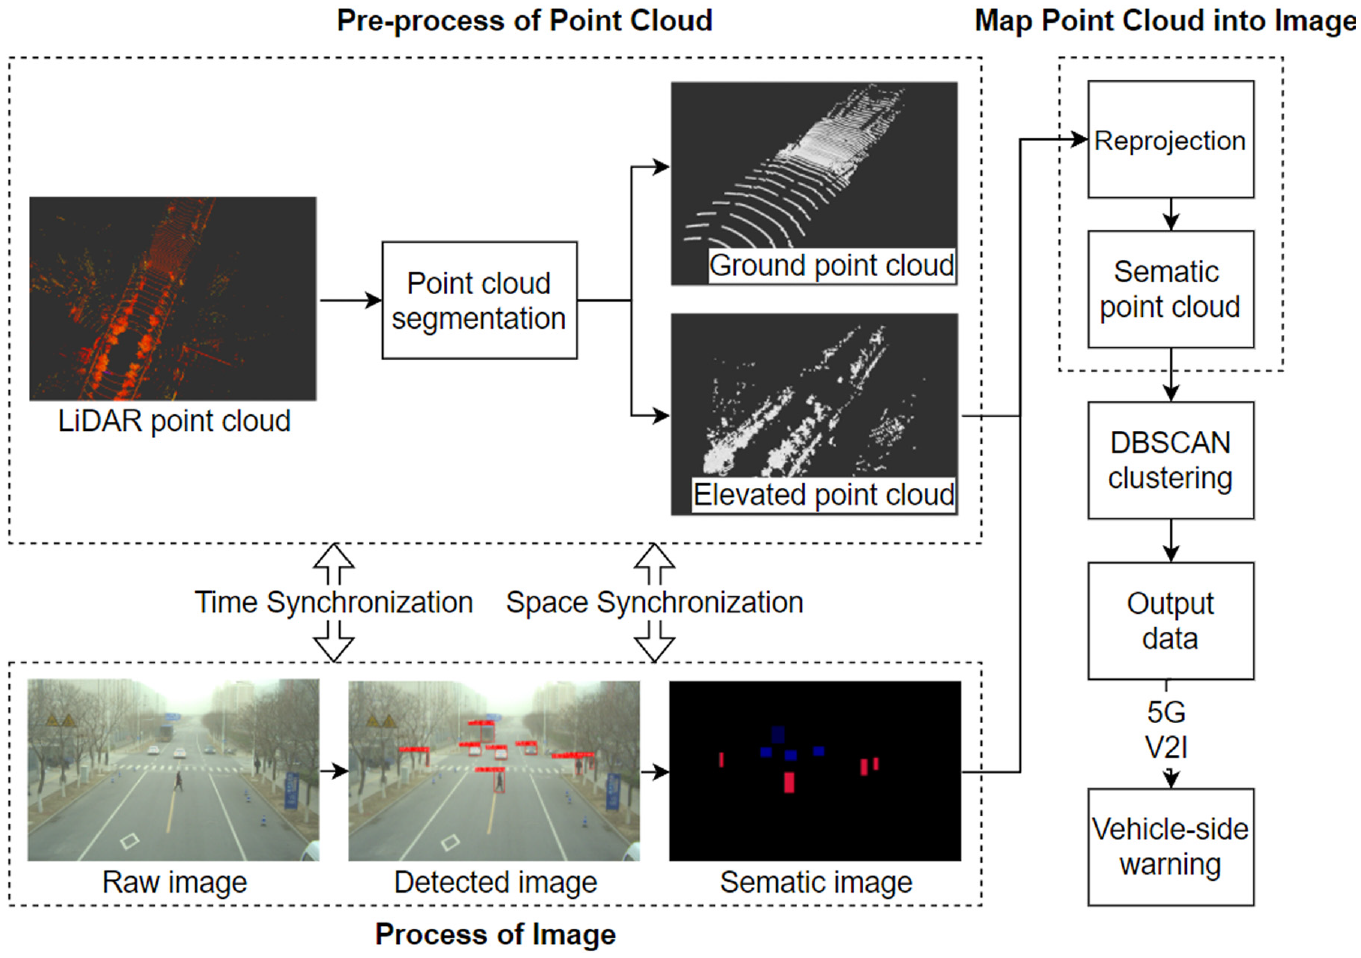
System architecture diagram.
Process of image
This article used the latest YOLOv5 algorithm for object detection. The model was trained and improved based on our dataset to make it more suitable for our usage conditions. After getting the 2D BoundingBox for object detection, the 2D BBox (bounding box) area of the detection result is turned into a semantic area with color. The color of each 2D BBox in the semantic image corresponds to one of the object categories in the detection image. This is in preparation for assigning semantic information to the LiDAR point cloud.
YOLOv5-based detection algorithm was used for object detection, and its network structure as showed in Figure 3 can be divided into four parts: input, backbone, neck, and prediction. To strengthen the feature fusion among the networks, the backbone network adopts CSP1_1 and CSP1_3 structure and the neck adopts CSP2_1 structure. In the input part, Mosaic and Cutout are introduced for data augmentation. Backbone mainly adopts Focus structure and Cross Stage Partial (CSP) structure, where Focus structure is mainly used for slicing operations. In the network model, images with a size of 3 × 640 × 640 are input into the network, and feature images with a size of 12 × 320 × 320 are converted through a Focus slice operation. Then feature images with a size of 32 × 320 × 320 are converted through ordinary convolution operation of 32 convolution kernels. Feature Pyramid Network (FPN) and Path Aggregation Network (PAN) structure are added into the neck. Prediction improves the loss function of boundary anchor box from Complete IoU (CIOU) loss to Generalized IoU (GIoU) loss. And in the final processing process, Non Maximum Suppression (NMS) is used to eliminate the redundant boxes.

Architecture of YOLOv5s.
During each training epoch, referring to the anchor box of initial set length and width, it will automatically learn according to the label of the new dataset. The size of the anchor box is automatically learned from the labels of the dataset, referring to the initial length and width of the anchor box. If the recall rate is greater than 0.98, return directly, or the K-means and the genetic learning algorithm are used to analyze the dataset and get the anchor box preset by object boundary boxes in the dataset.
While running the inference on the model, multiple anchor boxes are generated first, and then, the class information and offset of each anchor box are predicted. Thus, according to the predicted offset, the position of anchor boxes is adjusted to obtain the predicted boundary boxes. Finally, the screened boundary boxes are output.
Pre-processing of point cloud
The proposed algorithm is based on the data layer fusion of image data and point cloud data. That is, the LiDAR point cloud is projected onto the camera image. Therefore, some pre-processing operations need to be done on the point cloud to prepare for the perceptual fusion.
The pre-processing of the point cloud consists of two main steps:
Point cloud filtering—retaining the point cloud within a certain distance of the camera’s view range.
Point cloud splitting—splitting the point cloud into ground point cloud and elevated point cloud by using the RANSAC (random sample consensus) algorithm, corresponding to the foreground and background, respectively.
Point cloud filtering
The horizontal field of view of mechanical LiDAR is 360°, and the detection distance can reach 100 m. The field of view of an industrial camera is relatively small, generally in the range of 30°–90°. With the field of view of the industrial camera as our region of interest, the point cloud scanned by the LiDAR needs to be filtered for the first time according to the horizontal field of view of the industrial camera. According to the actual working conditions, this article sets a reasonable value within the maximum detection distance of the LiDAR and then filters the LiDAR point cloud for the second time. All the points in each frame of the LiDAR point cloud are traversed, and the points that meet the conditions are stored in the queue after judging by the above two filtering operations. The LiDAR point cloud within a reasonable range from the industrial camera view can be obtained by this method.
Point cloud splitting
Using LiDAR for environmental sensing often requires segmenting the ground point cloud to reduce the impact on obstacle clustering. First, the point cloud is voxelized by dividing the XY horizontal plane into grids with equal side lengths and initially determined whether they belong to ground points by comparing the height difference of each grid with the set threshold value. Then, the RANSAC algorithm is applied to fit the ground point cloud to the plane and get two kinds of point clouds after classification—the ground point cloud and the elevated point cloud.
The RANSAC algorithm has three basic assumptions:
The entire dataset contains both valid and invalid points, which can be referred to as inlier and outlier points, respectively.
The distribution of the data can be described by some mathematical models, and the inlier points are the ones that can fit the model and the outlier points are the ones that cannot.
Given an arbitrary set of points (which may be inlier or outlier), assume that the set of points are all inlier and satisfy some mathematical models. The models can be used to estimate the other points, and if enough points can be classified as the assumed inlier points by calculation, the model is reasonable enough.
The RANSAC algorithm will first select several points assumed to be inlier points and then perform several iterations until the number of iterations is satisfied and then exit the loop to get the most reasonable solution for the whole iteration process. The steps for solving the number of iterations are as follows


where P is the confidence, the probability that at least k iterations will result in a correct set of model parameters; W is the probability of randomly drawing inlier points; n is the number of data to be selected to calculate the model parameters; and k is the number of iterations.
The three point clouds after filtered and segmented are shown in Figure 4.

Three types of filtered and segmented point clouds.
Map point cloud into image
Three conversions and one correction are required to convert the LiDAR point cloud from the LiDAR coordinate system to the pixel coordinate system.
There are four coordinate systems in total, requiring three coordinate transformations.
Since the sensing device is deployed on the RSU, the calibration of the external parameters of the camera and LiDAR is based on the RSU. This article defines some rotation and translation matrices as follows
From Figure 5, it can be seen that


Coordinate system transformation diagram.
From the triangle similarity principle

Conversion from the camera coordinate system to the image coordinate system (the principle is small-aperture imaging) results in

Conversion from the image coordinate system to the pixel coordinate system (both have different coordinate origin and axis direction) results in

The parameters required for direct conversion from the camera coordinate system to the pixel coordinate system are the camera’s internal reference matrix

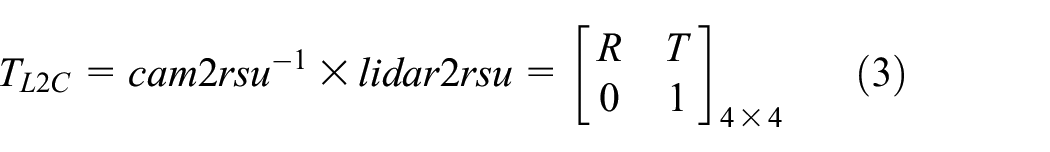
In summary, the equation for transferring point cloud coordinates in the LiDAR coordinate system to the pixel coordinate system is

where lidar2rsu is the rotation translation matrix from LiDAR to RSU; cam2rsu is the rotation translation matrix from camera to RSU;
After reprojecting the point cloud under the pixel coordinate system, color information is attached to the point cloud according to the 2D Bounding Box (BBox) semantic labels where the point cloud is located. Each color corresponds to a different label, and each label corresponds to a different object class.
DBSCAN clustering
DBSCAN is a density-based spatial clustering algorithm. The algorithm divides regions with sufficient density into clusters and finds clusters of arbitrary shapes in a spatial database with noise. And the cluster is set to be defined as the largest set of density connected points. This method is able to find outliers while clustering but is insensitive to initial values and outliers in the dataset.
This article uses a 2D image obtained after point cloud reprojection for clustering. The parameter semantic label is added to the DBSCAN algorithm, and the semantic labels and densities contained in this image are used as qualifiers for the same cluster. After clustering the 2D pixels, the centroids and dimensions of the requested clusters can be calculated.
The steps of the clustering algorithm are shown in Figure 6. From this, the point cloud serial numbers within the same cluster are obtained and converted to the LiDAR coordinate system after inversing the coordinate system. The 3D BBox position and size information of the 3D point cloud in the same cluster in the LiDAR coordinate system are calculated. Once the 3D position and size information of the detection object are obtained, it can be transmitted to the vehicle which is limited by the perceived blind area.
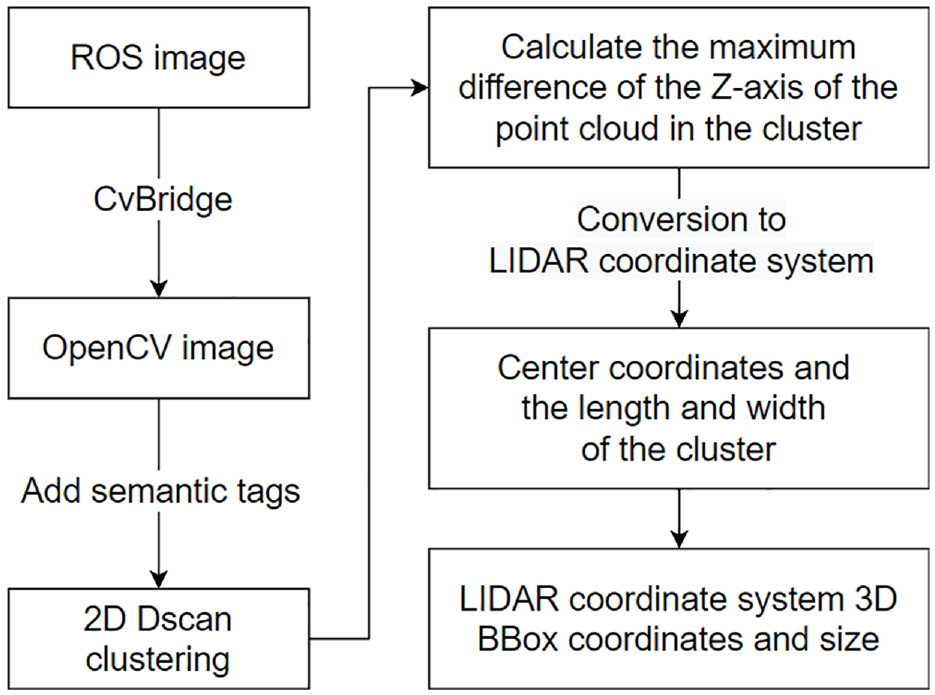
Clustering process diagram.
Experimental and simulation results
Experimental results
The image dataset used is built with videos captured on urban roads and fast roads, including pedestrians, cones, and various types of vehicles (cars, buses, trucks, etc.). The image of a portion of the dataset as shown in Figure 7. All images are saved as jpg with a resolution of 1920 × 1080 pixels. The dataset consists of 18,563 training images, 4641 validation images, and 4641 test images, comprising a total of 326,551 labeled objects. Moreover, almost 20,000 extremely small objects are less than 3 pixels in size since all the objects that are visible to the naked eye have been labeled.

The costom dataset.
The experimental environment was built on Ubuntu16.04, using a NVIDIA A100-40 GB. According to statistics in Table 1 based on the test on 7406 images, the average precision (AP) of this algorithm reached more than 88%, and the precision of bus, truck, van, and cone are over 90%. The recall, however, is a little bit lower. In addition, due to the Mosaic and Cutout data augmentation, the algorithm has a good detection effect on small or obscured objects, which can be seen from the output images showed in Figure 8. Besides, the detection speed is around 20 FPS, which can meet the requirements of real-time detection. Through this step of object detection, the bounding box information of traffic participants in the image will be output.
Detection results of traffic objects.

mAP: mean average precision.
mAP at 0.5.
mAP at 0.5:0.95.
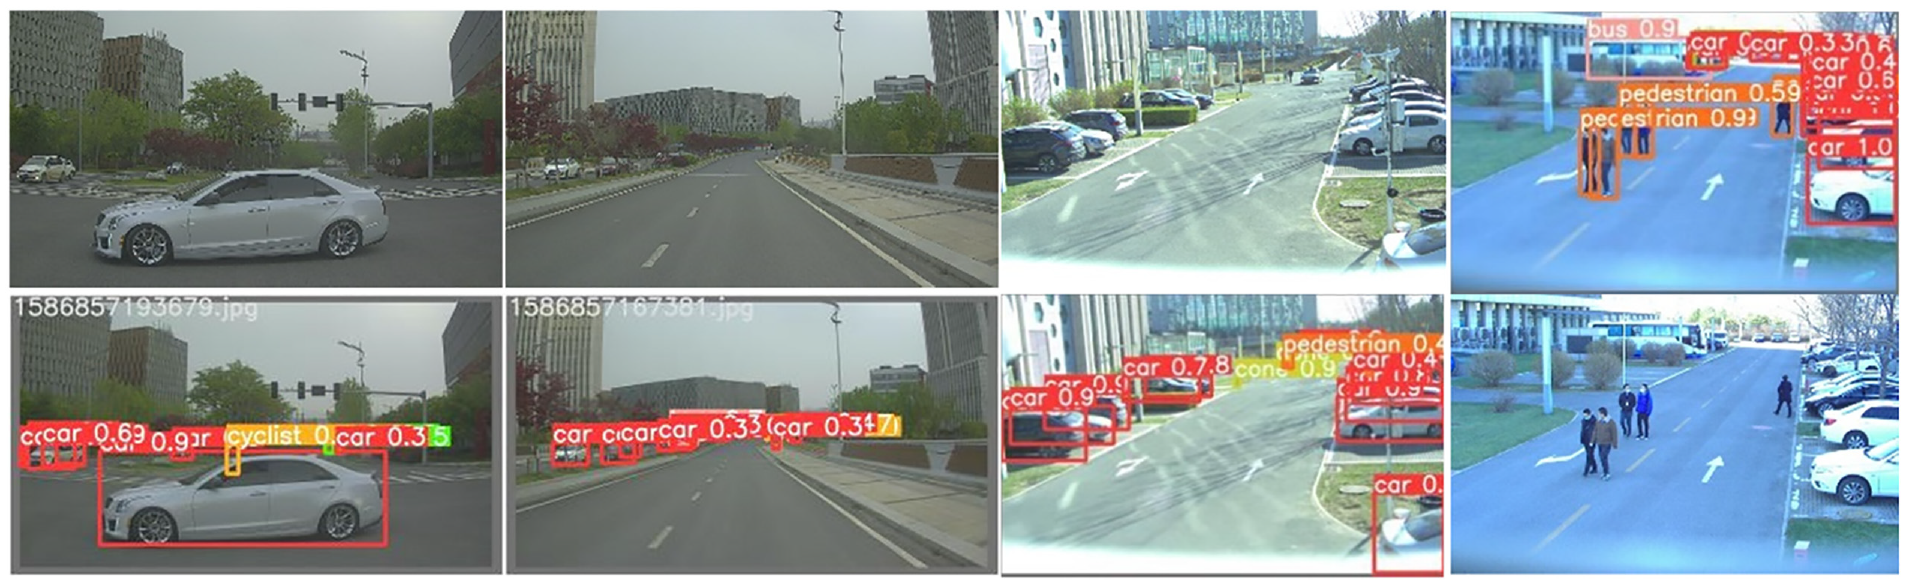
Input and output images of detection.
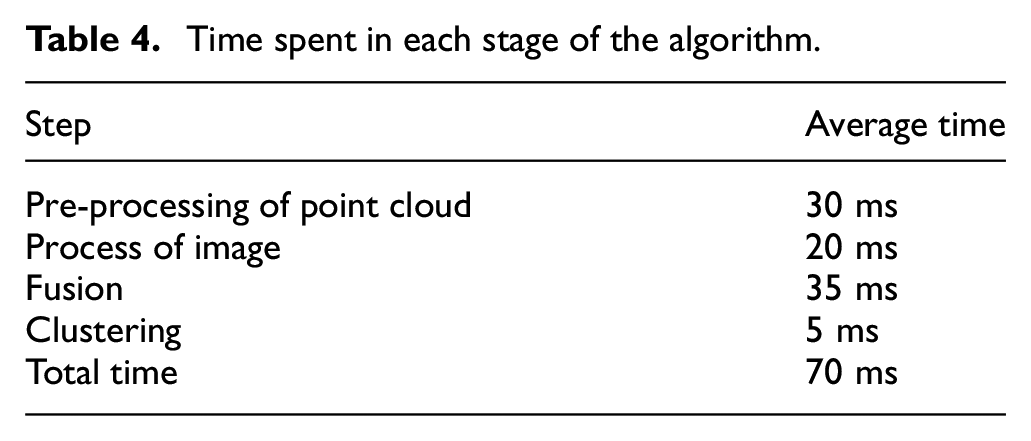
Moreover, in order to test the multi-sensor fusion algorithm under real road conditions, some RSUs are installed on an urban road, including LiDARs and cameras. The models and parameters of the sensing devices and computing platform installed on the RSU are shown in Table 2. Through practical tests, the optimal clustering parameters for pedestrian, car, bus, and truck are shown in Table 3. Side represents the size range in the XY plane, height represents the size range in the Z axis, and Semanticmin represents the minimum confidence level that the test result is considered true. The effect of real-time detection is shown in Figure 9. The upper right figure indicates the result of object detection, the upper left figure indicates the semantic image after conversion of 2D BBoxes, and the lower figure shows the 3D BBoxes got through clustering in the point cloud map. The algorithm time consumption test results of each part are shown in Table 4. In order to improve the speed of the algorithm, the point cloud’s pre-processing and image processing are parallel. The total time of the algorithm is about 70 ms (14 Hz), which meets the speed requirement of the corresponding working condition.
Models and parameters of the sensing devices and computing platform.

FOV: field of view; CPU: central processing unit; GPU: graphics processing unit.
Clustering parameters for objects.

Unit: meters.

Schematic diagram of the effect of the algorithm under real working conditions.
Time spent in each stage of the algorithm.
Simulation results
This article also tested multiple scenarios in a simulated environment, such as intersections, crosswalks, and underground garage exits. The RSUs are able to accurately sense objects in the blind area of the vehicle’s field of vision in all scenarios and send the detection results to the vehicle via V2X technology for early warning.
As shown in Figure 10, a black car is driving on the road with a truck in the right front of it and a pedestrian blocked by the truck ready to cross the road. Since neither the driver nor the sensors on board can sense this pedestrian, the car cannot slow down in advance to avoid the pedestrian, hence it can easily cause a collision. The sensors of the RSU at the intersection can sense all the targets within a certain range, so the pedestrian information can be sent to the black car for early warning via 5G.

Simulation diagram of obstacle avoidance conditions.
Conclusion
This article presents a fusion sensing method based on roadside cameras and LiDAR as well as its application in blind spot warning. The fusion method combines semantic information based on 2D image object detection and LiDAR 3D point cloud data to improve the detection accuracy of traffic participants, such as pedestrians and vehicles. This article uses the dataset collected on some open roads to train the model. According to the test results, the average accuracy (mAP at 0.5) is 78.6%.
The feasibility of the blind spot warning scheme based on roadside multi-sensor fusion sensing is verified by simulations and the application in the closed park. This scheme can significantly reduce the risk of traffic accidents caused by blind areas of vision. The main direction of future research is to fuse the perception data of multiple roadside RSUs, including cameras and LiDARs, to obtain the all-round perception result, optimize the fusion method, and focus on the safety perception warning for vulnerable traffic participants, such as pedestrians and electric tricycle.
Footnotes
Handling Editor: Yanjiao Chen
Declaration of conflicting interests
The author(s) declared no potential conflicts of interest with respect to the research, authorship, and/or publication of this article.
Funding
The author(s) received no financial support for the research, authorship, and/or publication of this article.