
Abstract
Device vulnerabilities emerge one after another in the Internet of thing environment, the attackers attack vulnerabilities on several low-level devices simultaneously by multi-step attack method to trigger the vulnerabilities on other high-level devices to damage or control the information system. Considering the correlation between device vulnerabilities, we proposed a method based on attack graph to evaluate vulnerability risk in order to ensure Internet of thing network security. First, according to the type, version, and other relevant information of device vulnerabilities in the Internet of thing environment, hidden Markov model can be used to model the association between device states. Second, analyze the possible attacks on the vulnerabilities on the device, and generate the attack graph according to the correlation between the device states and the relevant information of the vulnerabilities in the device. Finally, the vulnerabilities are objectively and accurately evaluated according to the attack graph. The experiments results show that the proposed method can map the relationship between devices more accurately and objectively and improve the efficiency and accuracy of the vulnerability evaluation.
With the continuous development of information technology and network applications, the scale of various network attacks and security vulnerabilities is becoming larger and larger, which brings great harm to enterprises and society. Therefore, evaluate the vulnerabilities in Internet of thing (IoT) devices and determine the vulnerability risk is essential to improve the security defense capability of IoT. However, the attacker does not attack the vulnerabilities on a device in the IoT device system in isolation, but uses multiple vulnerabilities to carry out multi-step attacks from different devices and different attack paths, so as to achieve the purpose of attacking a device. 1 In the field of vulnerability evaluation, Hunt and Zeadally 2 proposed using security control and tools to solve Internet security problems. However, the network infrastructure is still frequently attacked. These attacks are often complex enough to combine multiple vulnerabilities to bypass security control. Currently, the mainstream method of vulnerability evaluation is to calculate vulnerabilities according to the vulnerability attribute values given by the authoritative vulnerability publishing platform and the authoritative vulnerability evaluation system. 3 For example, common vulnerability scoring system (CVSS) method evaluates vulnerabilities by attribute groups to show different attributes and harm degrees of vulnerabilities from many aspects. However, it can only evaluate a vulnerability in isolation, without considering the attack path, attack sequence, and the relationship between vulnerability nodes before and after attack.4,5 For the correlation between vulnerabilities, Zhang 6 proposed vulnerability association network which considers not only the risk of vulnerabilities themselves but also the path risk brought by associated vulnerabilities to make vulnerability assessment more accurate. In addition, the risk inside the device is difficult to be quantified in the network environment. When analyzing the security of IoT devices, multi-stage and multi-host attacks must be considered.7,8 In order to ensure the vulnerability assessment of the IoT, the impact of the correlation between different devices on vulnerability attacks must be considered. 9
To solve the above problems, this article used hidden Markov model (HMM) to model the equipment state by consider the correlation between equipment and equipment state, and identify potential vulnerabilities more comprehensively by analyzing the correlation between equipment states. Finally, the attack graph is generated according to the relevant information of vulnerabilities in the device and the correlation between devices. And according to the formula, the attack success probability, attack consequences, and so on of vulnerability nodes in the attack graph are calculated, and the risk value of vulnerabilities is further analyzed. In addition, the relevant simulation experiments in this article further prove that the method proposed in this article can conduct a more comprehensive and more objective evaluation of device vulnerabilities on the IoT, so as to more accurately evaluate the security problems existing in the IoT devices, so as to take corresponding risk control measures to reduce the occurrence of security events in the later stage.
Related work
The HMM
The HMM is the simplest dynamic Bayesian network, can be used for time series data modeling, and is widely used in speech recognition, natural language processing, and other fields. And it is an undirected graph composed of a group of random variables (nodes) and the conditional probability table of each node. 10 As an effective tool for uncertain knowledge discovery and reasoning, it not only overcomes the shortcomings of Bayesian model modeling, but also provides a reference for any form of dependency relationship and uncertainty modeling among multiple variables. 11 At the same time, the HMM is a valuable tool for capturing and modeling data sequences of strings. The states in the HMM are hidden and unobservable. The hidden state has two probabilities: one that provides the probability of change from one state to another, while the other probability is about the state-produced symbol. 12 Zhang et al. 13 proposed the network security risk quantitative evaluation method based on the HMM to introduce the correlations of nodes to solve the problem that traditional quantitative evaluation methods often neglect the correlations and differences of the nodes. And experimental results show that the proposed method can quantify the value of network security risks more accurately, and can discover the vulnerability of the network. The real-time dynamic evaluation of HMM has strong adaptability and expansibility. Using HMM to model the uncertainty between equipment states in IoT is a very important method.
Vulnerabilities evaluation
The main risk assessment methods for IoT vulnerabilities can be divided into static and dynamic at present: static risk assessment methods include probability risk assessment, attack tree, and attack graph; dynamic risk assessment methods include Markov, Petri net, game theory, and so on. 14 The traditional vulnerability risk assessment to assess risk is mainly based on CVSS measurement, attack graph, and so on. The attack graph-based method mainly represents the attack scenario by displaying the possible attack path from the attacker to the target, and models and analyzes the threats in the network, so as to realize the reconfiguration of assets and vulnerabilities to improve the accuracy of the vulnerability identification and strengthen network security.
Many evaluation methods cannot qualitatively describe multi-level attacks and the relationship between attack behaviors. Al-Araji et al. 15 examine techniques that calculate the reachability using a matrix or a hyper-graph to improve computational efficiency on large-scale networks. Treetippayaruk and Senivongse 16 proposed a method to assess security vulnerabilities of the installed and the latest versions based on the CVSS vulnerability scoring system, and the method is better than the model detection method in the spatial and temporal complexity, but the state combination explosion problem of attack graphs still cannot be effectively controlled. However, due to the difference between devices in different subnets are often isolated from each other by protective measures such as firewall. In the process of using the current Internet system device vulnerability evaluation method to solve the problem of cross domain attack, attackers often need to use multiple inherent vulnerabilities on different information devices in the system as a springboard to achieve the attack effect, and it cannot qualitatively describe multi-level attacks and the relationship between attack behaviors. Wang et al. 17 proposed a vulnerability assessment method based on attack graph and maximum traffic that takes into account the factors influencing the attack behavior and relationship between network nodes, and avoiding the repeat calculation and obtaining the potential key vulnerability path fast, the augmented road algorithm is used to find optimal attack path within global path. To solve the above problems, this article analyzes the generated attack graph, and evaluates the vulnerabilities of IoT devices by analyzing the successful utilization and attack effect of each vulnerability, which improves the accuracy and objectivity of risk assessment.
Attack graphs
Attack graph represent a way that potential attackers invade the target network by exploiting a series of vulnerabilities on the device and obtaining some privileges at each step. In the traditional attack graph, the node represents the privileges obtained by the attacker on the network device, and the edge represents the software vulnerabilities used by the attacker to obtain these privileges. 18 An attacker first needs to have a set of privileges on some devices to exploit specific vulnerabilities on network devices. After successfully exploiting the vulnerability on the device, the attacker will gain other privileges and continue to attack other devices in the network, or try to use other vulnerabilities to enhance the privileges on this device. 5 When it comes to large-scale networks, it contains a large number of devices and uses a variety of connection modes. Inevitably, there are vulnerabilities in the network that cannot be noticed by the system administrator, so the attack graph can be generated by the algorithm. Network attack graph can easily display the attack modes of multi-level networks and devices in the form of graph. A probabilistic method to explore the attack graph can also be used to find out the attacker’s intention and possible attack path. 19 By using the mechanism of attack graph, we can clearly understand how the attacker enters the network. 20 This article used the corresponding attack graph algorithm and its tools to generate the attack graph of the network topology environment that to make it suitable for the impact assessment of vulnerabilities in IoT devices.
Method design
Vulnerabilities assessment based on device correlation
Vulnerabilities in the IoT system devices may not only be directly exploited by attackers, but also through the correlation between multiple devices and devices, help attackers bypass attack obstacles of the target system, and gradually gain advanced control authority of the IoT system. Assuming that the terminal has a privilege escalation vulnerability, the attacker can obtain new privileges after successfully exploiting the vulnerability, so that the vulnerability can use the association relationship between devices to attack other devices to obtain more privileges or resources for new attacks. Therefore, it is necessary to consider the attack surface and attack path containing this vulnerability when evaluating the harm of vulnerabilities on devices in the IoT, that is, the association relationship between devices and devices. Attackers access different devices through protocols and ports. The attacker first obtains access rights on a computer in the network, and then launches an attack from that computer, causing attack harm to the next device. And an attacker needs to have a set of privileges on some devices to exploit specific vulnerabilities on other devices in the network. After successfully exploiting the vulnerability on the device, the attacker will gain other privileges and continue to attack other devices in the network, or try to use other vulnerabilities to enhance the privileges of this device.
First, this article obtains the reachability relationship of devices in the network by constructs the network topology environment, and generates the device information list and device reachability information table of the network. Second, the vulnerability scanning tool Nessus is used to scan each device node in the target network to obtain the vulnerability information on the device. And the HMM is used to establish the association relationship between devices. Finally, the network attack graph is generated according to the vulnerability-related information and the correlation between devices, and the vulnerability risk is evaluated according to the attack graph.
Device association modeling based on HMM
In the process of vulnerability hazard assessment between device and device, it is necessary to introduce the potential relationship between device into the calculation method and improve the device attribute standards between device relevance hazard assessment. Generally, an attacker will attack the target in stages when an attacker makes a penetration attack on the target and will not complete the attack on the target in a single attack. An attack scenario is composed of a series of continuous attacks with causality and each attack in the scenario paves the way for subsequent attacks. Therefore, it is necessary to establish the correlation between devices. First, scan the vulnerabilities on the target device, and then use the association relationship between the device and the device to obtain the vulnerabilities on the device associated with the target device by extracting weight value operation of the vulnerabilities, and conduct relevant risk assessment on the vulnerabilities on the device. Hidden Markov can more well model the uncertainty between devices and calculate the association relationship between different devices more accurately. 21
Model design
For the device scanning in the network topology environment, according to the vulnerability information description in the scanning results, the vulnerability types include the vulnerability that can obtain the root permission of the remote purpose device, the vulnerability that can obtain the user permission of the remote purpose device and the vulnerability that can obtain the root permission locally. Attackers can use different vulnerabilities to obtain corresponding permissions on devices, and exploit the association relationship between devices to carry out multi-step attacks and enhance permissions to achieve their own purposes. Therefore, according to the utilization relationship between vulnerabilities and the subsequent use of attack graph generation algorithm to generate state attack graph, the collected network environment information can be formally represented. The specific formal representation process is as follows:
The device information in the network topology environment is represented by the set M = {H1, H2, …, Hn, A1, A2,…, An}, where H or A represents the device number in the network, and n represents the number of devices contained in the network environment to be evaluated.
The device information Hj or Aj is generally represented by the quadruple Hj (Aj) = <Hid, IP, Privilege, Vul>, where Hid represents the network number of the device, IP represents the IP address of the device, Privilege represents the access rights of the attacker or user on the device, and the value of Privilege includes user and root. User is an intermediate access right, which means that the user can access and perform some operations on the device. However, root is the most advanced access right; it not only has all the permissions of user on the device, but also has the permissions to access all files on the specified device, modify its system configuration, and so on. Vul indicates the vulnerability information on the device.
The vulnerability information in the network environment is represented by the set V = {V1, V2, V3, …, Vm}, where m is the number of vulnerabilities in the whole network after scanning. The vulnerability information Vm is generally represented by the six tuples Vm = <Vid, Hid, CVE, pre, post, distance>, where Vid represents the vulnerability number of the vulnerability in the whole network, Hid represents the number of the device where the vulnerability is located, CVE represents the CVE number corresponding to the vulnerability, pre (root or user) indicates that the precondition for exploiting this vulnerability, post (root or user) indicates that the consequences for exploiting this vulnerability, and distance (remote or local) indicates that the attacker can exploit this vulnerability.
The trust relationship between hosts can indicate whether the hosts in the network are reachable. If it is reachable, it is represented by 1, otherwise it is represented by 0.
Device association diagram
Attack path diagram refers to the vulnerability logic diagram formed by the attacker in the process of using some other vulnerabilities in the IoT environment as a springboard to achieve the final purpose of attack. The association rule between devices is that an attacker may obtain new control operation permissions after successfully exploiting a vulnerability; use the newly obtained permissions as a springboard to attack the devices associated with this device to obtain more permissions or resources for new attacks.22,23 Based on the physical relationship, the association of device nodes emphasizes the logical relationship with permission characteristics between device nodes. According to the topology environment of the network, the connectivity relationship between device nodes can be obtained, equipment association graph (EAG).
Device connectivity refers to the close relationship between the device and other devices, and its calculation process is to quantify the possibility of association between devices. In the actual process of network attack, attackers need to use multiple device nodes to achieve the purpose of attack. In the device association graph, the more undirected edges a device node points to, the closer the connection between the device node and other device nodes, and the greater the probability that the device node is selected as a springboard in the attacker’s attack path. In addition, if the preceding device node of a device node points to multiple subsequent device nodes in the device association diagram, that is, there are multiple undirected edges, the attacker has a variety of attack paths to choose. And the device is selected as a subsequent exploit node, which is related to the distribution of other subsequent vulnerability nodes. When a device node is selected as a step in the attack path, in addition to its position in the device association diagram, the attack degree of the device node itself and the attack degree of the preceding node of the device node should be considered to ensure that the attack path is feasible.
HMM modeling steps
Hidden Markov can be used to model the relationship between device states after obtaining the association relationship between device nodes, that is, the state transition in the network environment can be realized by HMM. HMM can be defined by quintuple
In the process of vulnerability assessment of network environment equipment in this article, for any equipment K in the network, it is assumed that there are n kinds of security states, such as normal, spying, attack and break, and so on, where normal represents the equipment has not been attacked; spying represents the equipment is spyed or scanned, which affects the availability of the equipment and increases the possibility of being attacked; attack represent the performance of the device is seriously affected by the vulnerability, and the possibility of the device being attacked is significantly improved; break represents the device is broken under the influence of the vulnerability. And the above states are represented by G, P, A, and C, respectively.
According to the above symbols and parameter settings, the state probability distribution of equipment K at any time can be solved in the following way. When the device K is at time t, the state probability distribution is

where

where
Evaluation metrics
The node of the attack graph represents a possible attack state what includes host name, user authority, impact of the attack, and so on. Each arc represents a state change caused by a single behavior, which may be executed by attackers, ordinary users, backdoors, and so on. During execution, they use the attack template to describe the consistent attack behavior, and then use the existing attack template to reverse generate the attack diagram of the system from the target state. If the generation is successful, it indicates that there are vulnerabilities in the system, and obtain all possible or existing real attack paths, so as to comprehensively evaluate the security risks faced by the system. In addition, the probability of successful vulnerability attack and the consequences of the attack are calculated according to the attack graph.
In this article, the devices and vulnerabilities in the network environment are regarded as the nodes of the graph, and the directed edges between them represent an attack process. The attack graph can be described as

Then, the risk after the target vulnerability is successfully attacked is

where
Information attack is a process of attack defense confrontation. The success probability of attack is related to the inherent characteristics of vulnerabilities and the ability of attackers. And it is mainly affected by the following factors: the degree of difficulty that vulnerabilities can be exploited (Ui), which can be measured according to the utilization path, utilization complexity and required authentication times of vulnerabilities; the average exposure degree of vulnerabilities (Ei); the average repair degree of vulnerabilities (REi); attacker knowledge (Ki); and attack proficiency (PRi). The success probability of vulnerability attack can be calculated according to the above five factors

The difficulty of pathetic exploitation of vulnerabilities can be calculated according to the general vulnerability scoring system CVSS. The degree of vulnerability exposure and vulnerability repair can be calculated using the Pareto distribution and the Weibull distribution, respectively


where
An enhancement factor

where times represents the number of attacks on vulnerability
The consequence of the attack is that the attacker exploits the vulnerability to attack the device and the ring breaking degree of the device in the IoT environment. The level of attack consequences is related to the importance of vulnerabilities in the device where the IoT environment. The different utilization modes of vulnerabilities and the correlation between vulnerabilities also have an impact on the attack consequences. In addition, the correlation between device states also has a certain impact on the attack consequences. Then, the consequences of the attack are

where
Experiments
It is necessary to build a network topology environment to evaluate device vulnerabilities in IoT, because of the correlation between vulnerabilities and the vulnerabilities will attack devices in the IoTs. Considering the correlation between devices, vulnerabilities can cause harm to devices by multi-step attacks. Therefore, HMM can be used to model the correlation of device states, then generate the attack path of vulnerabilities to devices, and finally evaluate the risk of vulnerabilities. In addition, it is necessary to consider the functional security accidents that may be caused by vulnerabilities and the deployable detection device and protective measures.
Experimental environment
In order to verify the effectiveness and accuracy of the hidden Markov modeling and vulnerability assessment method proposed in this article, the network topology environment is built, as shown in Figure 1. The network includes three subnets, namely, subnet 1, subnet 2, and subnet 3. The specific device included in the subnet includes host, router, camera, and printer, and the functions of these devices are accessible. The network includes six hosts numbered H1–H6, five cameras numbered C1–C5, and three printers numbered P1–P3. And the router is represented by R and the server is represented by S. In this network, hosts in different subnets are isolated from each other by protective measures such as protective walls, and attackers cannot directly attack the target device, but need to take advantage of multiple vulnerabilities on different devices in the system or multi-step attacks on devices, so as to serve as a springboard to attack the network environment.

Network topology.
Results and discussion
First, according to the network topology environment, obtain the reachability relationship of hosts in the network and generate the device information list of the network, the device reachability information table, and device-related information (open port, services, etc.). Furthermore, determine the attack surface which usually includes the default open port of the device, such as port 21 corresponding to FTP (File Transfer Protocol), port 3389 corresponding to remote connection, and so on. Second, online scan some devices in the network topology environment to obtain more information such as device operating system and application service version. Finally, online scan some devices in the network topology environment to obtain more information such as device operating system and application service version.
From the accessibility and access rights between devices in the network environment and the number of accesses to services and ports in the whole process, the association relationship between devices can be obtained. If the devices are reachable, it indicates that there is association between devices. The association relationship between devices is shown in Figure 2, where nodes represent the devices in IoT. And the more connected nodes in the figure, the more important the devices are.
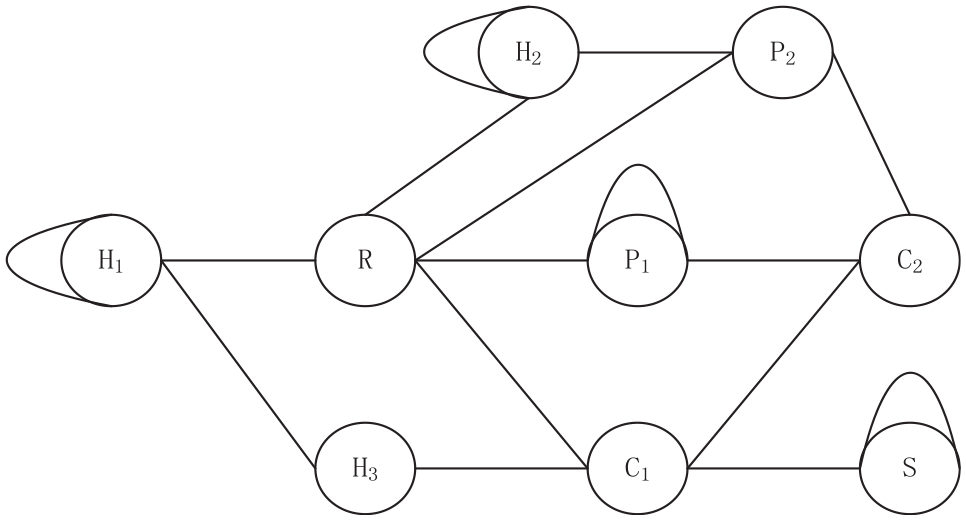
Device association diagram.
According to the correlation between equipment and equipment, the transformation between equipment states can be modeled. The equipment in IoT can be modeled according to the HMM modeling steps proposed above. And the transformation probability between states can be obtained by using formulas (1) and (2). In this topology environment, the HMM of the device is shown in Figure 3.

Device state transition diagram.
In the process of establishing the vulnerability feature library of IoT device terminals, we can use common vulnerabilities and exposures (CVE), china national vulnerability database of information security (CNNVD), nation vulnerability database (NVD), and other leak database information and other available security intelligence to establish. By comparing the device terminal characteristics with the vulnerability feature library, the conventional vulnerabilities of the terminal are found. Second, this article uses Nessus, OpenVAS, and X-Scan vulnerability scanner to scan the vulnerability of device nodes in the above network environment to obtain relevant information about vulnerabilities. For example, the vulnerability number of the device router is CVE-2017-14415 and the vulnerability name is D-Link DIR-850l REV. A cross-site scripting vulnerability, with medium risk level and remote attack. As shown in Table 1, according to the matching between the identified vulnerability information in the device and the information in the vulnerability library, the relevant information of the vulnerability in the device can be identified.
Existence of vulnerabilities in the device.

IP: Internet Protocol.
In the network environment, for the problem of device vulnerabilities being attacked in different subnets, the risk assessment method of attack graph can be used to evaluate it. After a vulnerability is successfully exploited to attack a device, it can cause an attack on other devices according to the correlation between devices, so as to enhance the permissions of the vulnerability or the permissions of the device, and then find the potential attack path. In addition, the algorithm in Wang et al. 17 can be used to change the input parameters, and then generate the attack graph with MulVAL, where the parameters that affect the generation of attack graph are the corresponding information of vulnerabilities, the association relationship between devices, network connectivity, the probability of device state transition, and so on. But the attack graph generated by MulVAL is more complicated, it is necessary to simplify the generated attack graph. Some potential attack graphs in the built network environment are generated, and the correlation between the attacker’s ability and the devices are considered. In the attack diagram, the circle represents the vulnerability, and the number represents the number of vulnerabilities, as shown in Figure 4.

Device vulnerability attack diagram.
According to the above simplified attack diagram, consider the inherent characteristics of vulnerabilities, attacker capabilities, and the correlation between devices. In the network environment, calculate the successful attack probability of each vulnerable node and the attack consequence of the vulnerability according to formulas (3)–(8) above, and then evaluate the risk value of the vulnerability in the whole network topology environment.
Table 2 shows the attack success probability and attack consequences of some vulnerabilities on devices. From Table 2, the vulnerability CVE-2017-14415 exists in device H1, and its attack success probability and attack consequence are 0.242 and 0.22, respectively. The vulnerability CVE-2020-0492 can attack device H2, and the attack success probability and attack consequence are 0.124 and 0.32, respectively. The vulnerability CVE-2017-10796 can cause danger to device H3 through the association between device H2 and device H3, and the potential attack success probability and attack consequence of device H3 are 0.109 and 0.31, respectively. The vulnerability CVE-2018-7903 can attack device R1 through device C1. At the same time, vulnerability CVE-2020-17315 and vulnerability CVE-2017-10796 also can attack device C1. The vulnerability CVE-2018-7903 can attack device S through device R1, and then vulnerability CVE-2018-17907 can attack device S through the potential impact of device R1 that it has the highest attack success probability and attack consequences on device C2, as shown in Table 2.
Existence of vulnerabilities in the device.

Considering the correlation between devices, different vulnerabilities will cause varying degrees of harm to devices. The risk value of vulnerability nodes can be further obtained from the formula (9) in method of this article. At the same time, different vulnerabilities have different risk values. For example, the risk value of vulnerability with serial number 1 is 0.246, as shown in Figure 5. Through the experimental verification of this article, it can be found that the vulnerability risk value measured by this method is more objective and accurate. For example, the vulnerability with serial number 4 has a stronger attack on the network environment. It can attack other devices through the association between devices, causing potential threats to other devices. However, the vulnerability risk value of serial number 4 in this article is slightly higher than that measured by CVSS. This also shows that this method is more objective and accurate.

Value at risk of device vulnerabilities.
From the above simulation experiments, it can be concluded that the vulnerability evaluation method in this article is better than CVSS method. The reason is that consider the correlation between vulnerabilities and devices at the same time, and use the formula to calculate the risk value of vulnerabilities. Compared with vulnerability risk assessment method based on CVSS, this method considers the operation of equipment in the actual network environment in more detail, which can more accurately assess the network security risk, find the abnormal risk of equipment in the network in time, and provide the basis for the formulation and adjustment of network environment protection strategy.
Conclusion
This article creatively proposes the vulnerability correlation evaluation of IoT devices based on attack graph. First, HMM is used to model the correlation between device and device, and the relevance between device and device is obtained. Second, find potential vulnerabilities according to the correlation between equipment and equipment status. Third, use the tool MulVAL to generate the attack graph. Finally, the availability and attack consequences of vulnerabilities are analyzed to further obtain the risk value of vulnerabilities in IoT devices.
The following conclusions can be obtained through experiments:
The HMM proposed in this article can more accurately represent the relationship between devices in the IoT, and can effectively evaluate the security risk of devices in the Internet under multiple attack scenarios.
In the future work, we will integrate rich semantic information and use more effective mathematical methods to build higher-level models, respectively, realize the quantification of vulnerability risk value, further improve the device vulnerability risk assessment, and make the vulnerability assessment value more objective and accurate.
Footnotes
Handling Editor: Yanjiao Chen
Declaration of conflicting interests
The author(s) declared no potential conflicts of interest with respect to the research, authorship, and/or publication of this article.
Funding
The author(s) disclosed receipt of the following financial support for the research, authorship, and/or publication of this article: This research was supported the Fundamental Research Program of Shanxi Province (grant nos 20210302123131 and 20210302124395).