
Abstract
Aiming at the hardware reusability, multi-service carrying capacity, and computing resource limitations of edge devices, a light-weight voltage sag monitoring and classification method based on improved firefly algorithm optimization, extended Kalman filter, and least-square support-vector machine is proposed. The strategy of linearly decreasing inertia weight is introduced to optimize the state error of the extended Kalman filter algorithm and the measurement noise covariance matrix to achieve accurate monitoring of voltage sags. Extract characteristic quantities such as average value, duration of sag, minimum sag dispersion characteristics, number of sag phases, and flow direction of disturbance energy. As a model training data set, the least-square support-vector machine method optimized based on the improved firefly algorithm is used to create a multi-level classification model of voltage sag source to realize the classification of voltage sag sources. This method fully considers the influence of the limited resources of edge computing equipment on the algorithm, and effectively improves the use of computing resources by improving the optimization algorithm. Simulation and experimental results show that this method is suitable for edge computing equipment to monitor and distinguish voltage sags.
Keywords
Introduction
Edge computing is a distributed and open platform that is close to the source of things or data, and integrates networks, computing, storage, and application capabilities. It provides edge intelligent services nearby, and realizes industry digitization in agile connection, real-time business, data optimization, application intelligence, and so on. It solves the huge pressure on the communication channel and the storage computing system of the master station caused by the collection, transmission, and calculation of massive heterogeneous data.1–4 Edge computing adopts the technical framework of “Unified hardware platform + Edge operating system + APP business application software” to improve the real-time performance of business processing through edge computing and reduce the pressure on cloud computing for the communication computing. The power system production business and customer service application functions are flexibly deployed through the software-defined terminal. Due to the computing resource reuse and multi-service parallelism of edge computing equipment, the computing resources of a single service are limited. Therefore, one of the key improvements is to optimize the data processing algorithm and improve the computing power in the application of the distribution network.
With a large number of new power loads such as new energy sources and electric vehicles are connected to the grid, the grid structure is becoming more complex and voltage sags occur frequently. The increasingly sophisticated and intelligent equipments are becoming more sensitive to grid voltage sags, resulting in the contradiction has become increasingly prominent. Voltage sag has become one of the power quality problems that have been studied by academia.5–7 Voltage sag has become a major power quality problem that both parties of power supply and use, as well as the academic community, are paying close attention to and urgently to be resolved. The voltage sag classification is divided into three parts: monitoring, feature extraction, and type classification. In actual research, one of these parts will be treated as a problem. At present, extensive research has been carried out on the related technologies of voltage sag. The monitoring methods mainly focused on the improved short-time Fourier transform method, 8 wavelet transform method, 9 time–frequency analysis method based on S transform,10,11 non-stationary and non-linear signal method based on the Hilbert–Huang transform, 12 noise reduction and feature extraction methods based on singular value decomposition, 13 and signal processing method based on the Kalman filter (KF) 14 and other technologies. Feature extraction and sag source recognition are concentrated on decision trees, support-vector machines (SVMs), 15 back propagation neural networks, and deep learning and other methods. Among them, the combination of group intelligence optimization algorithm and SVM16–19 and deep learning method20–24 are the research hotspots in recent years, which significantly improved the effect of identifying the type of voltage sag source.
At present, the research methods of voltage sag are mainly run in special equipment for power quality monitoring or laboratory equipment, and the algorithm occupies a lot of computing resources. As distributed hardware devices based on edge computing carry multiple functional modules, the computing resources allocated to voltage sag application software are limited.25–27 The existing algorithm is not suitable for most of edge devices, only the voltage monitoring function can be realized. Therefore, with the increasing number of edge devices deployed on the distribution network side, the study of a light-weight voltage sag source identification method suitable for edge devices has become an urgent problem to be solved.
This article adopts the method combining voltage sag monitoring based on extended Kalman filter (EKF) method and classification based on least-square support-vector machine (LSSVM). EKF algorithm 28 is suitable for voltage monitoring analysis of non-linear filtering due to its simple calculation. Compared with neural networks and SVM,29–33 the LSSVM algorithm 34 can better solve the problems of small samples, non-linearity, high dimensionality, and local minima due to its simple calculation and fast solution. In addition, the firefly algorithm (FA) has the advantages of simpler structure, easier implementation, and fewer adjustment parameters; it also shows good optimization performance when solving multi-modal problems. 35 Therefore, this article is based on the improved FA–EKF–LSSVM algorithm to realize the monitoring and classification of the light-weight voltage sag source based on edge computing. Improving the FA algorithm to optimize the key parameter covariance matrix of EKF and LSSVM, the EKF–LSSVM monitoring and classification model is created. The feasibility of this method is verified by applying simulation and measured data, the results showed that the method in this article is suitable for edge devices with limited computing resources.
Voltage sag monitoring method based on FA–EKF algorithm
The KF can accurately estimate the amplitude, frequency, and phase of the voltage system by observing the signal. However, traditional KF has a certain delay in tracking the sudden change of non-stationary and non-linear signals, and cannot accurately locate the moment of transient disturbance. Therefore, the EFK is proposed for the state parameter estimation of the non-linear system to realize the local linearization of the non-linear signal.
It is impossible to separate the actual power system parameters from the complex power signal containing noise, harmonics, and parameter mutations. The voltage state can only be estimated based on the observed signal.
Principles of extended Kalman filtering algorithm
Consider the non-linear system of Gaussian white noise

where
The EKF algorithm is to perform Taylor expansion of the non-linear function, and then omit the high-order terms, and retain the first-order terms of the expansion terms, so as to realize the linearization of the nonlinear function. Through the KF algorithm, the state and variance estimates of the system are approximately calculated to achieve accurate voltage state estimation. The process of the EFK algorithm is as follows
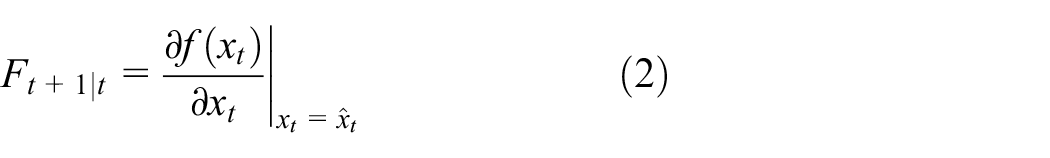

The state prediction of the EKF algorithm is

The prediction covariance matrix is

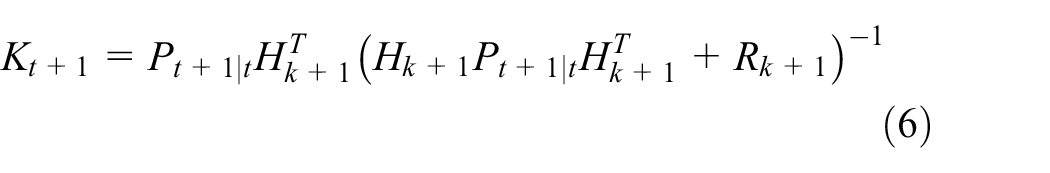
The filter gain matrix is
The status is updated to

The covariance matrix is updated to

where
The voltage state value is a process of continuous recursion. The initial value is corrected through the state estimated value, observation value, and filter gain, and noise and other interference are gradually removed, so that the optimal estimation of the voltage state is obtained.
Improved FA principle
The FA is that a firefly is attracted by all the fireflies whose absolute brightness is greater than it, and the position is updated according to the update formula in the algorithm, continuously iterates until the stopping criterion of the algorithm is met. The absolute brightness in the algorithm is expressed as the objective function to be optimized. Assuming that the objective function to be optimized is d-dimensional, the number of fireflies initialized randomly in the solution space is n, and
The magnitude of attraction between fireflies is absolute by the relative brightness of firefly i to firefly j. The greater the relative brightness, the greater the attraction, the firefly i attracts the firefly j to move toward i. The attraction of firefly i to j can be expressed as

where

where
As the firefly j is attracted, the firefly i moves to it and updates its position. The position update formula for i is as follows

where t is the iteration number,
In practical applications, swarm intelligence optimization algorithms tend to converge prematurely or fall into local optima. Therefore, the strategy of linearly decreasing inertia weight is introduced. Selecting a larger inertia weight value at the beginning of the algorithm iteration is beneficial to the global search of the algorithm. After determining the approximate search range, the inertia weight will be smaller and it is easier to locally optimize near the optimal value, which can improve the convergence accuracy and speed of the FA

where
In order to balance the local search and global search capabilities of the FA, after introducing the inertial weight, the new position update formula is as follows

The inertia weight effectively controls the problem of repeated oscillations near the extreme point due to the excessively large movement step of the individual firefly during the movement of the firefly, which has a beneficial impact on the algorithm.
The existence and attractiveness of other individuals are judged through the luminous intensity and luminous frequency of other fireflies within the effective range of the individual’s perception, and the luminous brightness is related to the current position. At this time, the individual has a bigger attraction, so that it can attract other fireflies with weaker brightness in its range to approach it, and the relative brightness between them is inversely proportional to the distance.
Optimized EKF algorithm based on improved FA
Assuming that the state error covariance matrix Q and the measurement noise covariance matrix R are random values, when the value of Q is large, the uncertainty of the EKF algorithm will increase, and when the value of R is large, it will cause the divergence of the EFK algorithm. Therefore, the state error covariance matrix and the measurement noise covariance matrix in the EKF algorithm are optimized by the improved FA to achieve the optimal estimation of the voltage state in Figure 1.

Optimize algorithm flow of EFK based on improved FA.
First, initialize the improved FA algorithm parameters, the number of population and iterations, the inertia weight, the initial value of the state error covariance matrix, and the measurement noise covariance matrix are set. Then, select the absolute error between the actual measured value
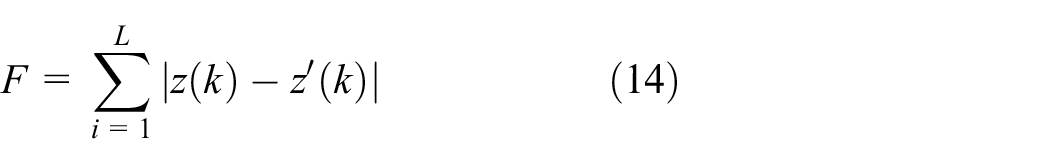
The attractiveness and position of the firefly are updated by improving the FA algorithm, and find the optimal online covariance matrix Q and R of the EKF algorithm value. Finally, the optimized covariance matrix Q and R are used as the input parameters of the EKF algorithm, so as to realize the accurate estimation of the amplitude, phase, and frequency of the voltage state.
Voltage sag feature extraction
When a voltage sag disturbance occurs, the time-domain and frequency-domain information such as the amplitude, probability distribution, frequency component, and main energy peak position of the spectrum will be different. 36 However, there is no uniform correspondence between the sag source and the characteristic parameters. Therefore, the characteristic parameters of amplitude type, slope type, time type, dispersion type, and energy disturbance type are selected for voltage sag source classification. The following parameters are usually considered:
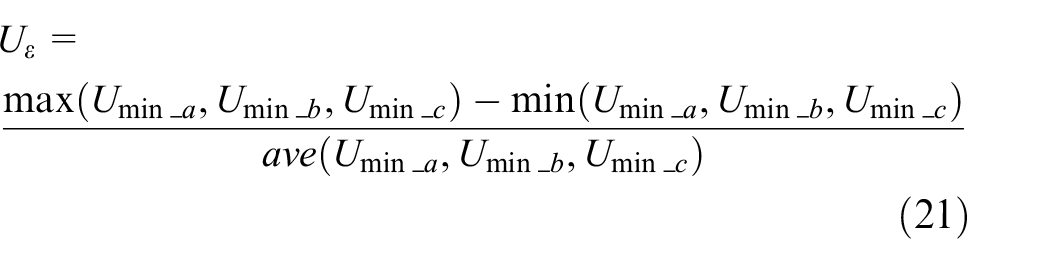
1. Voltage sag minimum value Umin is the global standardized minimum value of the effective voltage value during the sag process
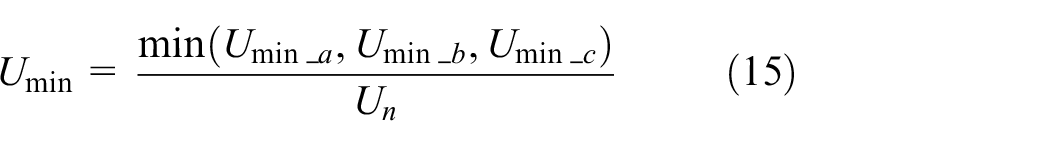
where Un is the nominal voltage, min() is the minimum function, and Umin_a, Umin_b, and Umin_c are the minimum voltages of phase A, B, and C during the sag process, respectively.
2. The average sag Uave is the average value of the effective value of the voltage
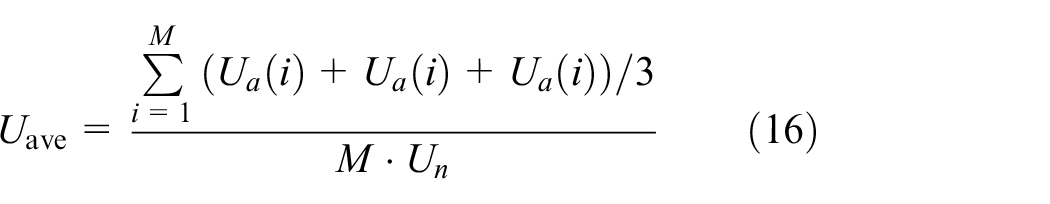
where M is the number of the cycles in the sag process, and Ua(i), Ub(i), and Uc(i) are the effective values of the voltage of the phase A, B and C of the ith cycle, respectively.
3. The sag duration tsd is the duration from the occurrence to the end of the voltage transient event

where ts and te, respectively, refer to the start time and end time of the voltage sag event.
4. The minimum position px is the relative position of minimum voltage Umin corresponding to the time tmin in tsd

5. The descending slope rdown is the slope from the data point at the beginning of the sag to the data point at the time of the sag minimum

6. The rising slope rup is the slope from the data point at the time of the sag minimum to the data point at the end of the sag event

7. Sag dispersion
8. Sag phase number N is the number of phases where the voltage sag occurs. When the voltage is less than 90% of the nominal voltage, the phase is considered to be a sag phase.
9. Disturbance energy flow direction WDF is the flow direction of disturbance energy during a voltage sag event

where p(t) is the three-phase total active power of the whole cycle during the sag event, and p(0) is the average three-phase total active power of the five cycles before the sag event.
Classification of the multi-level LSSVM based on improved FA
Multi-class modeling method based on LSSVM
Compared with neural networks, the LSSVM algorithm can better solve the problems of small samples, non-linearity, high dimensionality, and local minima. LSSVM processing non-linear classification decision function can introduce a kernel function to convert low-dimensional problems into high-dimensional problems for classification.
The regression equation of LSSVM is represented as follows

where
According the implementation process of the LSSVM algorithm, the optimal classification surface function is as follows

where
The objective function of LSSVM can be expressed as
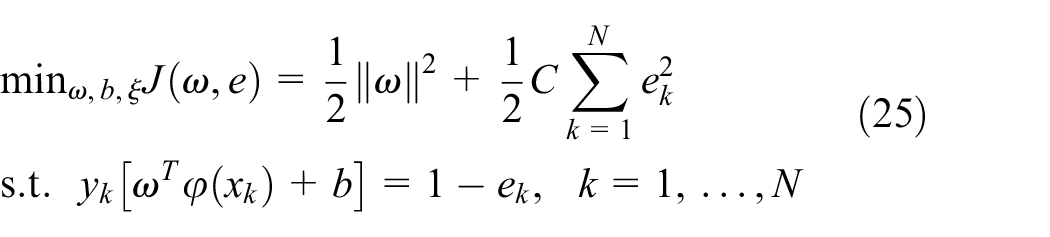
where
The Lagrangian equation is constructed


Through the above Lagrangian function and Karush–Kuhn–Tucker (KKT) optimization conditions, the optimization problem can be converted to solving linear equations
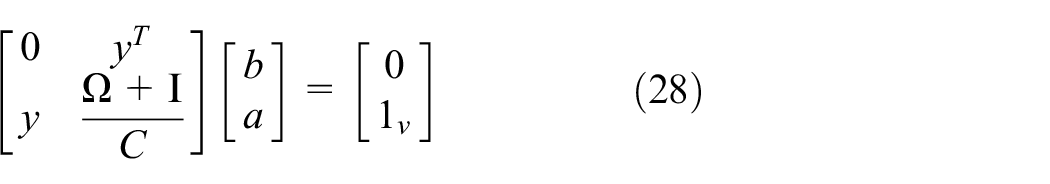
where the
By solving the above-mentioned linear equations, the values of the optimized variables a and b are obtained, and the classification results can be obtained by incorporating the optimal classification surface function.
Since the Gauss radial basis kernel function has the characteristics of a wide convergence range at any reciprocal order, it can make the SVM obtain better performance and generalization. Therefore, the radial basis kernel function is selected as the LSSVM kernel function

where
Due to the limited number of reason of voltage sag, a multi-level LSSVM is used to classify voltage sag source, and the feature vector will be extracted as the input of the multi-level LSSVM. Aiming at n causes of voltage sags, n − 1 LSSVM classifier model is created and trained to realize the classification of multi-level LSSVM.
As linear equations, LSSVM is faster to solve than SVM method, but the prediction accuracy of LSSVM is slightly worse than SVM.
Based on improved FA parameters optimization algorithm of LSSVM model
In order to simplify the calculation, the improved FA is used to optimize the LSSVM algorithm. Generally, the LSSVM model of the Gauss radial basis kernel function has two parameters (kernel parameter σ and penalty parameter C) that need to be optimized, which directly affect the performance of LSSVM. Therefore, based on the principle of cross-validation, the specific steps for the improved FA to optimize the parameters of the LSSVM model are shown in Figure 2:
The parameters of the improved FA are initialized, including the number of population, the number of iterations, the maximum and minimum values of inertia weight, the coefficient of random term, the attraction of firefly, and the light absorption coefficient.
Create an LSSVM model based on the Gauss radial basis kernel function, and set the initial values of the kernel parameter and penalty parameter in the model.
Construct the objective function, use the improved FA to optimize online parameters, and assign the optimal solution to the kernel parameters and penalty parameters.
The optimized kernel parameters and penalty parameters are used as the input parameters of the multi-level LSSVM model. When the voltage sag feature vector is input to the classification model, the voltage sag source type is output.

Optimized algorithm flow based on FA–LSSVM.
Experimental verification and result analysis
Experiment platform
In order to verify the effectiveness of the real-time processing method for voltage sag transient data, a voltage sag monitoring and testing system was built in the laboratory, which includes relay protection source equipment, intelligent power distribution terminal, and analog master station in Figure 3. The intelligent terminal integrates basic operation information monitoring and analysis in the station area, power quality monitoring, demand side management in the station area, low-voltage distribution network operation and maintenance management and control, information model standardization, and coordinated control of the master station terminal. The relay protection source is used as a signal source to generate a voltage sag signal. The intelligent terminal monitors the voltage sag event and generates a record file, which is then displayed by the master station.
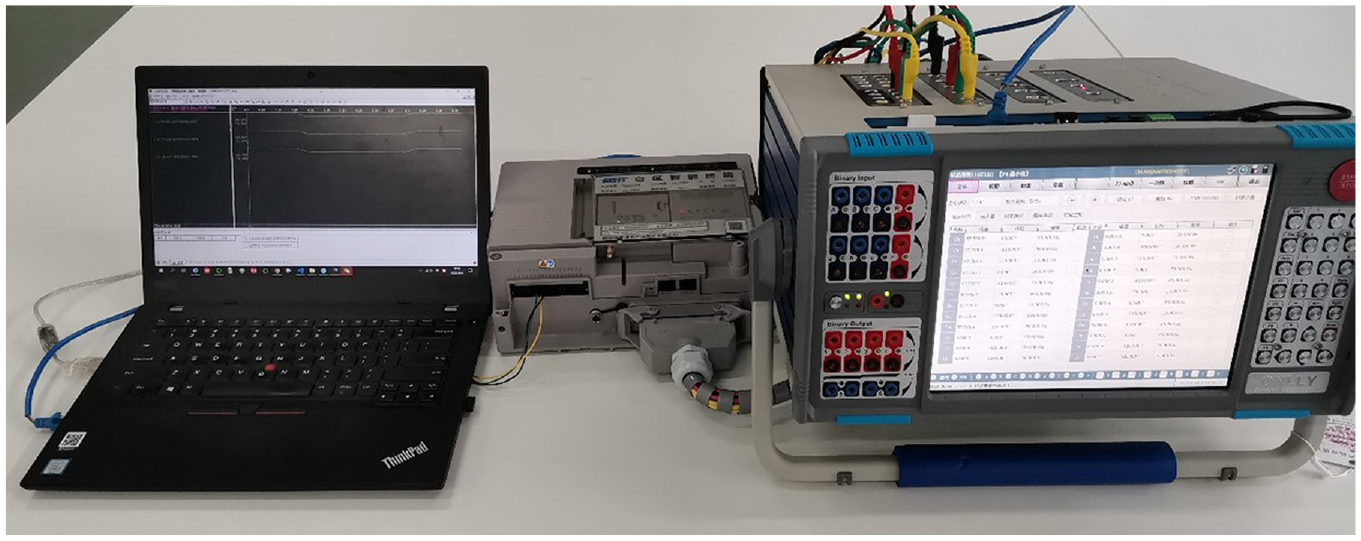
Test system for voltage sag monitoring.
Voltage sag monitoring
The output settings of the relay protection source are as follows: nominal voltage is 220 V, fundamental voltage frequency 50 Hz, amplitude of voltage sag 40%, and duration time five cycles. Symmetrical voltage sag (three-phase sag) and asymmetrical voltage sag (B-phase single-phase sag) are constructed separately, and the measured results are shown in Figure 4. It can be seen from Figure 3 that the intelligent terminal in the station area has a voltage sag monitoring function.

Test results for voltage sag monitoring (a) symmetrical voltage sag and (b) single voltage sag.
In order to verify the accuracy of the voltage sag monitoring of the intelligent terminal, the sag duration is 1, 1.5, 2.5, 10, 30, 150, 2999, and 3001 cycles, respectively. The minimum sag output Umin and the sag duration tsd of the intelligent terminal are shown in Table 1. The error range of the minimum sag is much lower than ±1%, and the error range of the sag duration tsd is also within ±1 cycle, which meets the allowable error requirements of the detection accuracy of the S-level voltage sag monitoring device in the power quality technical specifications.
Accuracy test results for voltage sag monitoring.

Classification of voltage sag source
In order to verify the effectiveness of the voltage sag source identification method based on the improved FA-based EKF–LSSVM method, a data test was carried out through simulated voltage sag data, and the accuracy of the sag source identification was tested and compared with other methods. A total of 32,985 pieces of simulated data were selected for the experiment, including 30,485 pieces of training set and 2500 pieces of test data.
Based on the improved FA–EKF–LSSVM multi-level classifier, five types of sag sources are classified, including sag source orientation (inside and outside of station area), symmetrical faults, asymmetrical faults, motor starting, and transformer switching. Table 2 shows the training and test set information for the classification of test voltage sag sources.
Training and test sets for sag source identification.

Combined with the principal cause analysis method (PCA), the visual analysis of the results after the extraction of the features is performed in the three-dimensional space, as shown in Figure 5.

Feature extraction results based on PCA analysis.
In order to verify the classification performance of the improved FA–EKF–LSSVM classifier, its classification accuracy was compared with the traditional LSSVM, SVM, particle swarm optimization (PSO)–SVM, and genetic algorithm (GA)–SVM classifiers. The results are shown in Table 3 and the judgment accuracy rate of different voltage sag sources is shown in Figure 6. According to the test results of training time, classification accuracy, and classification time, the weights of different method are calculated by configuring different test result weight (0.3, 0.4, 0.3). As a result, the improved FA–EKF–LSSVM method performs better. Although this method has no obvious advantages over other classifiers in terms of model training time, classification accuracy, and classification time for voltage sag, the improved FA–LSSVM algorithm performance is suitable for edge computing devices to classify voltage sags source after considering various factors.
The result of different classifiers.
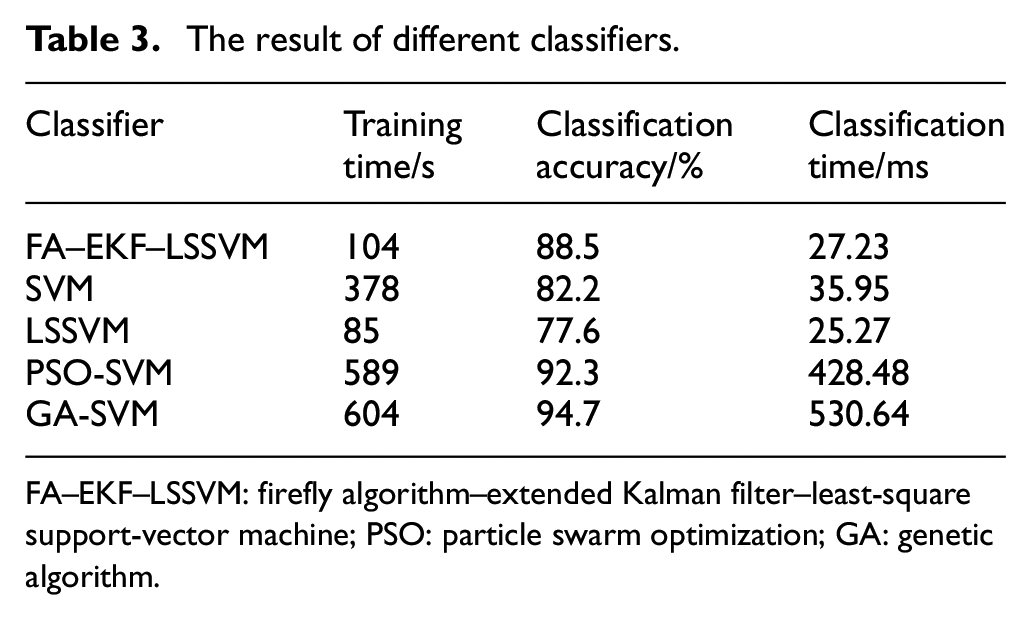
FA–EKF–LSSVM: firefly algorithm–extended Kalman filter–least-square support-vector machine; PSO: particle swarm optimization; GA: genetic algorithm.

Comparison of recognition results of different methods.
Conclusion
This article proposed an improved FA–EKF–LSSVM algorithm, which fully took into account the particularity of computing resources of edge computing equipment in voltage sag monitoring and classification. Based on the analysis of non-linear problems by the EKF method, considering the difficulty of optimization of the covariance matrix, the FA is introduced to optimize the parameters of the EKF covariance matrix to realize the monitoring of voltage sags. Then, extract the characteristic quantities of the voltage sag signal and study the correlation between single disturbances so that the various characteristics quantities are relatively independent. A light-weight voltage sag source classification model based on the EKF–LSSVM algorithm was constructed, and the improved FA algorithm was used to optimize the kernel and penalty parameters of the LSSVM algorithm to create an accurate classification model. The simulation experiment shows that this method can be applied to edge computing equipment to realize voltage sag monitoring and sag source classification, but the advantage of classification accuracy of this method is not obvious. With the further deployment of distributed edge devices on the distribution network side, the combination of edge device pre-classification and cloud-based accurate classification based on distributed data will become an effective mode of realizing voltage sag source classification. In the future, the cloud accurate classification of the voltage sag source based on distributed data fusion will be studied in depth.
Footnotes
Handling Editor: Francesc Pozo
Declaration of conflicting interests
The author(s) declared no potential conflicts of interest with respect to the research, authorship, and/or publication of this article.
Funding
The author(s) disclosed receipt of the following financial support for the research, authorship, and/or publication of this article: This work was supported by the National Key R&D Program of China (2020YFB2104503).