
Abstract
The application of Big Data Analytics is identified through the Cyber Research Alliance for cybersecurity as the foremost preference for future studies and advancement in the field of cybersecurity. In this study, we develop a repeatable procedure for detecting cyber-attacks in an accurate, scalable, and timely manner. An in-depth learning algorithm is utilized for training a neural network for detecting suspicious user activities. The proposed system architecture was implemented with the help of Splunk Enterprise Edition 6.42. A data set of average feature counts has been executed through a Splunk search command in 1-min intervals. All the data sets consisted of a minute trait total derived from a sparkling file. The attack patterns that were not anonymized or were indicative of the vulnerability of cyber-attack were denoted with yellow. The rule-based method dispensed a low quantity of irregular illustrations in contrast with the Partitioning Around Medoids method. The results in this study demonstrated that using a proportional collection of instances trained with the deep learning algorithm, a classified data set can accurately detect suspicious behavior. This method permits for the allocation of multiple log source types through a sliding time window and provides a scalable solution, which is a much-needed function.
Introduction
Security attacks are prevalent as system vulnerabilities are exploited through cyber attackers for financial fulfillment. Destruction of infrastructure and theft of intellectual property are additional motives, which result from Nation-State actors and industrial espionage, respectively. 1 The most skilled attackers are employed by Nation-State actors for launching coordinated and targeted attacks. The recent examples of targeted attacks include Sony, Anthem, and Stuxnet. The time it takes to detect a security breach is measured in days. 2
Cyber invaders are aware of prevailing security pedals and are constantly enlightening possible attacks. Cyber attackers have various ranges of tools accessible, allowing them for bypassing conventional security mechanisms. For example, browser exploit packs, malware infection frameworks on the underground market, and zero-day exploits are widely available. 3 Machine learning (ML) is under artificial intelligence (AI) and has been embraced in various fields, for instance, unmanned aerial vehicle beam selections,4,5 biomedical engineering technologies, 6 and network resource management approaches. 7
Personal information and compromised domains are purchased by attackers for launching extra attacks. As a requirement for security operating time monitoring, cyber protection policy needs the requirement of a cyber-physical system application implementation and proof that it is accurate in relation to the requirement, 8 as shown in Figure 1.

Diagrammatic presentation of online and offline runtime security monitoring. 8
A security hole is unavoidable; the initial reduction and detection are the superlative defensive mechanism to survive an attack. Prevention and detection techniques are employed by security professionals for reducing the risk of a security breach. 9 A security breach has been defined as any initiative assumed unauthorized by any action involving the use of data mining techniques for intrusion detection. Prevention techniques are emphasized to make it more difficult. Some instances of prevention techniques encompass applying recent security updates, ascertaining a better security policy, launching influential user security literature, and avoiding default configurations. The three policies were followed by all information security policies, which include availability, confidentiality, and integrity. 10 The guarantee approved customers qualified to admittance information systems are known as availability. Confidentiality refers to a set of guidelines that limit which has access to information. Integrity is the guarantee of correct and reliable facts.
Techniques of detection are classified into dual categories, which include anomaly-based detection, attack recognition, and signature-based detection. Networked traffic for current attacks is monitored through signature-based detection techniques but diminishes detection of zero-attacks or else a difference of a current bout or a mimicry attack. 11 Such attacks provide respectable protection against known threats. There are woefully inadequate in their protection against experienced attackers who practice current attack methods and exploitations. Thereby, any security safeguards in place are easily circumvented by attackers. 12
Analytics within big data is the correlation and aggregation of many heterogeneous inputs from various foundations. It has an auspicious role in detecting cyber threats over actionable periods with no or minimal human intervention. 13 In the industry, security analytics is a new trend, as well as preference, and is anticipated to achieve momentum instantly. 14 Determining adequate algorithms needed for one of the many obstacles that must be solved is finding hidden trends in vast volumes of data. Noisy and incomplete data are further factors that must be undertaken. 15 Finally, the massive enterprise-scale data imposed the utmost encounter to achieve effective implementation of security analytics. Conventional approaches differ security analytics by segregating what is normal to abnormal. To be precise, instead of the payload signature or material, the concentration is on the operation. IoT architecture comprises several IoT system building blocks connected to ensure that sensor-generated device data are collected, stored, and processed in the big data warehouse, and that devices’ actuators perform commands sent via a user application (Figure 2).

Diagrammatic presentation of Internet of Things (IoT) architecture.
The objective of this study is to advance a repeatable procedure for detecting cyber-attacks that are exact, scalable, in addition to its being fast. For an explicit image of user behavior through various systems, the method should evaluate multiple data sources. Normal fluctuations are undergoing through user activity patterns within the day usually; those patterns vary from trends that occurred on weekends. The model is anticipated to vary between abnormal user activities and normal fluctuations. An in-depth learning algorithm is utilized for training a neural network for detecting apprehensive user actions. This literature is thoroughly correlated to one form of digital forensics, which focuses on locating proof of illegal activity that hackers have unwittingly left-hand in log files on networks. In contrast to digital forensics, this study focuses on identifying malicious activity patterns and detecting illegal activities in real time. A descriptive analysis of AI is presented in Figure 3.

AI analysis in cyber domain. 15
Related work
In this section, noticed studies have been examined including ML-based algorithms application, followed by the classification of cybersecurity-based machine learning algorithms, and applications of ML algorithms to cybersecurity.
Machine learning-based algorithms application
A few studies depicted developments within the AI in particular the Cyber Domain. An innovative multi-objective differential evolution algorithm-based classifier ensemble for text sentiment classification was introduced. This resulted in high arrangement accuracies for text sentimentality categorization with a 98.86% for the Laptop data set. 16
Using text analysis, text sorting is the field by high-dimensional feature space. Within the study, the extraction of the keywords as the features was tremendously suitable in the classification of text. The study demonstrated the ACM collection (ACM documents), categorization accuracy that was achieved at a 93.80% bagging ensemble of random forest. 17 The experiential results showed that the developed scheme can yield more suitable results for sentiment examination as compared to predictable collaborative methods and three ensemble pruning algorithms. 18
The related model further demonstrated that the ensemble clustering framework outperforms the baseline clustering methods as demonstrated. 19 The investigational outcomes specified further that the bagging and the random subspace ensemble approaches and correlation-based and consistency-based feature selection approaches attain better outcomes in terms of accuracy rates.20,21
A wide range of proportional examinations was further done based on feature engineering schemes and five different base learners in conjunction with ensemble learning methods. According to the experimental results, an ensemble categorization-based system was used that integrated Random Subspace ensemble of Random Forest with four types of features; this produced a 94.43% accuracy of the model.21–25 Based on the demonstrated approach, feature rankings obtained from five filter-based feature selection approaches were accumulated by enhanced Borda-count rank aggregation. The Reuters-21578 and 20 Newsgroups data sets are used during the study scheduled on support vector machines and C4.5 classifier. The model demonstrated better performance as compared to conventional filter-based feature selection approaches. 26
Classification of cybersecurity-based machine learning algorithms
The big data are described by triple traits; this includes the volume, the variety, and the velocity. The volume offers an extent of the data deposited and estimated in petabytes, exabytes, or terabytes. The semi-structured, nonstructured, and structured data are all examples of variety. 27 Structured data usually reside in a data warehouse or database. Photos, text messages, tweets, and documents are examples of unstructured data. Semi-structured refers to the log data. In some instances, key-value pairs are comprised within log data or were deposited in comma-separated values (CSVs) format. 28 The pathologies of big data, whose scale necessitates being far from the tried-and-true approach in use at the time, describe big data. Big data depict problems in terms of data search and processing. The novel encounters need innovative methods and techniques, which include big data analytics or data mining. 29 Data mining techniques are employed through big data analytics to extract actionable observations from the data for making intelligent business decisions. In general, extract transform load is the initial step in BD analytics. This is a stage where data are transformed obsessed by a setup that data mining procedures can understand. 30 The analysis or processing phase integrates a systematic procedure, which includes gathering the shifted data. Finally, the results are presented in the form of a paper. The data mining for large data sets is described using ML methods.
Unsupervised learning and supervised learning are the main common forms of machine learning. 31 Supervised learning is utilized in a case data set of available labeled instances. Classification issues are utilized through supervised learning. The objective of supervised learning is for training the AI for predicting an observation or classifying input correctly. Unsupervised learning is utilized when there is no labeled data set. 32 Unsupervised learning technique is one of the clustering approaches that groups related instances together into clusters. Clustering is a technique for detecting patterns in data. For instance, clustering is executed for classifying an unlabeled data set as well as utilizing the subsequent classified data set for supervised learning. 33
A large variety of instances is covered in machine learning in continuous development, which presents cross-associations and weak boundaries. In addition, different applications and views may drive diverse taxonomies. As a result, rather than relying on a fully agreed classification from the earlier studies, it is preferable to demonstrate an actual arrangement for capturing the alterations among various cyber detection methods. 34 These taxonomies are designed unambiguously for security operatives and it evades the lofty aiming at presenting the best arrangement that can categorize all AI specialists and use ideologies. A domain expert is needed within shallow learning who can accomplish the serious activity to identify the appropriate data attributes before proceeding with the secure lookup algorithm. 35 Deep learning is based on a complex depiction of the input data; it can accomplish traits assortment independently using the method described as representation learning.
Applications of machine learning algorithms to cybersecurity
Intrusion detection aims to use intrusion detection technology to clarify illegal activity on a device or network. Today’s business networks use a variety of network intrusion prevention technologies. 36 The system was conventionally founded on outlines of identified attacks; contemporary distributions encompass additional methods for anomaly recognition or risk detection as well as classification based on machine learning. Two issues are appropriate to the analysis throughout the wider intrusion detection area. 37 A botnet is a network of infected computer controlled by attackers, and it has been used for a variety of illegal activities. Botnet detection aims to find out how compromised machines communicate with external command-and-control servers and the monitored network. Several botnets still exist despite most commercial tools and research proposals that address this risk. 38
Domain names are automatically generated in Domain Generation Algorithms (DGAs) and are usually utilized by an infested mechanism for communicating with peripheral servers to periodically generate novel hostnames. They pose a factual threat to businesses because they can get around protections based on static domain blacklists.39,40 DGA detection techniques are based on machine learning. Malware research is a very important topic since modern malware will automatically generate variations of the same malicious results, but they appear as vastly different possible files. Conventional rule-based malware detection techniques are defeated by certain metamorphic and polymorphic characteristics. 41 Phishing and spam detection are progressively complicated because of the progressive circumvention tactics utilized by assailants for detouring conventional strainers. The span recognition process can be enhanced by machine learning approaches.
Previously, an online framework was created with ML adoption based on virtual memory patterns of access for hardware-assisted malware detection. The proposed approach for conducting the experiments included the use of logistic regressions, a random forest-based classifier, and the supported vector machines. 42 Based on the findings, the study has indicated a true positive rate of a 99% and a fake positive rate of less than a 5%. In addition, classification and malicious detection software was presented with the adoption of machine learning and data mining classification. Both anomaly-based and signature-based characteristics were identified for detection. The findings have indicated that other similar methods were outperformed by the projected method. The k-nearest neighbors and operational codes were used as machine learning classifiers for classifying malware. 43 A graph was used to represent the operational codes and was embedded into eigenspace. Moreover, an ensemble or a classifier was used for classifying vectors as benign or malware, respectively. The experiential findings indicated that the projected archetypal was efficient with a recognition rating.
Deep learning architecture was built for intellectual malware recognition. The authors used an auto-encoder with multilayer restricted Boltzmann machines for detecting unidentified malware. According to the research, a heterogeneous deep learning system will improve overall malware detection efficiency as compared to shallow learning and deep learning approaches. Malware detection, a topical research trend, has intensive on mobile malware in general, as well as machine malware in specific. Along with deep learning, machine learning was a substantial initiative in this realm. 44
Methodology and evaluation
In this section, the methodology and evaluation are presented. This included transformation and data extraction, unsupervised learning, supervised learning, supervised learning entailing measurements, and evaluation, among others.
Transformation and data extraction
This process consists of three subtasks that work together to generate the data sets needed for machine learning. The data collection subtask is responsible for locating, collecting, and incorporating log data from multiple sources into a single repository. Preprocessing is needed to reduce the data set’s size as well as to convert it to a sliding window classifier. In machine learning, feature selection is used to classify a range of features from the data for preliminary evaluation and model training.
A detailed understanding of all available log source types is needed for the purpose of detecting cyber-attacks. The first step in data collection is to interview security experts to develop a list of possible source forms. Depending on their network architecture, the available sources differ widely among institutions. Email activities, data from wireless access points, data from physical facilities, security data, and data from event management and browser activity, on the other hand, are all examples of potential source types. Log files from web applications are also important candidates for consumption. We can create a comprehensive image of user activity across different systems by integrating these data sources into a single repository. The repositories would make it easier to observe user behavior that would otherwise go unnoticed in case the sources were investigated independently.
Unsupervised learning
Unsupervised learning techniques are used in the case the class mark of each data aspect in a data set is unspecified. Clustering is a form of unsupervised learning that involves grouping-related data aspects into clusters or groups.
Supervised learning
The technique of training a computer to correctly identify a paradigm or predict a value based on instances is known as supervised learning. Both training sets for training a model to predict and a test set for evaluation goals are named sets of data used for classifying data. For classification, there are a variety of algorithms to choose from. A renewed predilection has emaciated with current scientific developments in computation power for neural networks.
Measurements and evaluation
The effectiveness of proposed model was assessed through the following performance actions. F-score and Recall are equally important, although accuracy is a broad measure. For instance, the cost is possibly an inconvenience; in case there is no ongoing security incident, an alert is sent.
Initial model
Splunk Enterprise Edition 6.42 was used to implement the proposed system architecture. Spunk’s web interface was used to manually upload the source log files. On the contrary, log files were forwarded via a Splunk forwarder to the Splunk indexer used for storing and parson simultaneously. It should be noted that a Splunk forwarder is further able to receive log data from high-speed appliances that include a firewall via a dedicated transmission control protocol port. The web-based user interface is hosted by the Splunk search for executing interactive searches as well as for presenting the outcomes to the user.
A data set of average feature counts has been executed through a Splunk search command in 1-min interludes. This average data were then uploaded to a CSV file, and the data were exported into the preprocessing module. The 1-min interval was transformed into a 5-min sliding window representation by the preprocessing module. The data were exported to the clustering module, where it was labeled and classified for initial training. Preprocessed data were then directly exported into the deep learning module for incident detection and training the model. The system will generate and update dashboards when detecting abnormal activities mostly in factual time alerts.
The time slot concept was used to create the data sets for modeling the data. The time slot was adjusted at 5 min for both data sets. In the data set, each row comprises average feature amounts for 5 min. A single time slot represented average counts in 3 h of examined log data. This has the impact to mitigate the number of resources required for adding new log files; the system was able to scale linearly by representing all the data for each data set progressively. The log files were extracted from the source systems and transferred to DVD media after compression in this study. This research method was carried out in an offline manner. This study did not include a production disposition. On the contrary, this research can be used in a near-real-time approach. The training and test data sets for this study are built using log files and consist of average count values in a time series format.
The features chosen for machine learning are undertaken based on characteristics from one or more log files. A sparse matrix will be generated after making the selection of the individual usernames or Internet protocol values, which would elevate exponentially the memory requirement. By investigating 3 h of collected data, it becomes clear that such a solution would not be linearly scalable. The Neptune source type was made up of event data from four Windows servers. The W3C extended log file standard is followed by the structure of this source type. This source type contains events that are the result of user email activity. The total number of Hypertext Transfer Protocol (HTTP) Power-On Self-Test (POST) and the attributes extracted from this source form included GET requests.
Results
All the data sets were self-possessed of a minute function totals derivative from a clean log of files. We used the Partitioning Around Medoids (PAM) algorithm because it is a nonparametric alternative of k-means clustering for partitioning a data set. The characteristics that are associated with the usage of ML have been presented in Table 1. Along with it, the source of all the log files related to the features has been enlisted with details. The feature set is like the set that has been used in the prior section, having the add-up of the newly computed areas: wday and dhour.
Features used for machine learning.

HTTP: Hypertext Transfer Protocol; POST: Power-On Self-Test; DHCP: Dynamic Host Configuration Protocol; IP: Internet protocol; IPS: Intrusion Prevention System.
The objective of initiating the new features is to shape the unique user experiences. For instance, a typical pattern of occurrence at the time of afternoon can be distinguished from the occurrence of the night. Thus, it casts serious doubts on its nature as well as increases the likelihood of an invasion. The preprocessing module transforms the data sets that have been provided in Table 2 in the form of 5- min sliding window that is represented via amassing the features aggregates. To obtain elusive volatility in the activities that are not easily observable, the sum was used rather than using mean or median values. Moreover, the preprocessing module brings two other features that facilitate the network that is neutral to distinguish with more correctness the irregular activity due to variation. Notably, these variations can take place typically during the entire day.
Definitions of data set.

The wday and dhour are two new features. The wday is characterized by the ordinal number that is associated with the calendar week from day 0 to day 6. The features of dhour exhibit the hour concerning the time slot of 0–23 as it is stipulated for the preprocessing of all the data sets that are given in Table 3. The act of normalization is executed via preprocessing module, to arrange the data related to machine learning. Normalizing is envisioned to organize the entire feature in the form of a typical range, as it will avert the tendency of the feature to carry higher precedence in comparison with the other feature. All the features were undergone normalization through the usage of Min–Max normalization.
Preprocessing time.

Normalization facilitates the comparison for chalking out the features while using another scale. Moreover, it expedites the required time to organize and prepare the neutral network.
The source log files that were used in this study were anonymized from the intrusions at the point of collection. Subsequently, the data sets were to be given labels. Similarly, irregular activity patterns were found in the data. However, a deficit was found for the sample, to practice a neutral network efficiently. Owing to the volume of data of the log files, to label manually will stipulate considerate endeavors. Therefore, to organize a data set with marking, the PAM algorithm was used, having appropriate numeral illustrations for all the classes. The clustering results of PAM are shown in Table 4.
PAM clustering results.
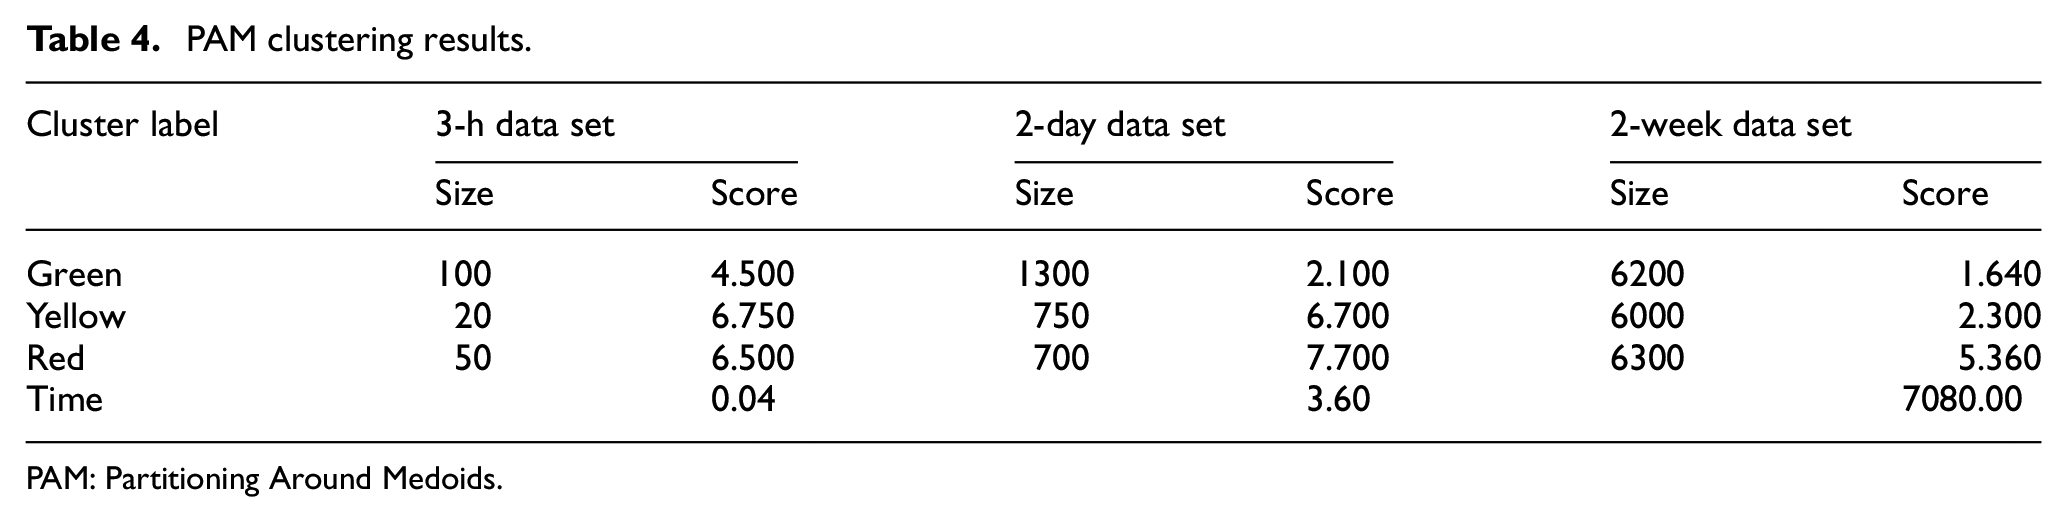
PAM: Partitioning Around Medoids.
To present a typical business review related to the user activity, three classifications were used: red, green, and yellow. They also denote the crucially and urgency of activity. The typical patterns of user activity were shown by green; however, red reflected a higher degree of urgency. Similarly, the attack patterns that were not anonymized or were indicative of the vulnerability of cyber-attack were denoted with yellow. All the data sets were segregated into three clusters and were named via the function of cluster scoring. This score was computed by collecting the cluster’s medoid features. The cluster with the lowest score was colored green, while the cluster with the highest score was highlighted with red. The remainder of the cluster, on the other hand, is colored yellow.
The proposed approach rule-based clustering-based as a unique method to label data as the clustering emanated somehow linear segregation of data. It led to arranging the data in a more complicated and nonlinear equation that could be more able to represent a danger of attack. In addition to it, a subject matter expert can categorize a few events distinguishably in the form of logs. There is no effect of the ruleset on the reliability of these methods. It is due to the experiment that could be swapped with a whole different data set as well as it could obtain the results, parallel to it.
The method employed four rules that overtly pinpointed the features via three dissimilar log sources. The rules were originated through an interview of security analysts during a conversation about the events that could exhibit the potentiality of attacks inside the logs. Through using the classification, the definitional clarification of classification is regarded as the illustration that was like one of the rules was labeled as yellow, whereas the illustrations that were akin to two or more than two were given the label of red. On the other hand, those that did not like any rule were categorized as green color. The findings of the rule-based category are given in Table 5.
Rule-based clustering results.

Aiming to offer appropriate illustrations for all the classes, the quantile function was employed concerning the values of the features. It was determined to build a unique threshold. In this instance, all the illustrations, wherein the Dynamic Host Configuration Protocol explored the values more than 75% quantile, had to be accounted for an attack. The approach was swifter than the PAM clustering. Using PAM for the cluster, the 2-week data set spanned over 2 h where its comparison was made with a rule-based method that had a tie duration of not less than 2 min. Also, the rule-based approach dispensed a low quantity of irregular illustrations in contrast with the PAM method. It can be illustrated from the example that the PAM method with data set 2 showed the activity ratio of 33% in all the clusters where 18% was considered as red or critical.
After labeling the data set, the features were organized in ranks via Information Gain Attribute Evaluator through the Weka approach. In the 3-h data set, a constant value has been associated with the feature of wday. Therefore, it was given the rank zero, and the features that were ranked zero might be eliminated with no effect on the model’ accurateness. Notably, these features were not eliminated due to the experiments of the research. There was a higher ranking of the new features in the other data sets. They were determined through rule-based clustering and were allotted the ranks more than the other features.
The nonlinear method to classify data set is likely to be stimulated through split-level clustering. The data set is partitioned into three clusters using PAM. In the next step, partitioning of the ensuing clusters is carried on using PAM for creating three clusters. These clusters are colored with red, yellow, otherwise, green based on their corresponding cluster-scores. The clusters labeled with colors are used for combining the nine clusters that are used for creating data set. Later, the data sets are used to evaluate the deep learning algorithms by utilizing multiple hidden layers. There is a similarity between spilt-level concept and hierarchical clustering; however, no definite reason for this similarity has been identified.
PAM is the algorithm used for partitioning step 1. In step 2, the tree’s height is used for defining the numeral clusters in hierarchic clustering, while PAM is responsible for specifying the total number of clusters. The hierarchical clustering methods are of two types.
A bottom-like technique is known as agglomerative. It starts with each instance in its own cluster and then links to single cluster.
A top-down strategy that is known as divisive initiates along with the instances in a single cluster. It later subdivides into till it reaches its own cluster.
The final number of clusters in the spilled-level method is controlled by k, where the height is kept constant. This takes place at the second level and matches with the level of user activity which is utilized for further classifying. PAM-labeled data sets are used for deep learning tests with significant variation in the number of neurons that are hidden and range between 2 and 20 in a sole layer. Table 6 shows the results of a single test that is present on each data set. The wday feature is dropped by the deep learning algorithm automatically because of the constant value in the 3-h data set, confusing matrices that resulted for each of the tests. Data set 1 and data set 2 exhibited no false negatives. The larger data set exhibited 10 false negatives, in which only two were considered normal. Data set 1 and data set 2 showed just one false positive. Finally, 17 false positives were shown by a larger data set, where 4 were known as highly important.
Deep learning results via Partitioning Around Medoids-labeled data.

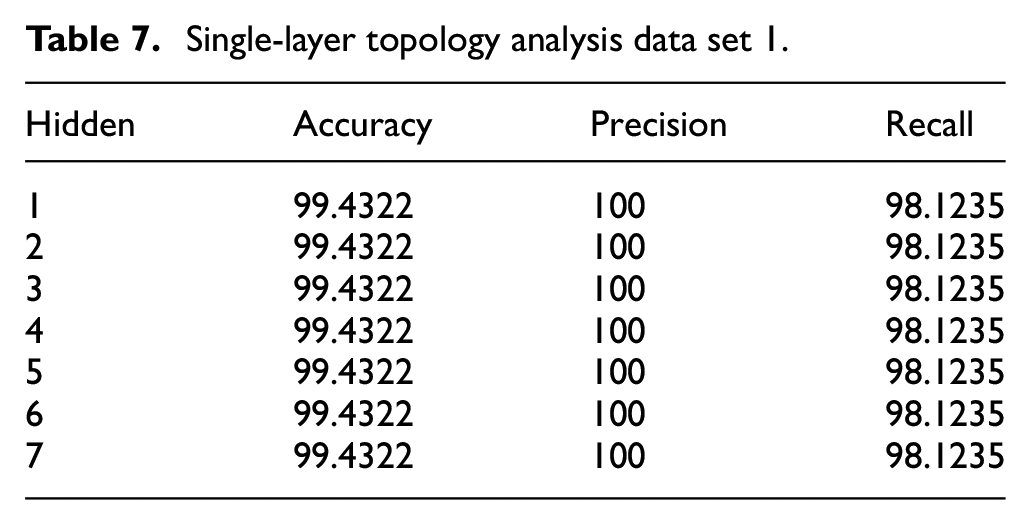
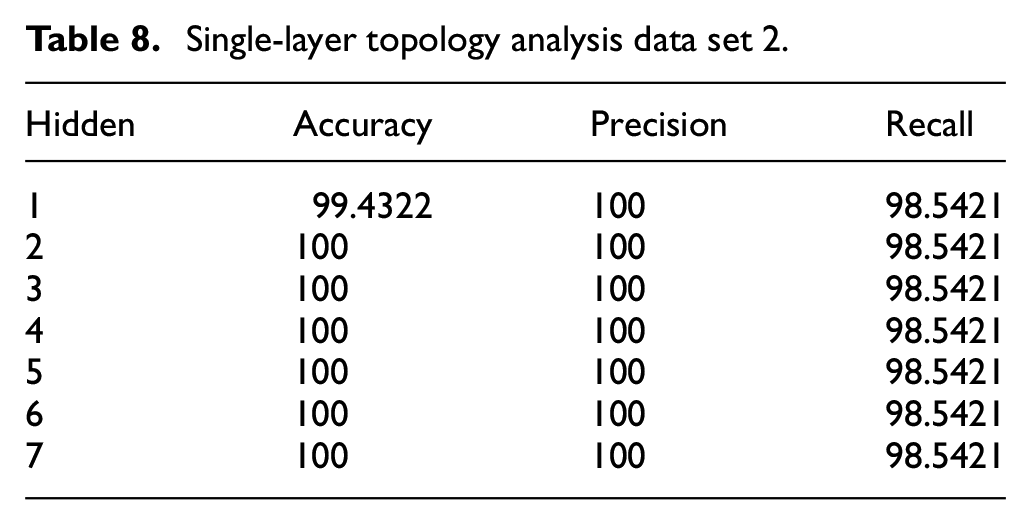
Table 7 shows the single-layer topology exhibiting deep learning grades for data set 1. This data set 1 contains a variety of neuron configurations, while the rest of the parameters are kept constant. Two, three, and four neurons showed no difference in their performance. However, 100% accuracy, recall, and precision are only possible after adding the fifth neuron. Table 8 illustrates the analysis of single-layer topology for data set 2. The best accuracy for data set 2 was presented by the two neurons that were hidden. There was no impact of adding more neurons; however, accuracy was slightly reduced in some of the cases. A total time of 5.69 s was needed for training the model. The highest accuracy of approximately 99.33% was shown by 10 hidden neurons. A total time of 170 s was used for training the model. Moreover, an accuracy of 99.01% was yielded by a single layer of six hidden neurons, which took approximately 54.6 s used for the training completely.
Single-layer topology analysis data set 1.
Single-layer topology analysis data set 2.
Conclusion
The presented results in this study using a proportional collection of instances trained with the deep learning algorithm showed that a classified data set can accurately detect suspicious behavior. This method allows for the allocation of multiple log source types through a sliding time window and provides a scalable solution, which is a much-needed function.
Rule-based labeled data sets were used to conduct deep learning tests. The test varied between different qualities of hidden neurons that range between 2 and 20 in a single hidden layer. There was significant elongation in the time required for training the model with the help of rule-based labeled data sets, as associated with the PAM categorized data sets. For instance, 90.5 s were used by the largest rule-based data set for training; in comparison with the comparable PAM labeled data set which utilized 53.7 s. When comparing the accuracy of PAM labeled data sets to the accuracy of rule-based data sets, the accuracy of PAM labeled data sets was higher. When looking at the red cluster, it was discovered that there were no false negatives for data set 1. Similarly, when classifying data set 2, the red cluster revealed that there were 39 false negatives. Finally, a total of 14 negatives were shown in the classification of data set 2.
Although the other parameters in this data set remain unchanged, this data set contains different neuron configurations. An accuracy of 84.3% was shown in a single hidden layer with five neurons. The test set was classified as data set 1. This data set is for configurations of different hidden neurons. With a training period of 28.1 s and 11 neurons in a single secret layer, an accuracy of 95.47% was achieved. With a training period of 90.5 s and five neurons in a single secret layer, an accuracy of 97.97% was achieved.
An optimal number of neurons were used to add a third hidden layer. In the last two runs, these neurons were discovered. The layer that provided the highest accuracy or F-score was the most optimal hidden layer configuration. With a training time of 39.5 s and a configuration of 16 neurons, an accuracy of 97.2 % was achieved. The secret layer topology of 16, 15 neurons provided an accuracy of 97.8%. The two-layer hidden layer topology yielded a greater accuracy, as compared to the single-layer topology; therefore, it was considered optimal. This resulted in a total gain with 0.6% accuracy by using 20 s of supplementary computation time.
It is recommended that detection of cyber-attacks is the commencement of a long-haul and complex analytical procedure. The security specialist should accomplish risk reduction activities including locking accounts and blacklisting originating source IPs. Any compromised accounts should be identified by examining log files as well as all the resources retrieved by the assailant. Several weeks or even months before the detected activity, all related events must be gathered and examined. Automatic correlation is one of the potential fields of future research.
Footnotes
Handling Editor: Yanjiao Chen
Author contributions
Original draft writing: S. M. M., A. C., W. S.; analysis: A. C., W. S.; software: W. S., L. S.; investigation: S. M. M., W. S.; supervision: S. M. M.; writing—review and editing: S. M. M., L. S., A. C., W. S.
Declaration of conflicting interests
The author(s) declared no potential conflicts of interest with respect to the research, authorship, and/or publication of this article.
Funding
The author(s) disclosed receipt of the following financial support for the research, authorship, and/or publication of this article: The authors acknowledge the support of the Science and Technology Project of Henan Province (Nos. 222102220042).
Data availability statement
All the data sets are provided within the main body of the paper.