
Abstract
Autism is a neurodevelopmental condition that impacts individuals’ communication and social interaction skills. Autistic children often have smaller N170 amplitudes in response to faces than neurotypical children. Autistic children also avoid the salient areas of the face. Technology-based interventions have been developed to teach autistic children how to recognise facial expressions, but the results have exhibited considerable variability across studies. The current study explored the effectiveness of an iPad app designed to support autistic children in recognising facial expressions by examining how participants process facial information through event-related potentials (ERP) and eye-tracking recordings. ERPs and eye tracking were recorded from 20 neurotypical and 15 autistic children aged between 6 and 12 years. The results replicated previous work, with the autistic group having smaller N170 and Vertex Positive Potential amplitudes and more scan time off the face when compared to non-autistic children. Following the intervention, some changes were observed in facial feature scanning among autistic participants, characterised by increased time spent on the face and decreased fixations. These findings add to the work, indicating that eye tracking may be a valuable biomarker for intervention outcomes in autism. Further research into N170 as a biomarker is needed.
Introduction
Autism spectrum disorder (autism, hereafter) is a neurodevelopmental condition characterised by challenges with social communication and interaction, restricted interests, and repetitive behaviours.1–3 Differences in facial emotion recognition and processing, often linked to social communication challenges, have been proposed to stem from altered attention to facial features, particularly the eye region, among autistic individuals.4–9 Researchers employ diverse approaches to investigate how individuals perceive and process facial emotions. Electroencephalographic (EEG) techniques, such as event-related potential (ERP) recordings associated with facial feature processing, focusing on ERPs such as the N170 and Vertex Positive Potential (VPP)9–12 while eye-tracking studies record gaze patterns during facial stimuli viewing.4,8,13–16
Studies combining EEG and eye-tracking paradigms have sought to examine how attentional and behavioural processes correlate to one another across tasks. For example, Wagner, Hirsch, Vogel-Farley, Redcay and Nelson 7 identified an atypical processing pattern from face-specific ERPs to faces and gaze behaviour in autistic versus neurotypical adolescents. Additionally, some studies concurrently record ERP and eye-tracking data to investigate both overt and covert attention while viewing faces.17–19 These studies highlight the objective and reliable nature of combining the measures.17,19 However, there is still little research which uses these methods to explore intervention response with autistic populations.20,21 Integrating eye-tracking and EEG within a translational cognitive neuroscience framework is a scientifically novel methodology recommended for understanding the neural and gaze patterns associated with behaviours and measure intervention effectiveness. 20 The following study explored the effectiveness of an intervention task designed to improve facial emotion recognition through this innovative framework.
Teach Yourself to Learn Emotions (TYLES)
The TYLES task is described in detail elsewhere 22 thus, it will only be briefly summarised here. TYLES was designed as a game-like iPad app, aiming to gradually teach participants to remove tiles from the most salient regions, as this offers the best strategy for recognising expressed emotions. 23 Participants strategically revealed facial regions, primarily the eyes and mouth, by removing tiles one at a time. Their goal was to correctly identify emotions (eg, happy, sad, neutral, surprise, anger, disgust) while minimising the number of tiles removed. Following the successful identification of an emotion, participants received positive feedback.
We hypothesised that the N170 and VPP amplitudes would be smaller in the autistic group and that they increase following intervention. In addition, we predicted that autistic participants would spend more time looking at the salient areas of the face after the intervention. Finally, it was hypothesised that the increased time spent visually scanning the more salient areas of a face correlates with the amplitude increase of the N170 and VPP following the intervention.
Methods
Participants
Participants were recruited through social media advertising, local independent school newsletters, and allied health clinics in the Hunter New England Region of New South Wales, Australia. To be included in the study, participants had to be between 6 and 12 years old and have normal vision. The autistic participants had their diagnosis confirmed by their external clinician. Participants were excluded if they had a history of neurological or endocrine conditions, wore glasses or contact lenses, or had experienced a traumatic brain injury with sustained unconsciousness. Written informed consent to participate in this study was provided by the participants’ legal guardians (Table 1).
Sample Demographics.
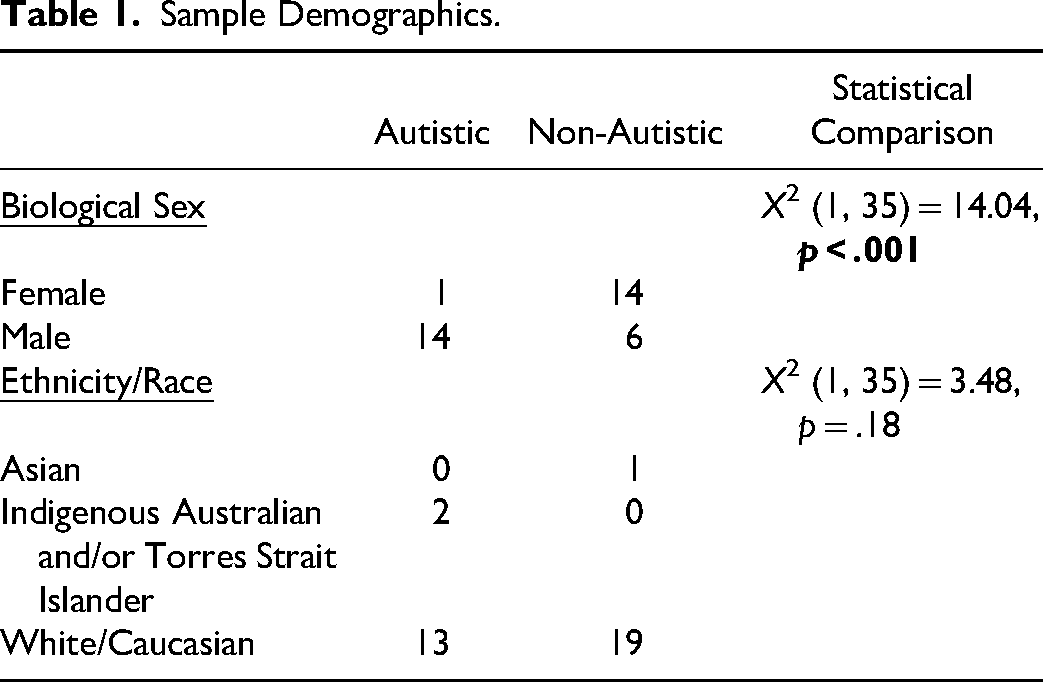
A total of 35 participants were included in the study: 20 neurotypical (non-autistic) and 15 autistic children. The average age was 8.40 years (SD = 1.91). In the autistic group, the average age was 9.00 years (SD = 1.81), while in the non-autistic group, it was 7.95 (SD = 1.90). There was no significant difference in age between groups (U = 104.00, p = .13). Among the autistic participants, eight reported having co-occurring diagnoses; seven were diagnosed with Attention-Deficit Hyperactivity Disorder, and three were diagnosed with Generalised Anxiety Disorder. Three participants had additional diagnoses of Sensory Processing Disorder, Oppositional Defiance Disorder, Obsessive-Compulsive Disorder, Intellectual Disability and Post-Traumatic Stress Disorder. Among the non-autistic participants, two were diagnosed with physical conditions: one with hypermobility and one with Henoch Schoenlein Nephritis/Nephrotic Syndrome.
Stimuli
Electroencephalogram and Eye-Tracking
The facial stimuli for the EEG and eye-tracking comprised 60 colour images of children aged between two and eight years, selected from the from the Child Affective Facial Expression (CAFÉ) set by LoBue and Thrasher. 24 To ensure high-quality stimuli, images were chosen based on a documented high inter-rater agreement (81% to 98%) for expression categorisation within the CAFÉ database. 24 Each facial expression (neutral, happy, angry) was equally represented, featuring male and female subjects.
In addition to facial expressions, object images were included, with an equal distribution of cars, trees, and houses sourced from the Shutterstock website. These images underwent digital adjustments to maintain consistent size, brightness, and contrast. The 120 total trials for faces and objects represented a compromise to keep the recording time short and to not overburden the participants, potentially risking non-compliance. The stimuli presentation for both EEG and eye-tracking was developed using the SR Research Experiment Builder software. 25
Procedure
All autistic participants underwent two sessions of EEG and eye-tracking recordings, before (Time 1) and after two-weeks of the TYLES intervention (Time 2). Participants were asked to use TYLES daily for up to 30 min. Further details about the intervention and user engagement are published elsewhere. 22
Neurotypical children, which were being used as a baseline, only participated in one session of EEG and eye-tracking recordings, and did not receive the intervention. Each recording lasted one hour, with short breaks as required and a snack break between EEG and eye-tracking sessions. The order of EEG and eye-tracking recordings for autistic children was counterbalanced.
Electroencephalogram
EEG recordings were conducted on a laptop computer (Dell Latitude E5570 Intel(R) Core ™ i7-6820HQ CPU @ 2.70 GHz, 2701 Mhz) using the Neuroscan ACQUIRE (Version 4.5.1) software under dimmed lights while the participants were comfortably seated facing the computer monitor (27-inch, screen resolution 2560 × 1440, refresh rate 59 Hz of an Intel(R) Core™ i7-9700 CPU @ 3.00 Ghz 3.00 Ghz Dell computer) at an approximate distance of 60 cm. Participants’ head circumferences were measured, and they were fitted with a 32-channel QuikCap either small or medium in size 26 ; amplified using a SynAmps2 amplifier. The nose served as reference, and the mastoids as active channels. Vertical and horizontal electrodes were placed above and below the left eye and approximately 1 cm aside from each eye to record the eye blinks and saccades. According to the manufacturer specifications, electrodes were filled with recording gel using a blunt needle to maintain impedances below 5 kΩ.
Throughout the EEG recording, participants were instructed to sit still and attentive, focusing on the screen. The recording consisted of a 500 millisecond (ms) stimulus presentation followed by a 100 ms blank screen interval. There were two blocks of recordings, which were approximately seven minutes and 20 s long each. EEGs were continuously recorded at a 1000 Hz sampling rate, filtered through a 30 Hz low pass filter and DC high pass filter. All 32 channels were recorded with a laptop computer, while stimuli were generated by a second laptop computer. Baseline correction was performed by subtracting the average of the pre-stimulus recording 100 milliseconds before the stimulus presentation.
Eye-Tracking
The display screen (27-inch, screen resolution 2560 × 1440, refresh rate 59 Hz of an intel(R) core (TM) i7-9700 CPU @ 3.00 Ghz, 3.00 Ghz Dell computer) presented the facial stimuli for visual scan path recording and the data was observed concurrently on a separate monitor. The participants were comfortably seated in an adjustable chair, 60 cm from the screen, with a horizontal visual field of 29° and vertical of 22.15°. An SR Eye Link camera was centred below the monitor using a desktop mount, configured in remote viewing mode, and tracking the right eye. A ‘tracking’ sticker was placed in the middle of the participant's forehead ensured alignment and permitted the exclusion of a headrest. Each participant went through calibration and validation procedures to confirm accurate eye fixation position and valid eye movement tracking.
Once calibration and validation were confirmed, the visual scanning task was presented. Stimuli were presented for a 6000 milli-second duration each, aligned with procedures previously employed by McCabe, Rich, Loughland, Schall and Campbell 27 and Campbell, McCabe, Leadbeater, Schall, Loughland and Rich. 28 The order of emotional expressions was pseudo-randomized to prevent immediate repetition and to ensure that participants did not see the same emotion displayed on a face consecutively (eg, angry followed by angry). There was also an equal presentation of male and female faces. Following each stimulus, a fixation cross was presented in the middle of the screen to maintain calibration until the camera detected a valid visual gaze threshold. Once the visual gaze was confirmed, the next image was manually presented. If issues arose with the eye-tracking integrity, recalibration occurred, and the task resumed from the previous stopping point.
Data Analyses
Event Related Potential (Pre-Processing)
Artefact rejection exceeding ±100 uV was conducted as a first pass for extreme outliers, followed by the ICA-based ocular artefact removal using Neuroscan EDIT Version 4.5.1. 26 The ERP analysis software guided semi-automated ocular artifact correction within the parameters 400 ms at a capacity of 10% over threshold after manual review of 20 adequate blink responses. Data were epoched by stimulus (faces and objects using the period of −100 ms-500 ms) and baseline corrected from −100 ms-0 ms. Mean amplitude calculations for N170 and VPP were performed for the 150 ms–180 ms post-stimulus onset interval. Each file was grand averaged by condition (ie, face or object). A difference wave function (face-object) was performed to represent the net effect of face versus object responses.
Data from two autistic participants were excluded during the artifact rejection process due to significant interference. However, one of the excluded autistic participant's post-intervention data was included where usable. Additionally, one neurotypical participant's dataset was lost during the data collection process. Homogeneity of variance between both studied groups was confirmed by conducting the Levene's test in SPSS Version 27. 29 Difference scores between the object and face grand-averaged amplitudes (object – face) for the P7/P8 (N170) and Cz (VPP) electrodes were created.
Visual Scanning (Pre-Processing)
Eye-tracking recordings were prepared using SR Research Data Viewer software. Firstly, the areas of interest (AOI) were defined, including the face, mouth, left eye, right eye, nose, whole face, and whole picture. The most salient areas (left eye, right eye, mouth, and nose) were summed to create a new variable (IA_Feature). The proportional fixation time for each AOI was calculated by dividing the looking time on each trial by the total looking time on the whole picture. 28
The data output reports were exported from SR Research Data Viewer and data quality checks for missing fields, duplicates, and formatting issues were conducted. A technical glitch during recording led to the exclusion of two participants’ baseline data: one non-autistic and one autistic participant. In addition, one non-autistic participant's data was lost. No data was excluded based on time off face due to the small sample size and known challenges autistic individuals have with looking at faces.
Combined Analyses
To test the hypothesis, combined analyses were conducted using the ERP and eye-tracking data. Difference scores were calculated for the ERP and eye tracking data, separately, by subtracting Time 1 results from Time 2 results. Spearman's Rank Correlation was conducted to examine the relationships between measures.
Statistical Analyses
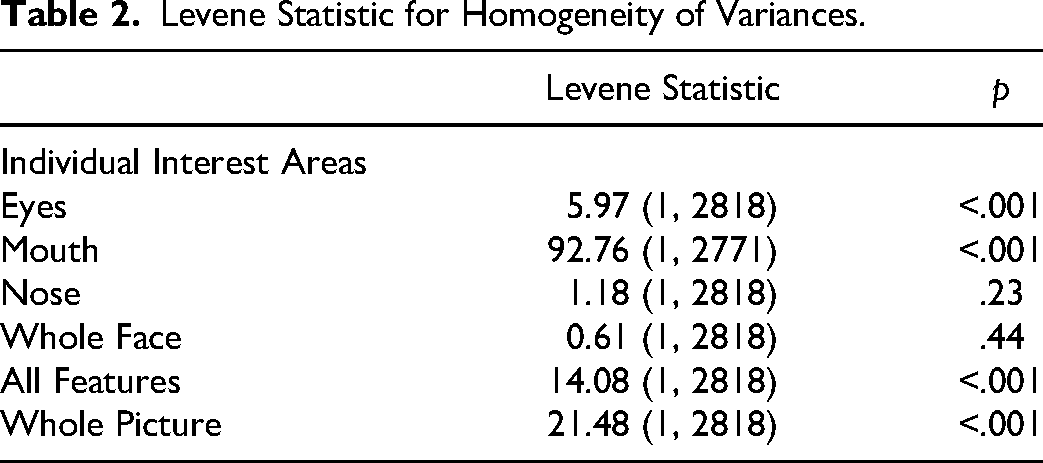
All statistical analyses were performed using SPSS Version 27. 29 The viewing tasks primarily violated normality with skew, and the Levene Test showed that the variances for most created interest areas (eyes, mouth, all features [eyes, mouth, and nose], whole picture) were not equal, except for the whole face and nose. Table 2 below shows the Levene statistic for each interest area.
Levene Statistic for Homogeneity of Variances.
Between-group comparisons were analysed using non-parametric Mann-Whitney U and Chi-Square Tests. Paired Sample T-Tests were used when assumptions of normality were met; otherwise, Wilcoxon Signed Rank Tests were performed. The alpha level was set at 0.05 two-sided for all analyses.
Results
Combined Analyses
The Spearman Rank Correlation did not confirm a significant association between the N170 (P8/P7) or VPP (Cz) ERPs and fixation times on the salient facial areas (eyes or mouth).
Event Related Potential
Analyses were conducted to explore variations between the non-autistic and autistic (Time 1) groups. The VPP ERP amplitude in response to face stimuli was smaller in the autistic group than in the non-autistic group at Cz (F(1, 30) = 4.45, p = .04; Cohen's f = 0.33). No other differences between groups were found for objects or faces at the P7 or P8 (N170) electrodes. Figure 1 highlights the differences between groups at the Cz (VPP) electrode.
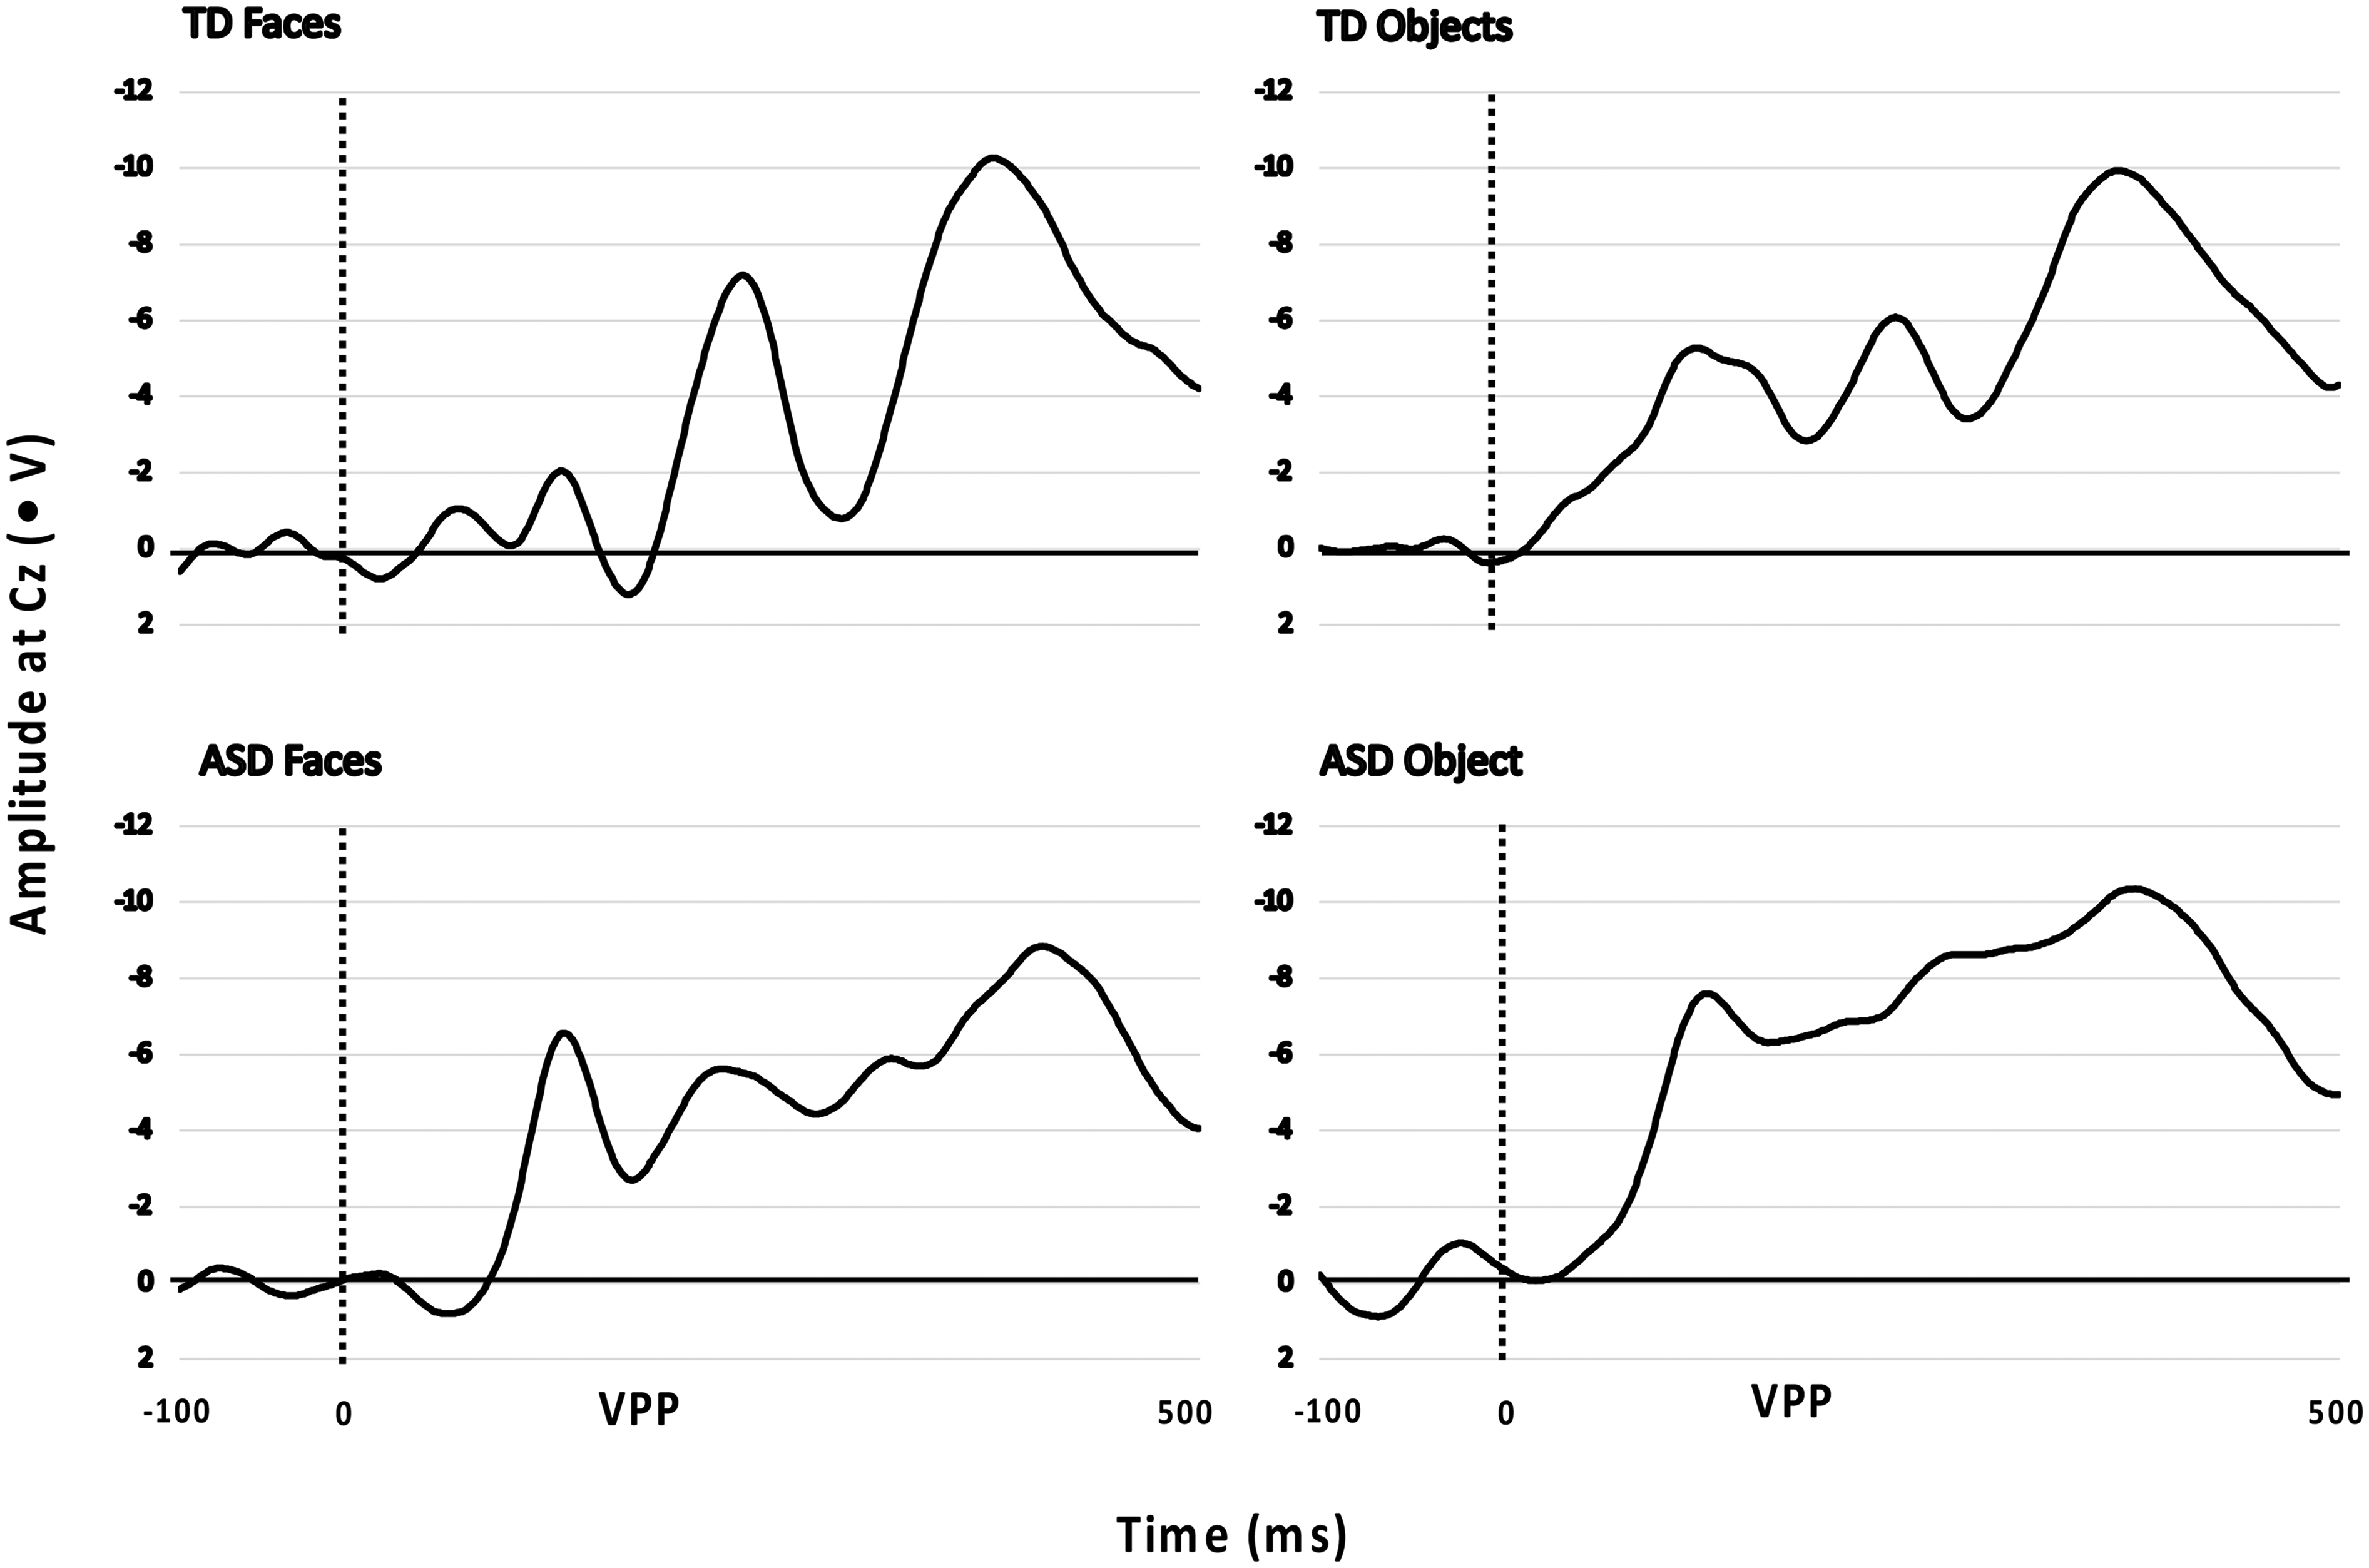
Amplitudes at Cz for the Vertex Positive Potential (VPP) of Autistic (ASD; Time 1) and Non-Autistic (TD) Groups in Response to Objects and Faces Stimuli.
Further analyses were conducted to explore variations between the non-autistic and autistic (Time 1) groups using the difference scores (faces - object). Significant differences between groups were found at the P7 (N170) electrode (F(1, 30) = 4.69, p = .04; Cohen's f = 0.34) and Cz (VPP) electrode (F(1, 30) = 4.77, p = .04; Cohen's f = 0.34). Autistic participants had smaller negative difference scores at Cz (VPP) compared to the non-autistic group, but larger positive difference scores at P7 (N170). Figure 2 below displays the significant difference between non-autistic (TD) and autistic (ASD) at P7 and P8. There was no significant group difference at the P8 (N170) electrode.
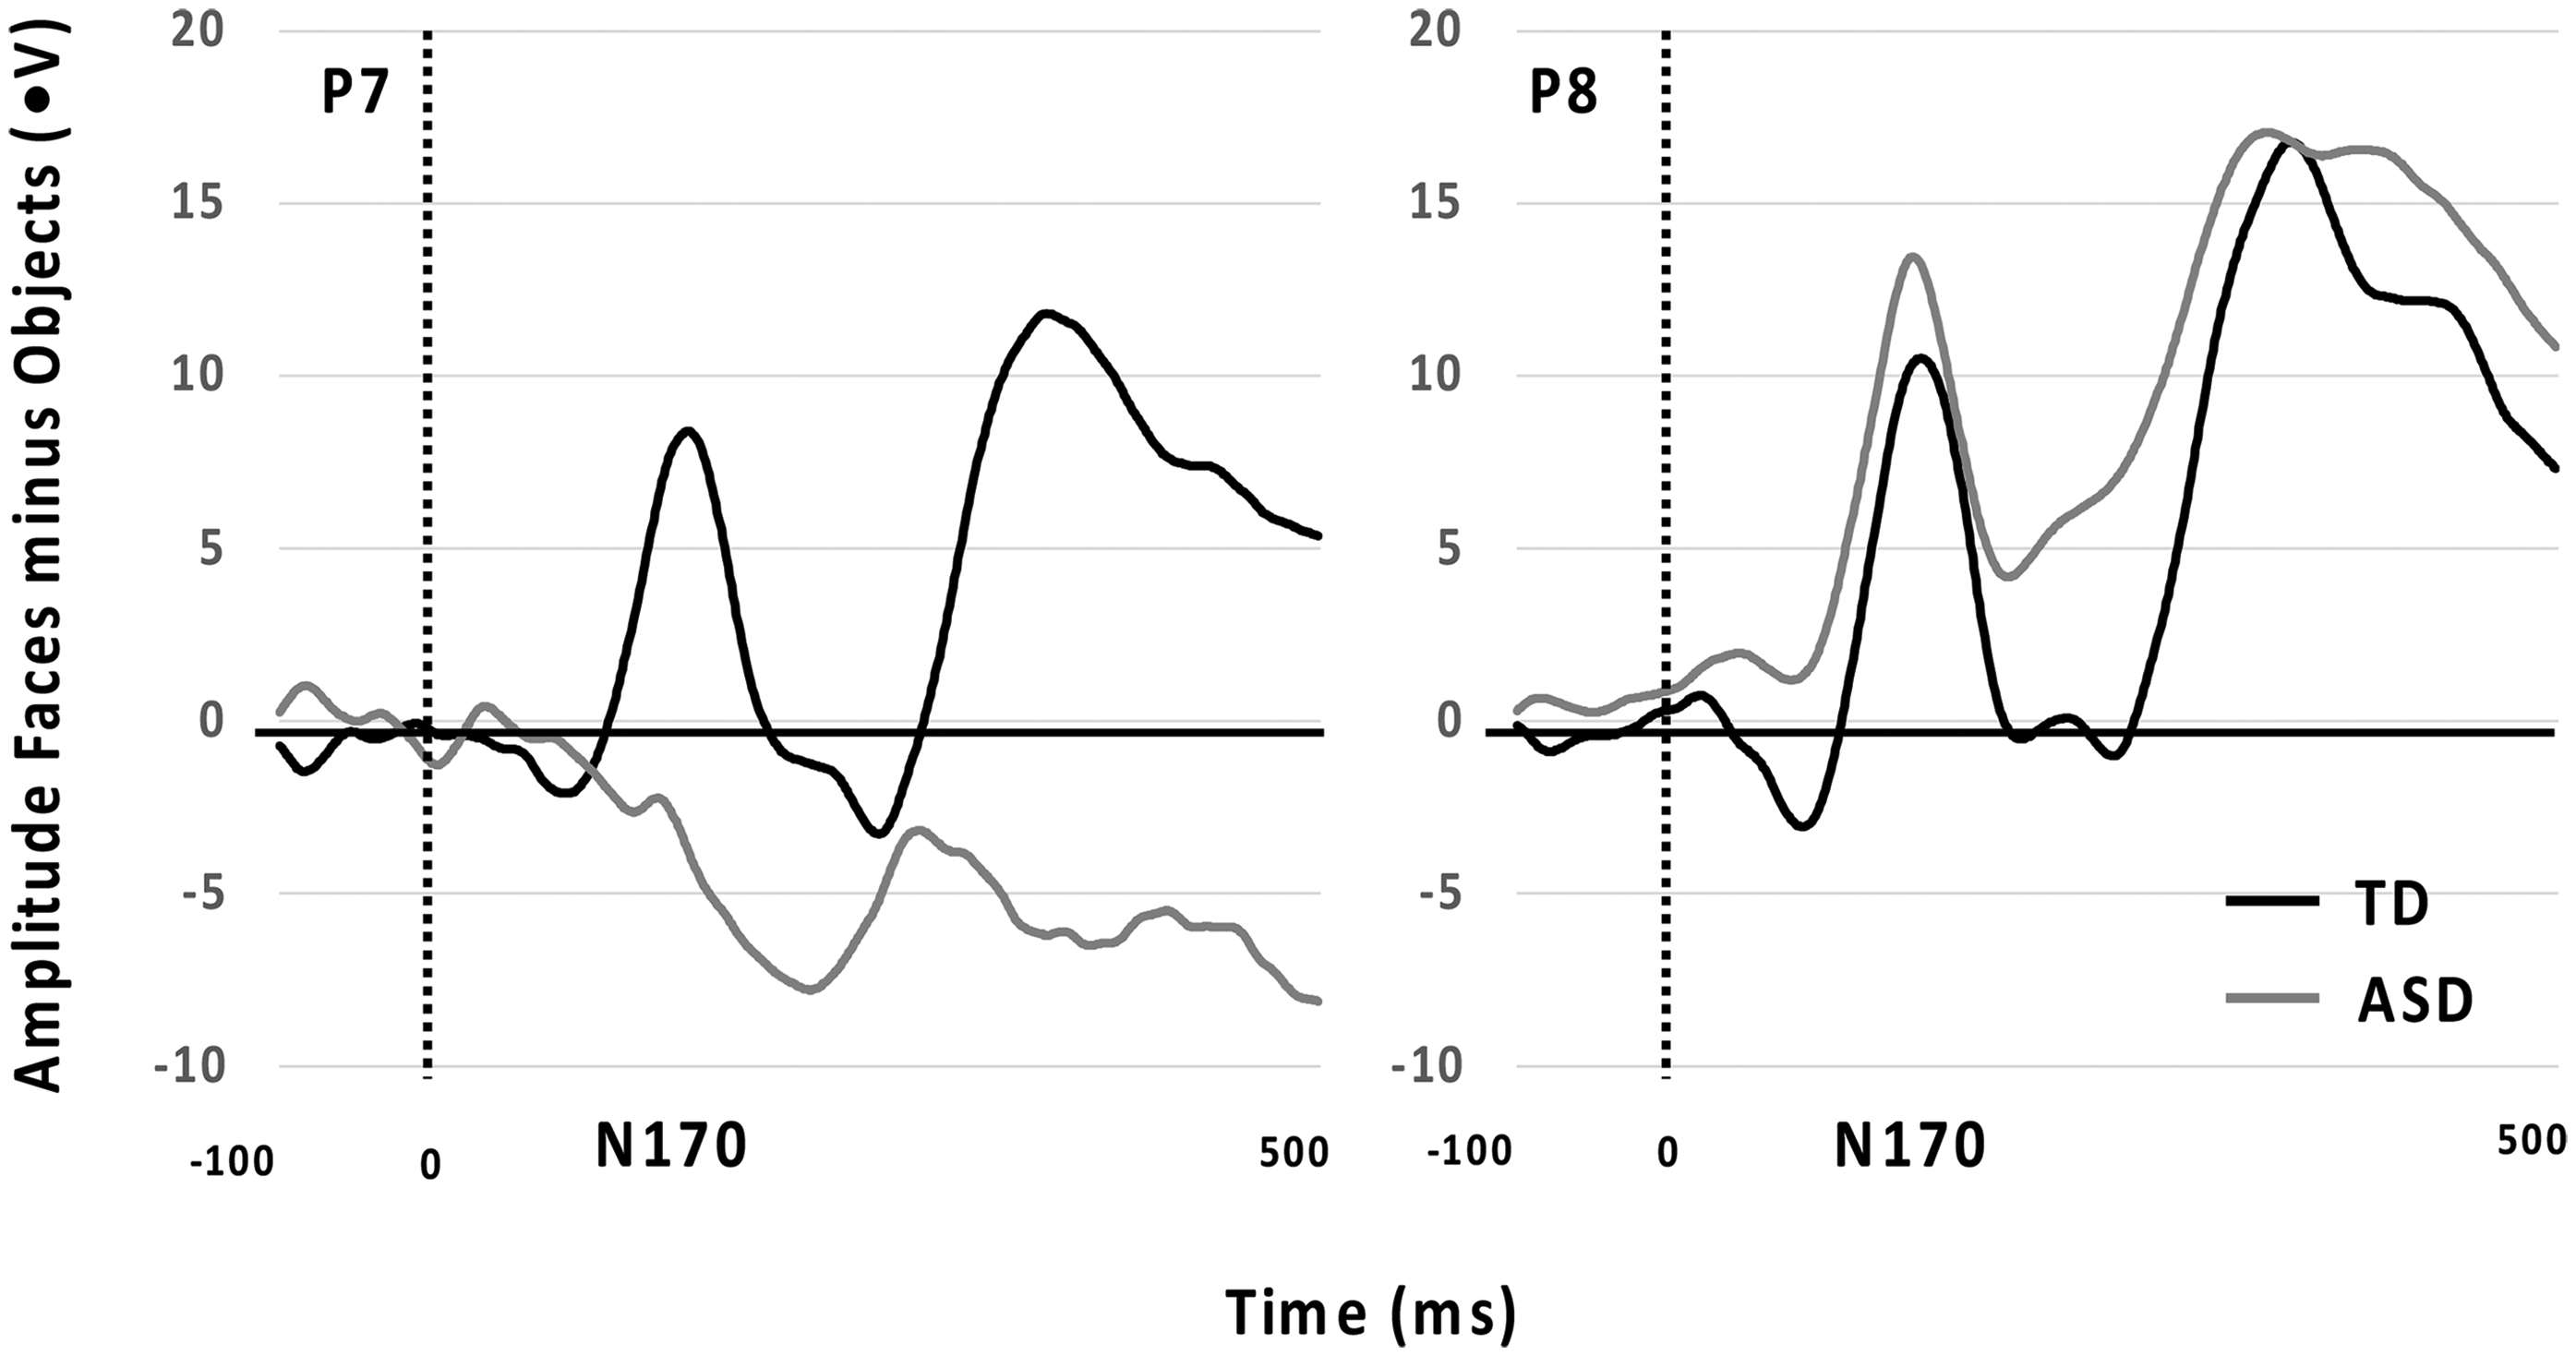
N170 ERPs for P7 and P8 Comparing Non-Autistic (TD) and Autistic Groups (ASD; Time 1).
EEG data were available from 10 autistic children after completing the intervention. Non-completion was due to not attending Time 2 assessment, refusal to wear the EEG cap or excessive fear when applying the recording gel with a blunted needle into the electrode discs on the EEG cap. Paired sample t-tests were conducted to compare the difference scores. There was no significant difference between Time 1 and Time 2 amplitudes for any electrode. Figure 3 shows the non-significant differences between Time 1 and Time 2 for the VPP.
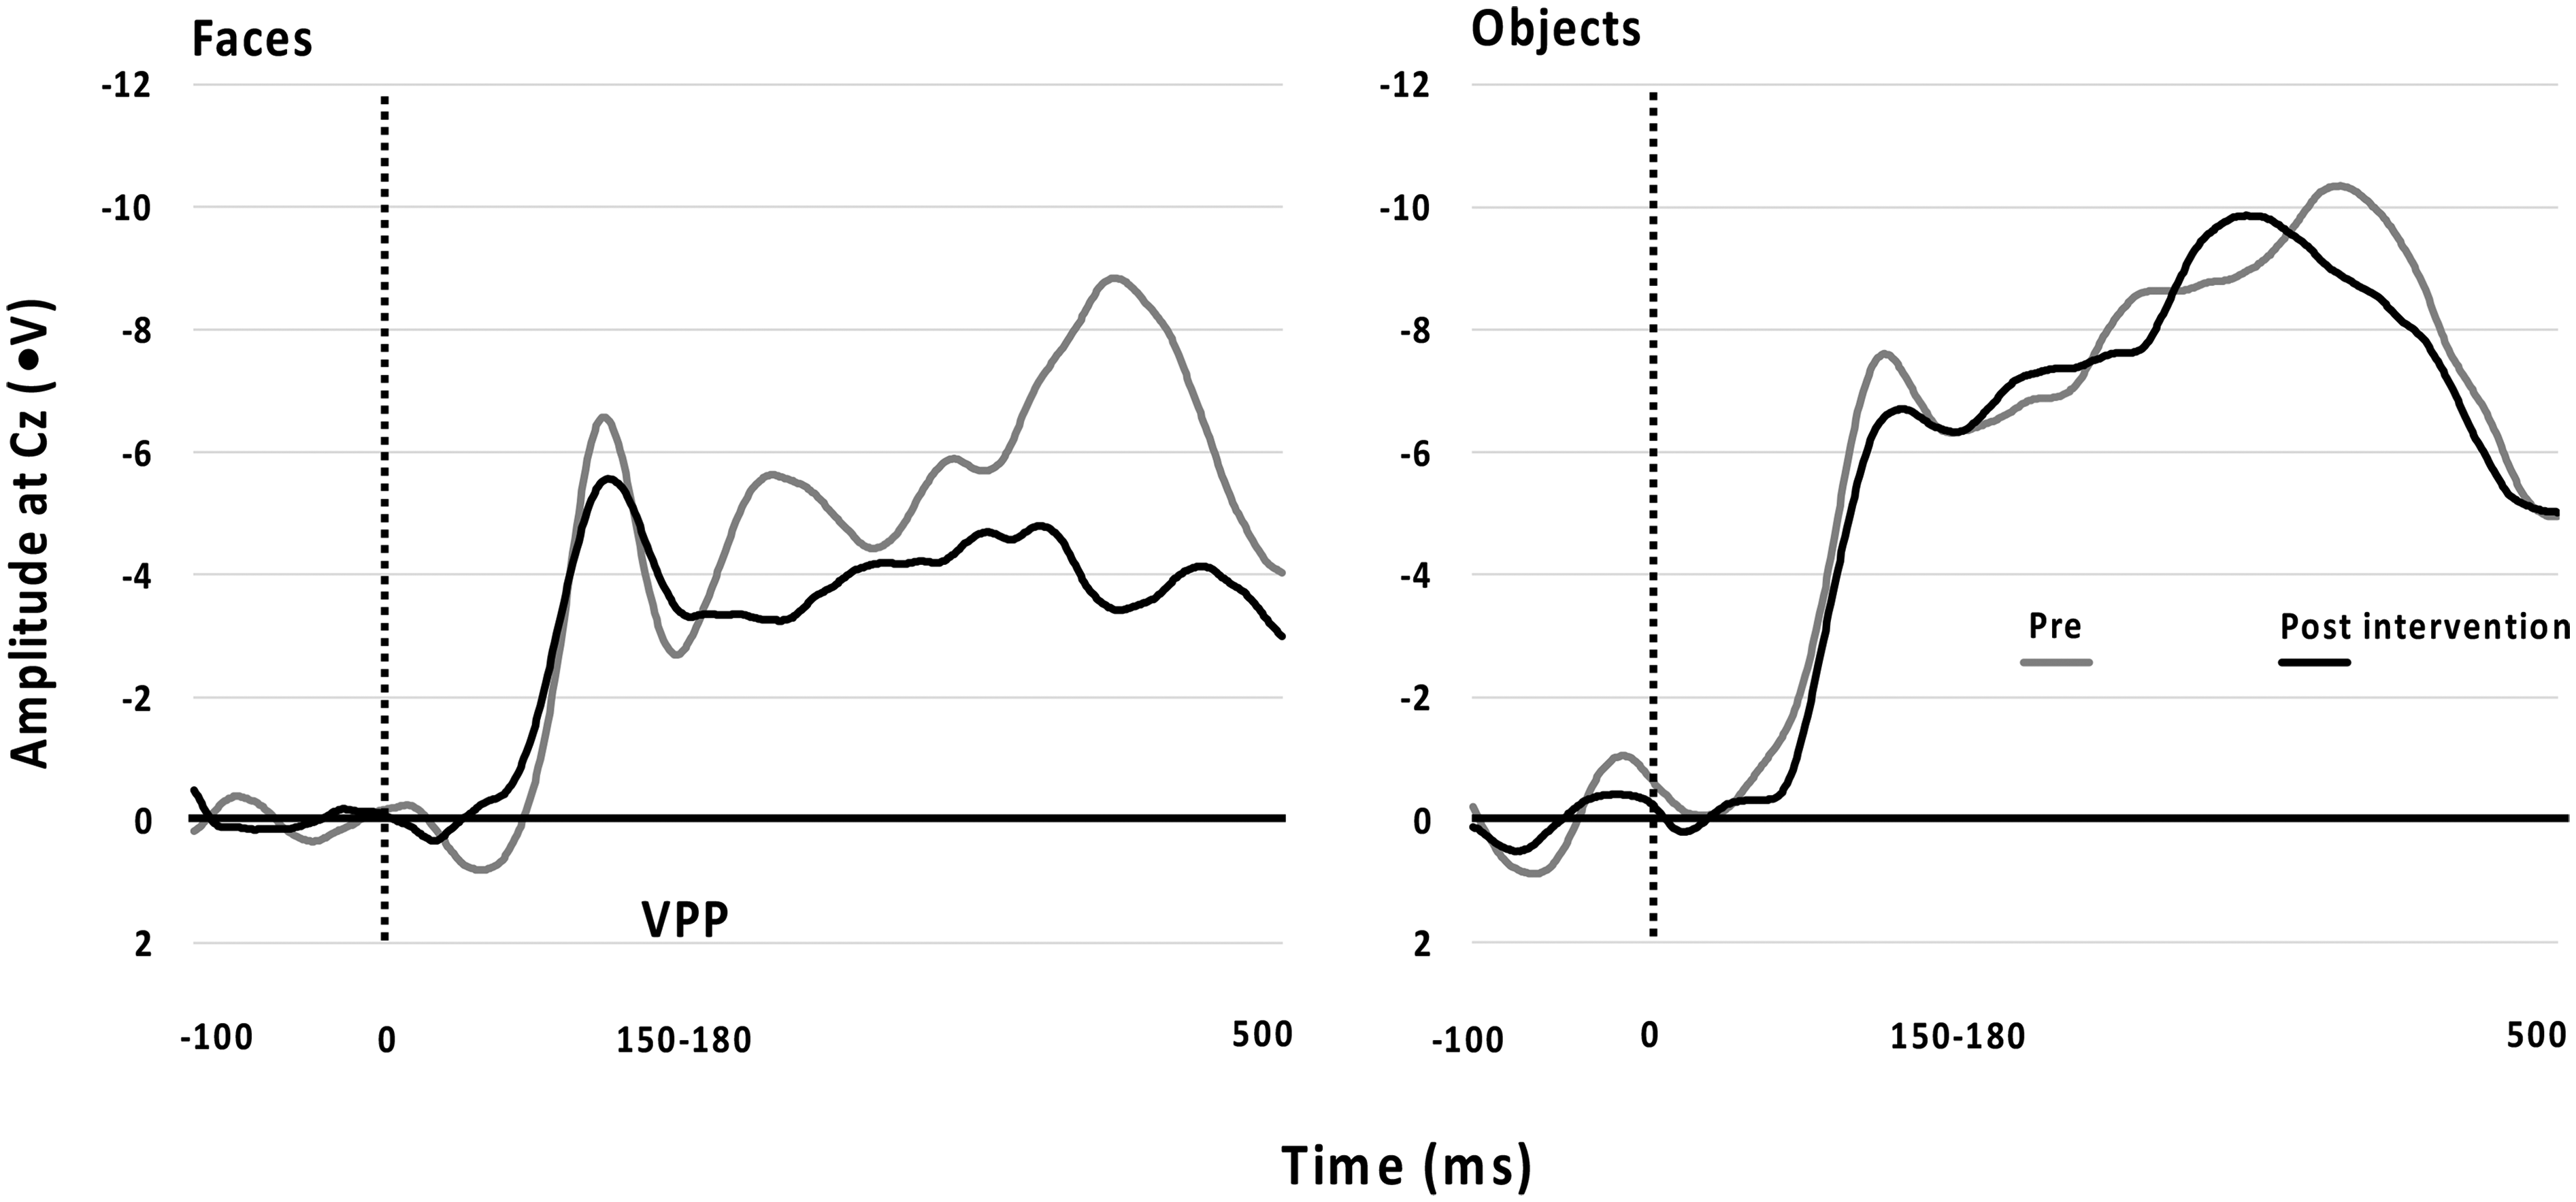
Differences From Time 1 to Time 2 Across Faces and Objects for the VPP Showed as Amplitude at Cz (ms).
Eye-Tracking
Table 3 displays the Median, and Interquartile range between groups’ fixation durations. The non-autistic group had significantly longer fixation durations on the eyes compared to the autistic group (U = 416 601.50, p < .001), mouth (U = 385 019.00, p < .001), and whole face (U = 433 332.50, p < .05), whereas the autistic group had significantly longer fixation durations off-face (U = 392 005.50, p < .001).
Fixation Duration (ms) Across Interest Areas and Groups.

Note. Pre-Intervention (Time 1) Autistic Participants versus Non-Autistic Participants.
Furthermore, significant between-group differences were found for total fixations on the mouth and off-face. The autistic group had a higher number of fixations on the mouth (U = 385 019.00, p < .001) and off-face (U = 392 005.50, p < .001) than the non-autistic group. In addition, the autistic group made more total fixations overall than the non-autistic group as indicated by the total fixations (U = 405 164.50, p < .001). Table 4 presents the Median, and Interquartile range for the number of fixations on each facial area.
Number of Fixations on Interest Areas Between Groups.
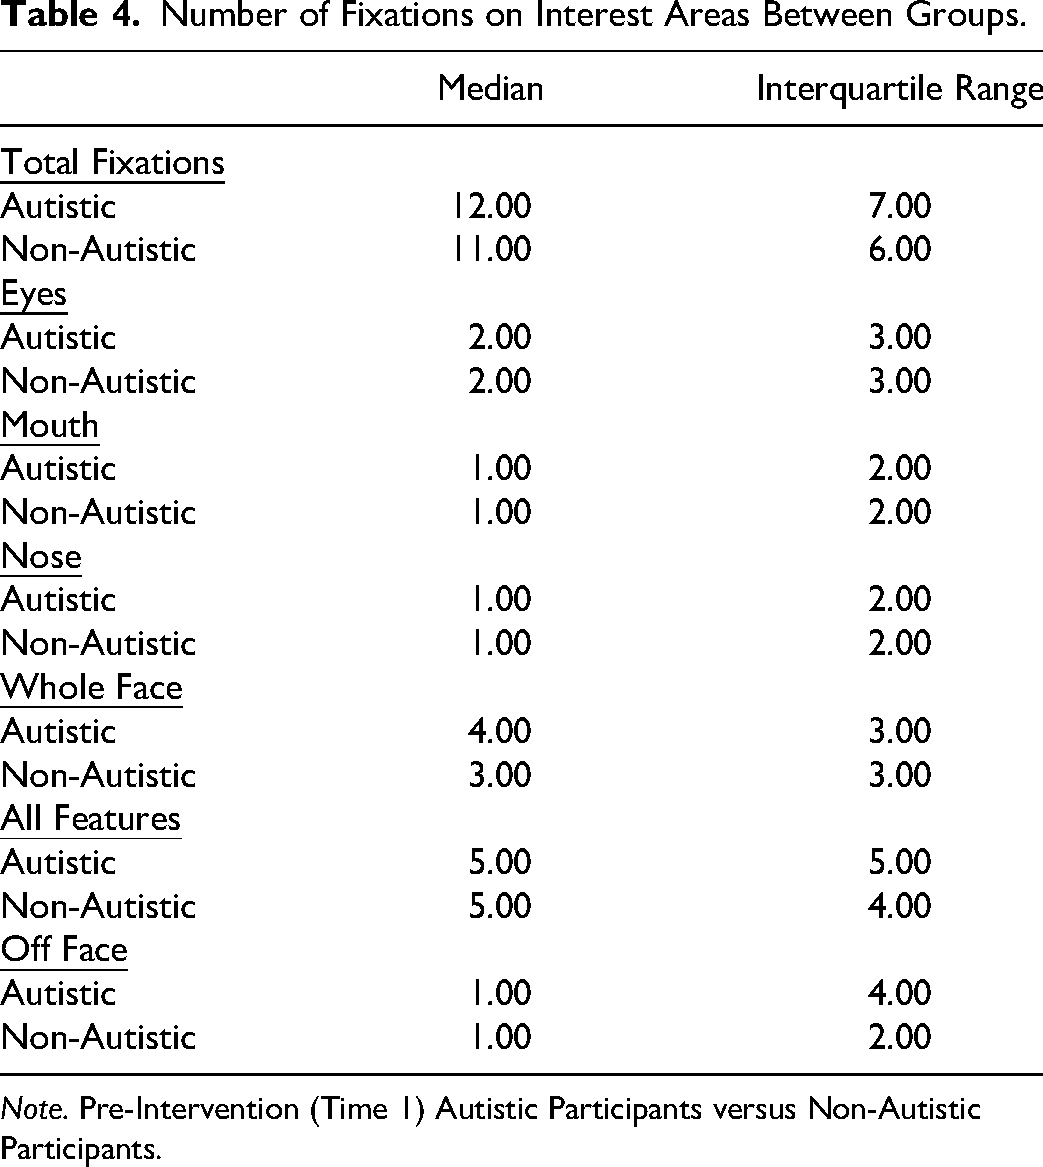
Note. Pre-Intervention (Time 1) Autistic Participants versus Non-Autistic Participants.
We then explored fixation duration differences between Time 1 and Time 2 for the autistic group. Time spent fixating on the nose (Z = −3.27, p < .01), whole face (Z = −3.98, p < .001) and all features (Z = −1.92, p = .05) increased at Time 2. In contrast, time spent off the face significantly decreased (Z = −3.61, p < .001). Figure 4 illustrates the averaged difference scores within the autistic group, which showed a visible decrease in fixation time on the mouth and whole picture following the intervention, while fixation time on other areas increased.
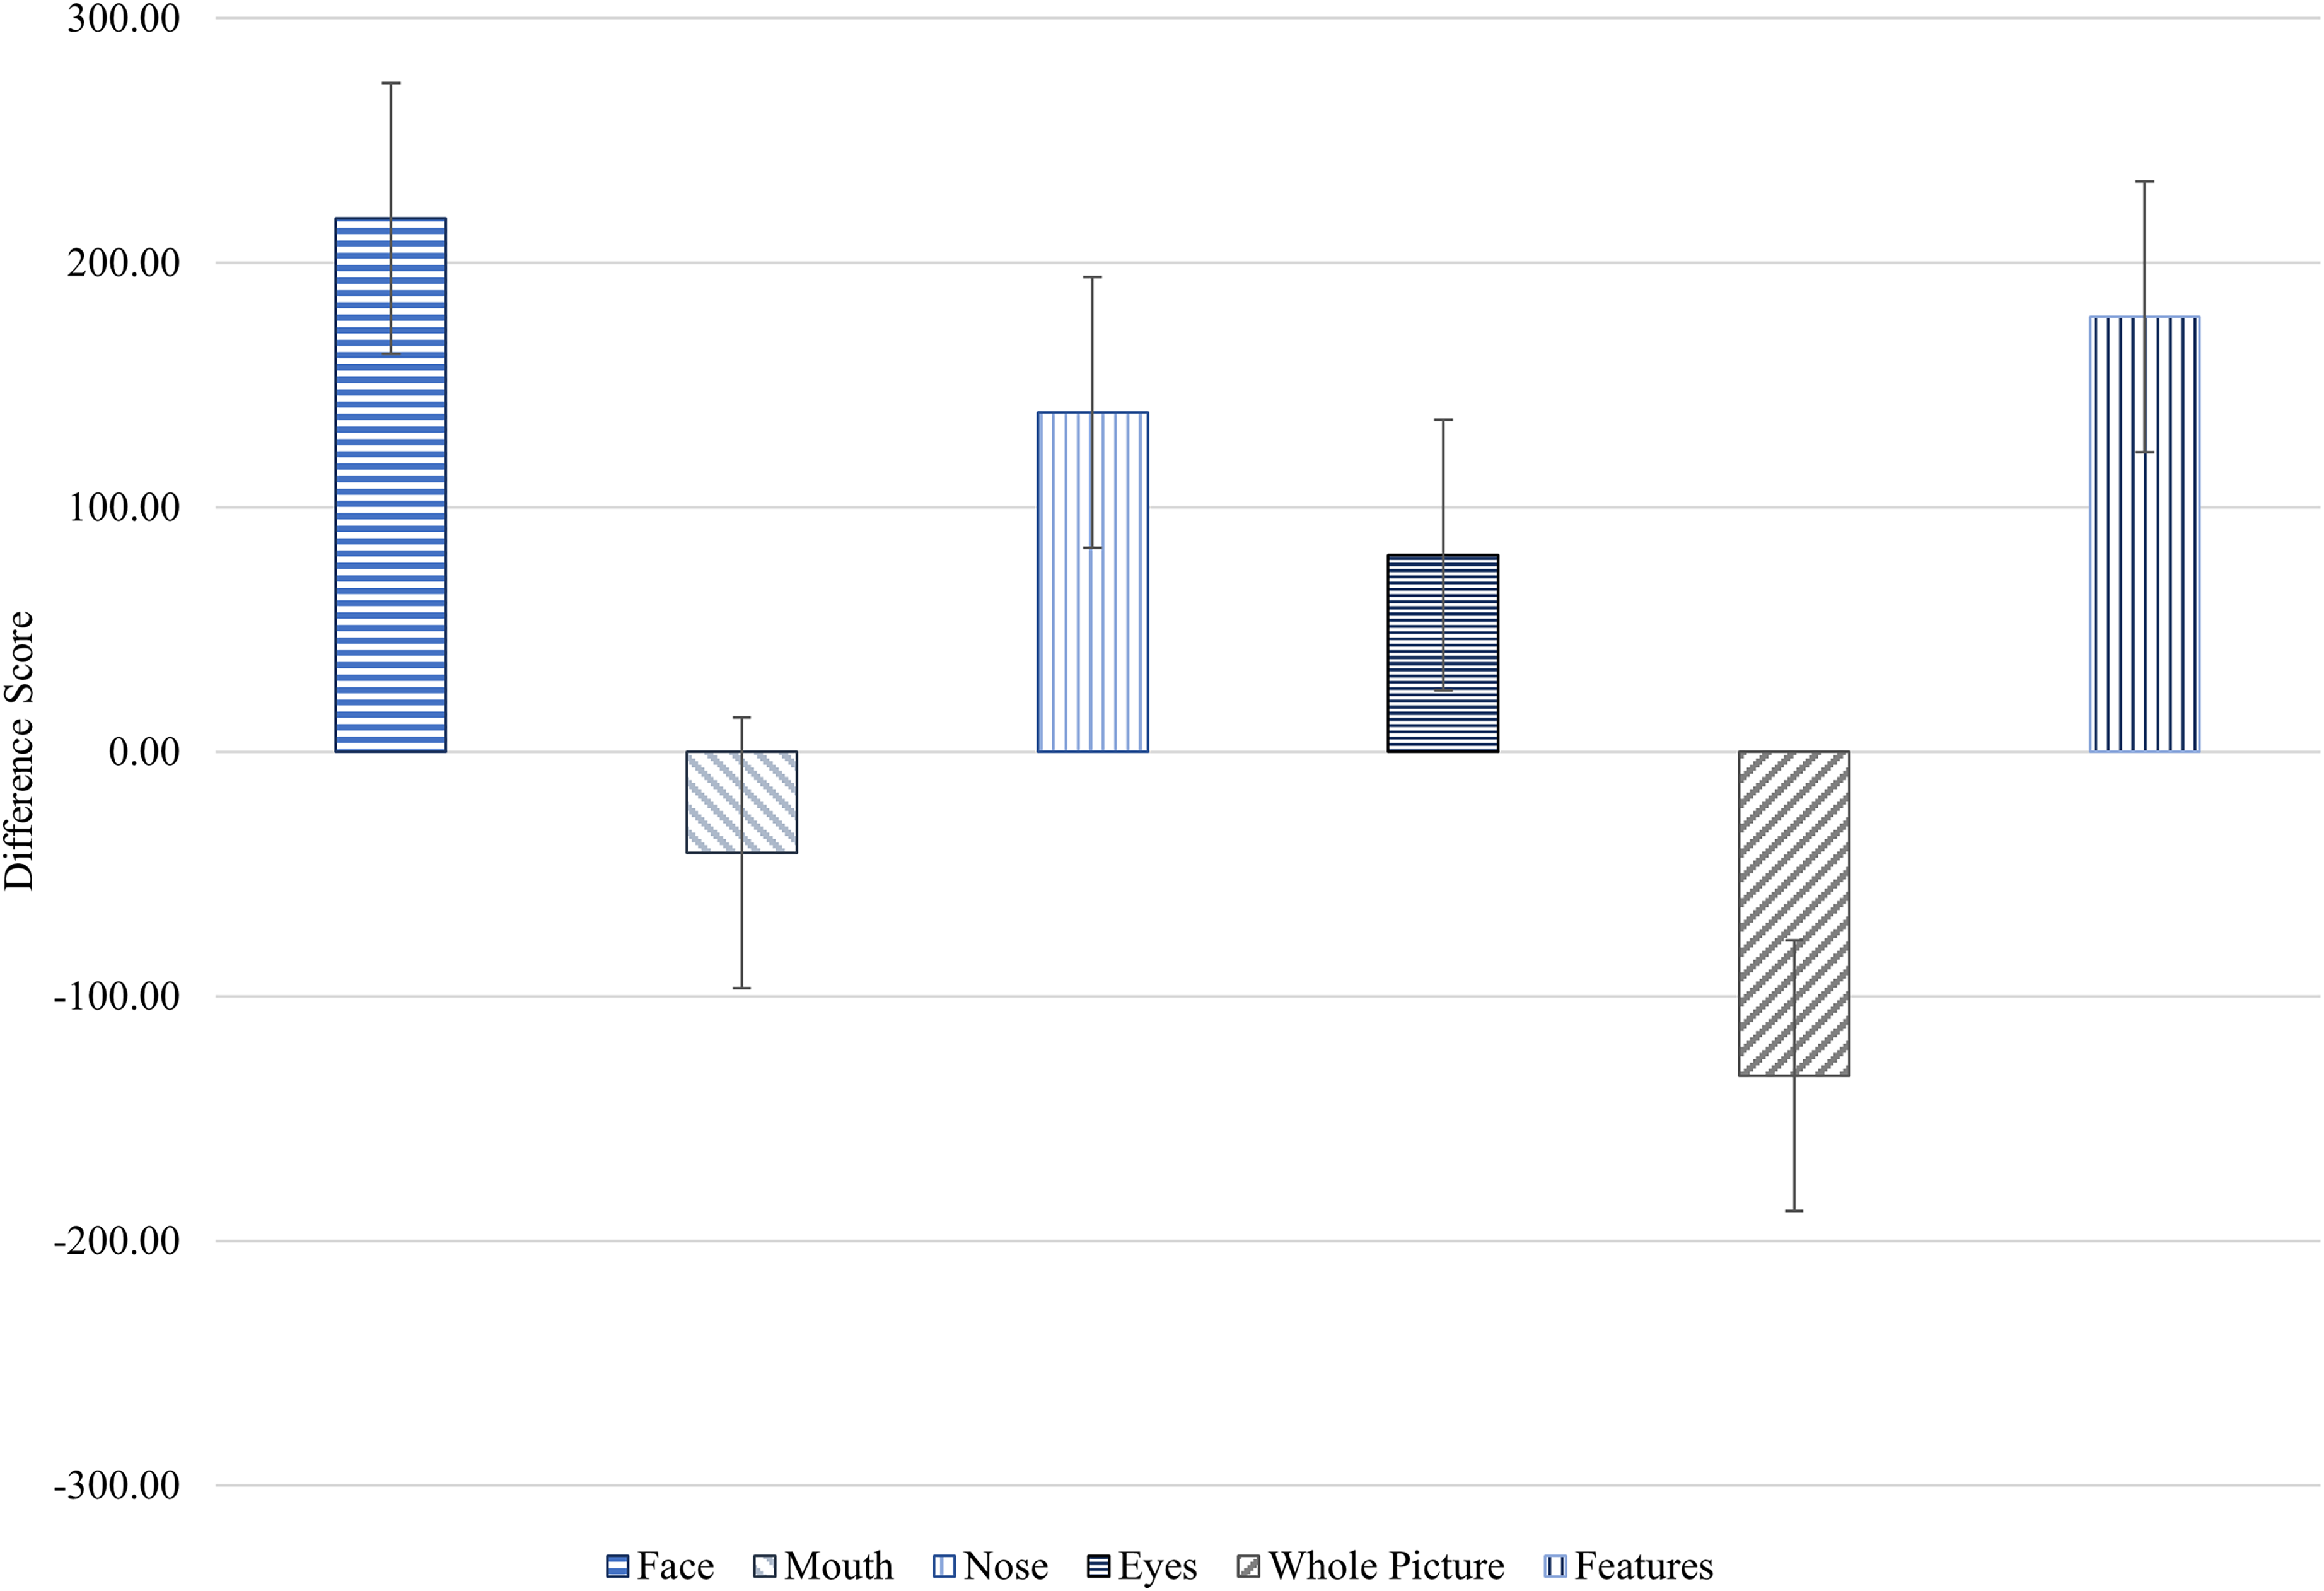
Fixation Duration (ms) Average Difference Scores ± SE of the Fixation Duration (ms) on Interest Areas (Face, Mouth, Nose, Eyes, Whole Picture and Features) in the Pre- and Post-Intervention Assessments for the Autistic Group.
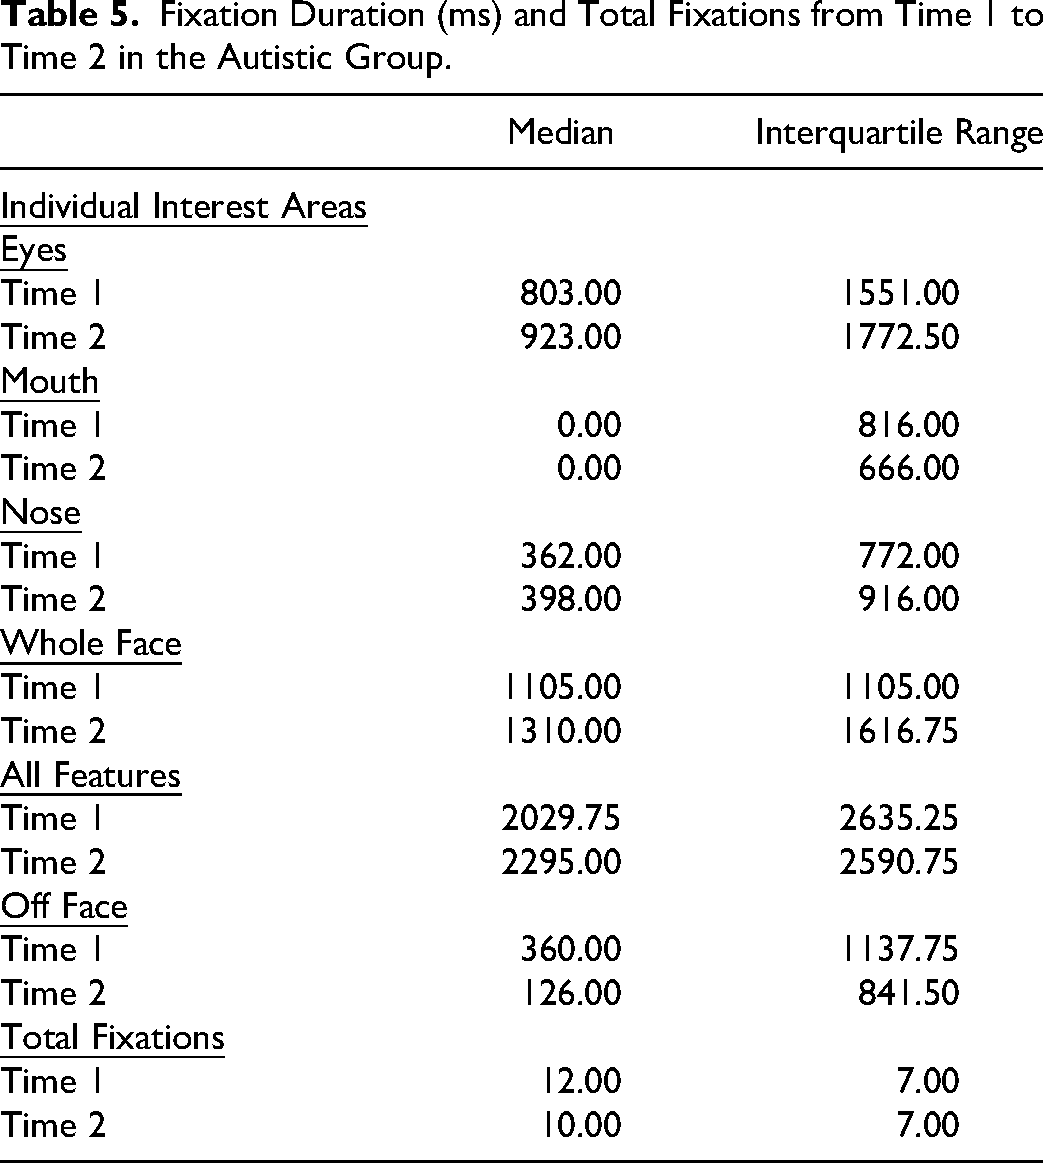
The total number of fixations also significantly decreased (Z = −6.33, p < .001). Table 5 presents the median and interquartile range for fixation duration and number of fixations from Time 1 to Time 2.
Fixation Duration (ms) and Total Fixations from Time 1 to Time 2 in the Autistic Group.
Further exploratory analysis was conducted on the differences between Time 1 and Time 2 in fixation duration and total fixations across the three expressions presented in the eye-tracking task. There was a significant increase in the time participants spent fixating on the nose area for neutral expressions (Pre: m = 246.00, IQR = 0.00, 1105.00 vs Post: m = 438.50, IQR = 0.00, 879.50; Z = −1.93, p = .05), However, this increase was not observed for happy or angry expressions. Participants significantly increased their fixation time on the whole face for all three expressions: Angry (Pre: m = 1048.50, IQR = 556.50, 1758.00 vs Post: m = 1263.00, IQR = 672.50, 2130.25; Z = −2.12, p < .05), Happy (Pre: m = 1158.00, IQR =601.50, 1853.25 vs Post: m = 1364.50, IQR = 650.75, 2317.00; Z = −2.45, p < .05), and Neutral (Pre: m = 1084.00, IQR = 455.25, 1938.25 vs Post: m = 1325.00, IQR = 631.25, 2294.25; Z = −2.26, p < .05). A significant decrease in fixation time off the face was observed for the angry expression (Pre: m = 357.50, IQR = 0.00, 787.00 vs Post: m = 35.00, IQR = 0.00, 613.00; Z = −3.30, p < .01), but not happy or neutral expressions. There was a significant decrease in total fixations across all three emotions: Angry (Pre: m = 12.00, IQR = 8.00, 16.00 vs Post: m = 11.00, IQR = 7.00, 14.00; Z = −4.08, p < .001), Happy (Pre: m = 12.00, IQR = 8.00, 15.00 vs Post: m = 10.00, IQR = 6.00, 13.00; Z = −2.85, p < .01), and Neutral (Pre: m = 11.00, IQR = 8.00, 14.00 vs Post: m = 10.00, IQR = 6.00, 13.00; Z = −4.07, p < .001).
Discussion
This study investigated the effectiveness of the TYLES intervention in altering neural and behavioural responses to facial emotional expressions by observing eye gaze and neural responses in autistic participants before and after using the task. Specifically, the hypotheses predicted that emotion recognition skills would improve in the autistic group at Time 2, as measured by larger N170 and VPP amplitudes and increased fixation on salient facial features.
Combined Analyses
It was hypothesised that there would be a correlation between the time spent scanning the salient facial areas and the N170/VPP response in the autistic group. However, this hypothesis was not confirmed. This result suggests that the intervention may not have effectively supported autistic children in extracting information from the salient areas, leading to a more robust brain response. This finding aligns with previous studies conducted with autistic individuals, which also found that they did not spend as much time scanning the salient facial areas as neurotypical individuals.7,30 Further research is needed to understand the relationship between face processing and attention to salient facial areas in autistic people.
Event-Related Potential
The study findings replicated group differences observed in other studies by showing a smaller N170 amplitude in the autistic group.4,12,31 The non-autistic group had a larger N170 amplitude to faces, suggesting more significant processing of facial features when compared to the autistic group. The post-intervention N170 and VPP amplitudes of the autistic participants showed no significant changes compared to their pre-intervention results. The utilisation of ERPs to discern distinctions in brain activity between autistic and neurotypical individuals is a common practice, and it has been proposed as a potential biomarker to explore the outcomes of interventions due to their accessibility and non-invasive nature.4,11 However, studies using ERPs to measure changes in the N170 following social skill interventions are relatively novel and as such, have yielded mixed results. Some studies have identified no changes in N170 amplitude or latency,32,33 whereas others have suggested that N170 latency may be an important measure of intervention effectiveness. 34 Even in studies applying evidence-based treatments like pivotal response treatment, Early Start Denver Model, and Program for the Education and Enrichment of Relational Skills (PEERS®) to teach social communication skills, outcomes concerning the N170 have been inconsistent.35–38
This variability might be attributed to the time required to develop neural pathways related to face expertise. Modifying N170 and VPP responses may take longer compared to other brain responses. Consequently, while ERPs have provided insights into treatment outcomes and subtle differences in face and emotion processing, the current study's results align with the habit formation concept.4,12 Currently, there are no established guidelines regarding the duration of skill-building interventions. Future studies that employ ERPs for measuring treatment effects should contemplate utilizing extended intervention periods to capture potentially delayed changes in neural responses.
Eye-Tracking
The eye-tracking data from the study confirmed that autistic participants spent less time looking at the salient areas of the face than neurotypical participants. However, it is worth noting that this is consistent with previous research and supports the eye avoidance hypothesis.4,8,14,39–41 The shorter eye fixation time in this study strongly indicates eye avoidance in autism. This is further supported by early studies showing that autistic people across all ages relied on the lower part of the face to recognise facial expressions (Simmons et al., 2009). Subsequent studies have confirmed these findings and have also shown that autistic youth often avert their gaze away from the eyes of others.42,43 The study's outcomes mirror trends observed in other eye-tracking investigations, such as the work by Pelphrey, Sasson, Reznick, Paul, Goldman and Piven, 44 which similarly demonstrated that individuals with autism often direct their gaze toward alternative facial features like the nose or mouth, possibly perceived as less intimidating. Future qualitative studies could aim to understand the thoughts and emotions associated with this behaviour to delve deeper into the phenomenon of eye avoidance in autistic youth.
Previous research has found that autistic people may have challenges scanning negative facial expressions,44–46 probably because they find these expressions threatening or overwhelming. However, the current study found that the participants spent less time looking away from the faces when scanning negative emotion expressions. This suggests that the participants may have become more comfortable looking at these expressions over time. It is important to note that not all autistic individuals have difficulty scanning negative facial expressions. Some recognise all basic facial expressions similarly to their neurotypical peers.47,48 Therefore, further research is needed in order to account for the variability among individuals on the autistic spectrum, particularly since the broadening of diagnostic criteria for autism in the DSM-5. 49
Although there have been few studies on the topic, recent research has shown that eye-tracking can be a valuable and reliable way to measure the effectiveness of social skill interventions.50–53 For example, one study found that children exhibited differences in attention to salient facial features following pivotal response intervention (Bradshaw et al, 2019), while another found that children who received slowness therapy, which aims to slow down speech, had longer gaze durations on the salient areas of the face. 51 Although these studies did not use the same intervention as the current study, they suggest that eye-tracking could be a valuable tool for evaluating the effectiveness of social skill interventions.
A potential limitation of this study is re-test effect. Repeated exposure to the eye-tracking task could be partially attributable to the re-test effect rather than the intervention itself. To address this limitation, future research should consider employing a randomised controlled trial. However, a general study limitation was the small sample size due to COVID-19 restrictions as well as meeting the deadline for study completion. While eye tracking suggests behavioural changes following intervention, the N170 and VPP amplitudes did not change significantly. It is likely that the sample size did not provide sufficient power to detect potential ERP amplitude changes. It is also possible the reduced N170 and VPP amplitudes act more as an autism trait than a state marker. Another study limitation is the number of co-morbidities in our autistic sample which could not be statistically controlled for due to the small sample size. Furthermore, the current study's relatively short intervention period limits the generalisability of the findings. It is possible that a longer intervention duration could find more robust and sustained effects. Future research should explore the impact of extended intervention periods with the RCT framework.
This study demonstrated a novel methodology using ERP and eye tracking to investigate the effectiveness of the TYLES task. The results indicate that the N170 and VPP responses remained unchanged following the brief intervention. However, participants’ facial scanning did show changes, with participants spending more time on the face, although focusing more on the nose rather than the more salient areas of the face. Interestingly, although the participants successfully recognised emotions, their pattern of facial feature scanning differed. Thus, unresolved questions remain regarding the effectiveness of facial emotion recognition interventions in improving skills for autistic people.
Footnotes
Acknowledgements
The authors would like to thank all the young people and their families who gave up their time to participate in this study, especially with the added stress of a global pandemic. The authors would also like to thank Gavin Cooper for his help with creating ERP figures and Paula Gómez Álvarez for reviewing the manuscript.
Ethics Approval
The Human Ethics Review Committee at the University of Newcastle approved the study (approval: H-2016-0098) on March 07, 2019. Legal guardians gave written consent for review and signature before starting the assessments.
Funding
The authors disclosed receipt of the following financial support for the research, authorship, and/or publication of this article: This work was supported by Hunter Medical Research Institute (Happy, Healthy Kids; No. G1801008) and an Australian Government Research Training Program Fee Offset and Scholarship.
Declaration of Conflicting Interests
The author(s) declared no potential conflicts of interest with respect to the research, authorship, and/or publication of this article.
Availability of Data and Materials
Study data are archived at the University of Newcastle and are available from the corresponding author on reasonable request with institutional ethics approval.