
Abstract
Introduction
The essential features of hypsarrhythmia include a strikingly disorganized diffuse pattern comprising very high amplitude (>300 µV) slow waves and multifocal epileptiform discharges. 1 While these characteristics have remained largely unchanged for many years, their application in clinical practice seems to be burdened by poor inter-rater reliability. 2
Since the original description of hypsarrhythmia by Gibbs and Gibbs in 1952 3 there has been a steady increase in the number of scientific publications involving this pattern. This trend is most apparent in the past decade. 4 Nonetheless, very little attention has been paid to the quantitative analysis of hypsarrhythmia.
In a landmark study, electroencephalogram (EEG) amplitude and power spectra were obtained in 21 infants with hypsarrhythmia and epileptic spasms and in a group of healthy controls. After an interquartile range of 19–45 days, when treatment had been instituted, repeat recordings were obtained. Statistically significantly higher amplitude was found in the hypsarrhythmia group. However, changes between the two recordings were not specifically analyzed. 5
In a follow-up study, Smith et al 6 successfully distinguished patients from healthy controls using five categories of quantitative EEG techniques, including power spectra. However, only 8 of 40 participants had pre‐treatment hypsarrhythmia.
Jha et al 7 presented spectral power findings in older children with hypsarrhythmia, than are typically encountered. Delta power in these 3–10-year-olds far exceeded the spectral power of the faster frequency bands.
In the present study, emphasis was placed on short-term quantitative EEG changes in hypsarrhythmia, closely related to the initiation or modification of anticonvulsive therapy. A relatively large group of participants was assessed. Furthermore, emphasis was placed on inter-individual changes. The inter-recording interval included the 2-week period when both clinical and hypsarrhythmic resolution can occur in response to therapy. 8
Methods
Study Population
Fifty participants aged 2–39 months were included. Each had hypsarrhythmia, identified in an initial standard clinical EEG recording using visual analysis. A second EEG recording was performed 10–25 days later. To fulfil this criterion, EEG recordings performed at the Steve Biko Academic Hospital in Pretoria, South Africa, were scrutinized from 2009–2019. Visual analysis of the clinical EEG was performed by an electroencephalographer with over 20 years’ experience in pediatric EEGs. EEG recordings were requested by the Department of Pediatric Neurology. After the first recording (R1), anticonvulsant treatment was modified or commenced before the follow-up recording (R2). At R2, 29 participants were receiving vigabatrin plus a steroid, while 19 participants were being treated with either one of these drugs. Treatment in the remaining 2 participants consisted of other anticonvulsants.
Study Design
Ethical approval was obtained from appropriate university and academic hospital committees. The clinical EEG recordings were performed in the Neurophysiology Unit of Steve Biko Academic Hospital using a Nihon Kohden EEG acquisition system (Nihon Kohden, Tokyo, Japan). The EEG recordings involved the placement of the international 10–20 electrode system. The duration of the recordings varied from 20–60 min. Visual analysis typically used a standard longitudinal bipolar 20-channel montage.
Spectral analysis was accomplished by using MultiView Version 2.2 software (MEGIS Software GmbH, Munich, Germany). Each recording was marked in epochs of a minimum of 3 s, excluding artifacts. Spectral analysis was performed on approximately 3 min of EEG per recording. As far as possible, both the R1 and R2 recordings of each pair contained epochs of the same level of alertness, which was determined by the annotation of eyes open/eyes closed during the EEG recording. When the participant's eyes were open, wakefulness was assumed, and when the participant's eyes were closed, drowsiness/sleep was assumed.
A common reference ipsilateral ear montage, containing 19 derivations, was used for all recordings, to facilitate interhemispheric comparisons (data not presented in this report). Midline electrodes were referred to the right ear. A low cut-off filter of 0.5 Hz was set with a roll-off slope of 6 dB/octave. The high cut-off filter was set at 30 Hz with a roll-off slope of 12 dB/octave. A notch filter of 50 Hz with a width of 5 Hz was also utilized. The sampling rate was 200 Hz with an epoch length of 2.56 s. The frequency spectrum of 0.5–30 Hz was divided into four frequency bands: Delta (0.5–3.8 Hz), theta (4.0–7.8 Hz), alpha (8.0–12.8 Hz), and beta (13.0–30.0 Hz). Output was expressed as frequency band power (µV2).
Statistical analysis started with a comparison of delta power (µV2) in five longitudinal chains of electrodes to gauge topographical (anterior to posterior) distribution. A mixed effects maximum likelihood regression analysis using ranks was performed due to the large standard deviations and discrepancies between the mean and median values.
For each participant, spectral power in R2 was expressed as a percentage of the equivalent value in R1 (the lower the percentage value, the greater the change between the two recordings). The relative percentage change from R1 to R2 was classified in one of four categories: (1) <25%, (2) 25%–<50%, (3) 50%–<75%, and (4) ≥75%.
Fisher's exact test was used to compare differences in the level of alertness between those participants with hypsarrhythmia still present in R2, and those participants without hypsarrhythmia in R2.
Results
In Figure 1, the spectral composition of hypsarrhythmia in R1 is shown, using median spectral power at a selection of anterior and posterior electrode positions. The predominance of delta power relative to the other three frequency bands is apparent.
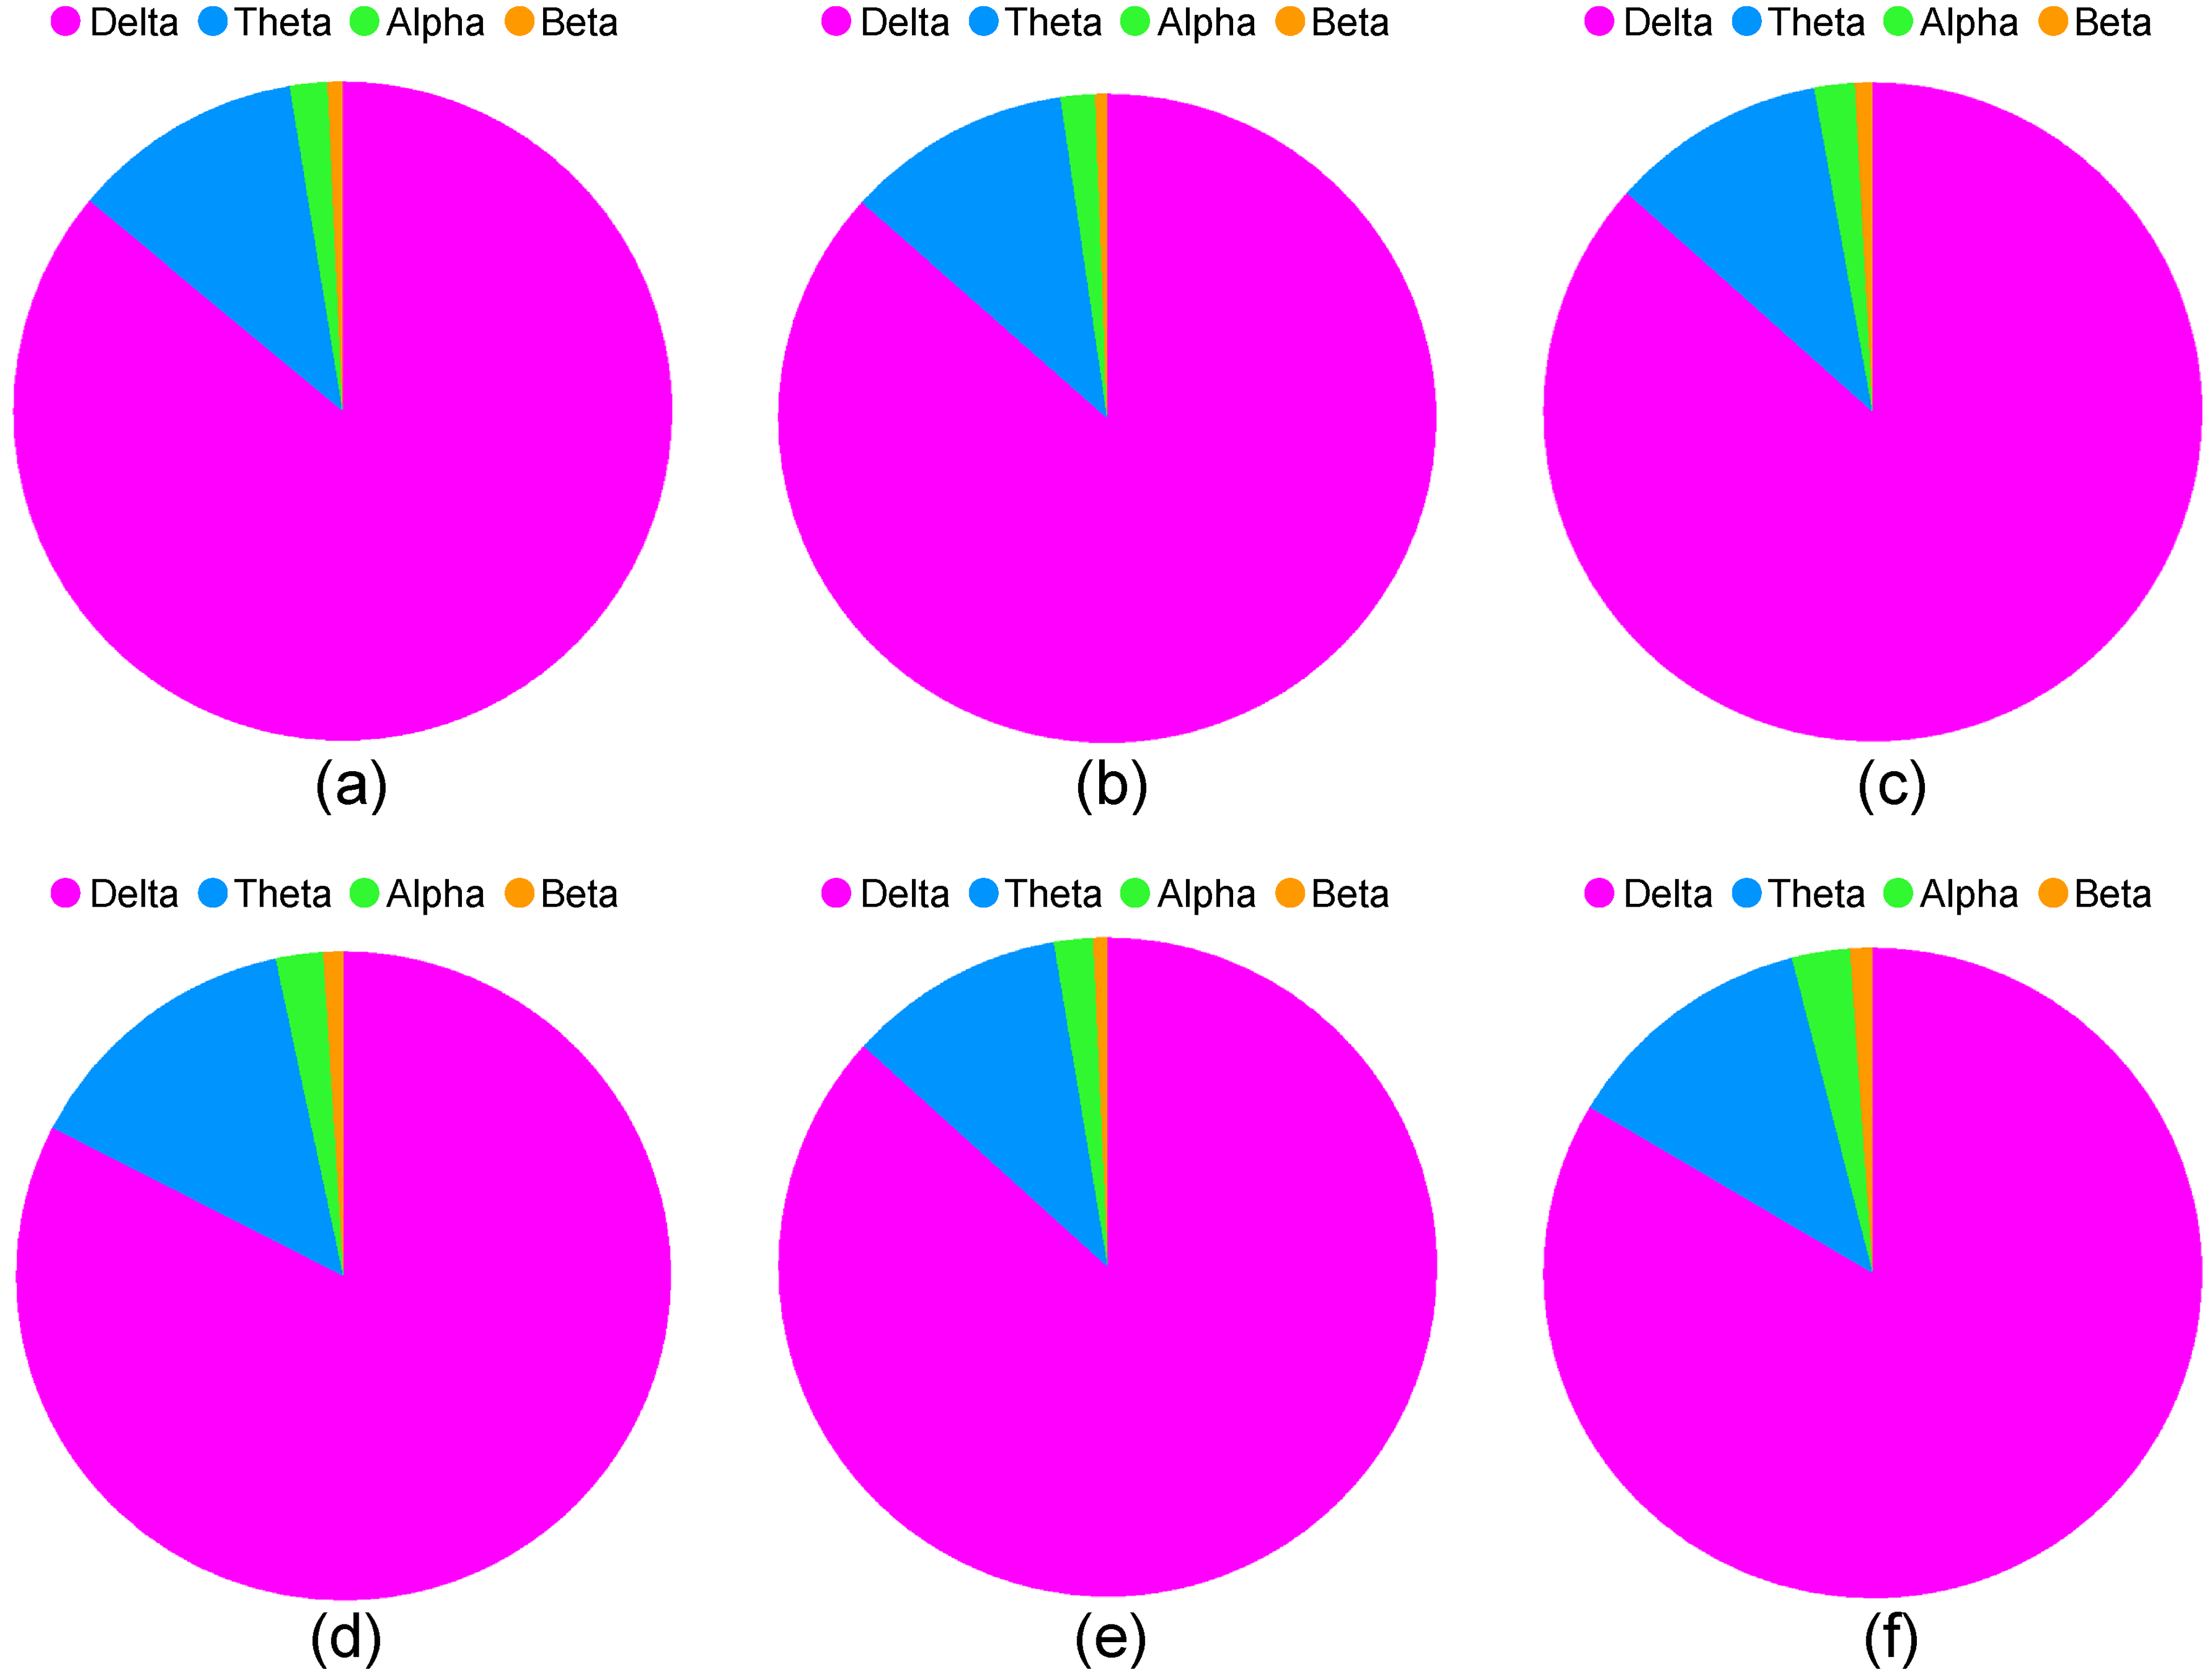
The proportion of median spectral power in the delta, theta, alpha, and beta bands at (a) F4, (b) Fz, (c) F3, (d) T6, (e) Pz, and (f) T5. These derivations represent the more anterior and posterior electrode placements.
Wilcoxon's matched pairs signed rank tests were performed to compare group spectral delta power between R1 and R2 in 19 EEG derivations. Statistically significant differences in delta power were found for all 19 electrodes as shown in Table 1.
Comparison by Wilcoxon Matched-Pairs Signed-Rank Test of Initial Recordings (Recording 1) and Follow-Up Recordings (Recording 2) in Respect of Delta Power (µV2) in 19 EEG Derivations.
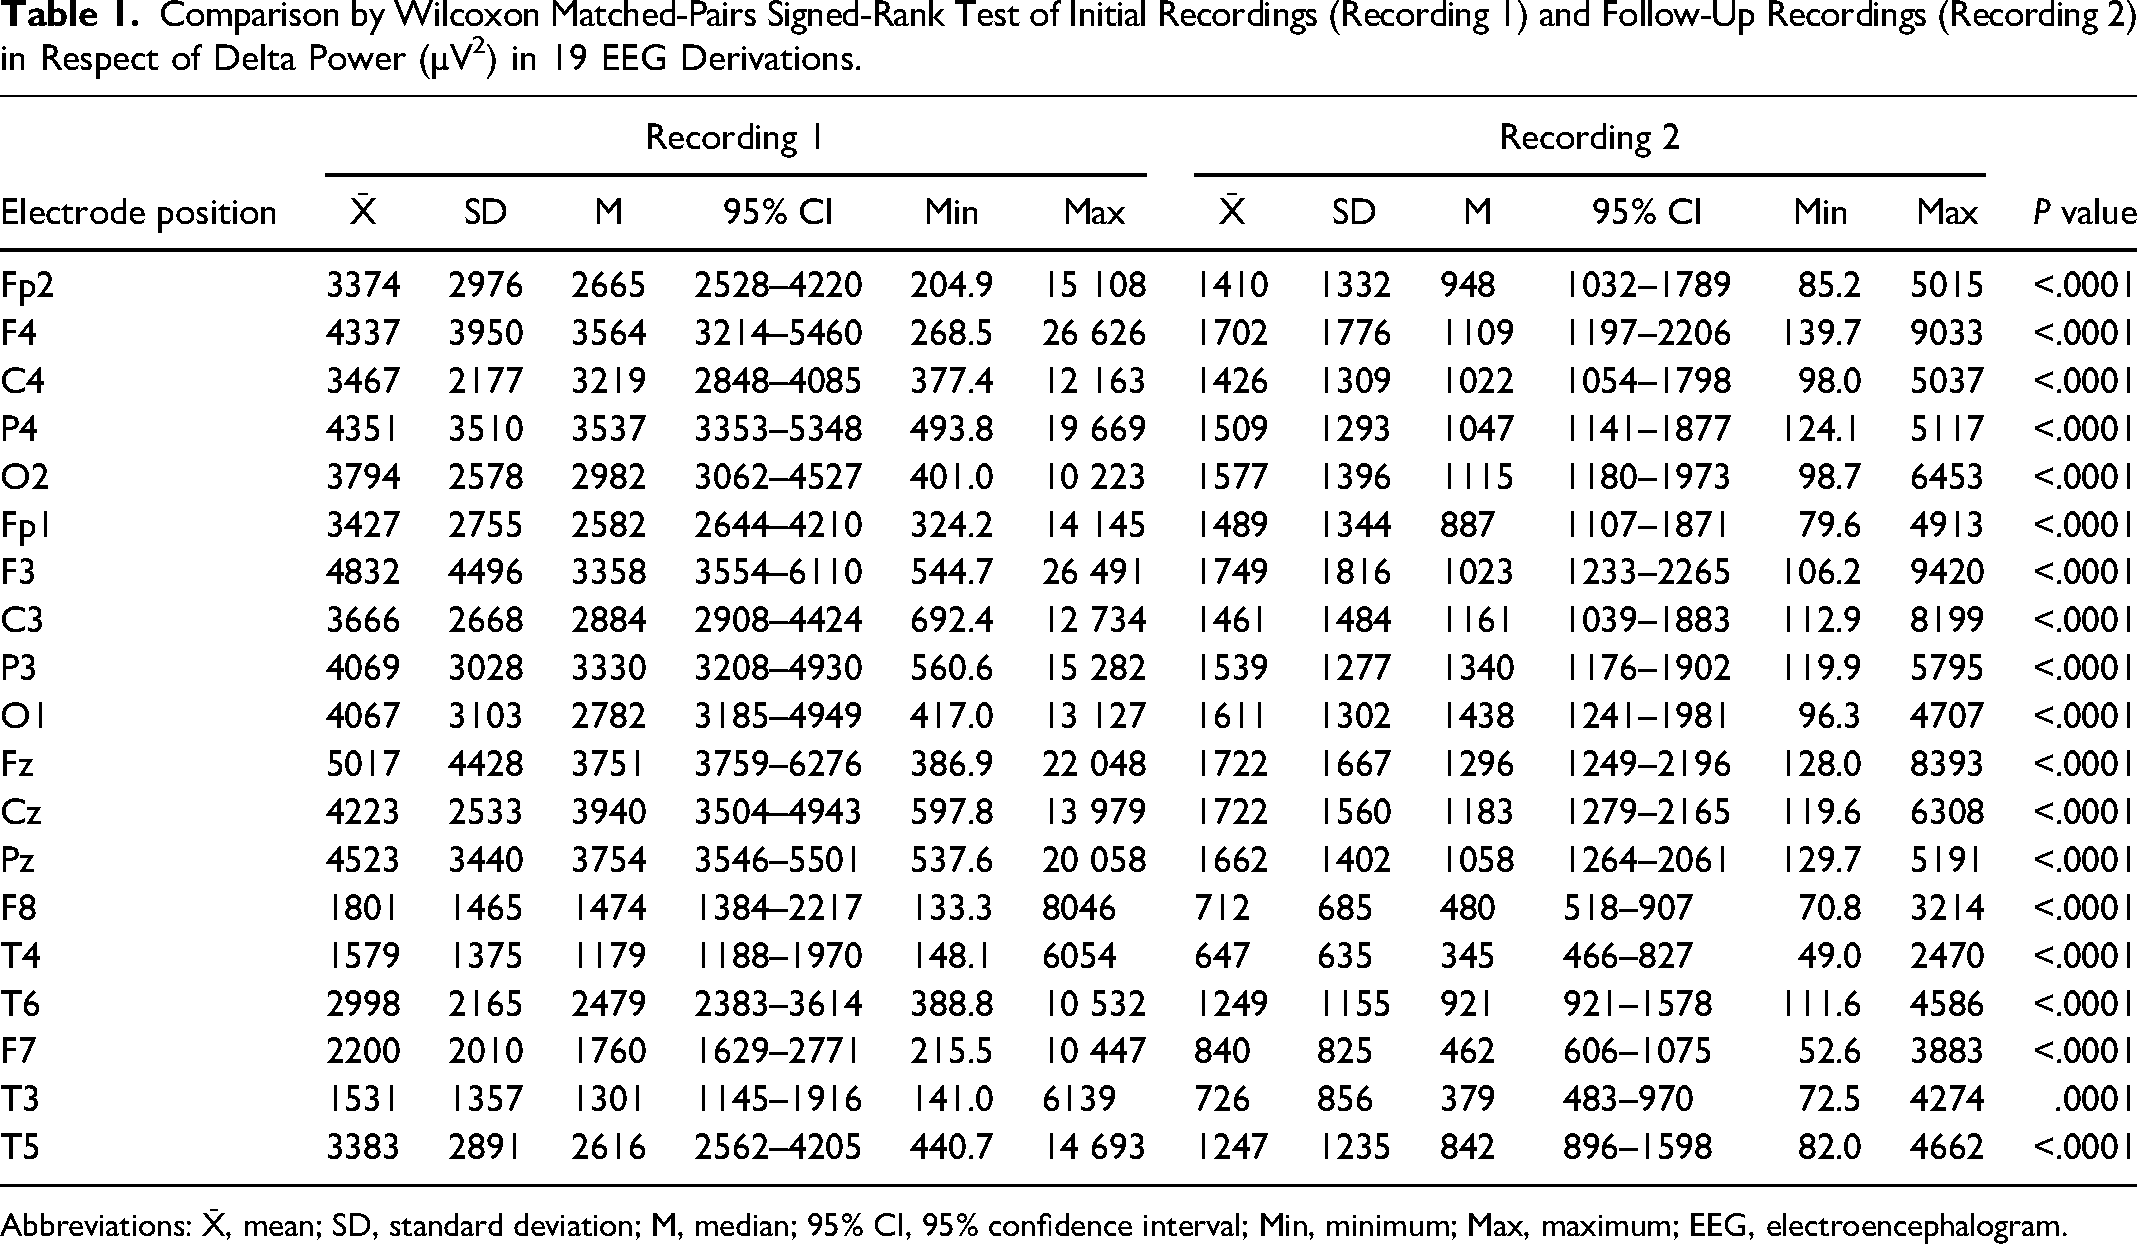
Abbreviations: X̄, mean; SD, standard deviation; M, median; 95% CI, 95% confidence interval; Min, minimum; Max, maximum; EEG, electroencephalogram.
The relative (percentage) change in spectral power between R2 and R1 is shown in Table 2.
Percentage Changes in Spectral Delta Power (µV2) for All 19 Derivations Across 50 Participants. a
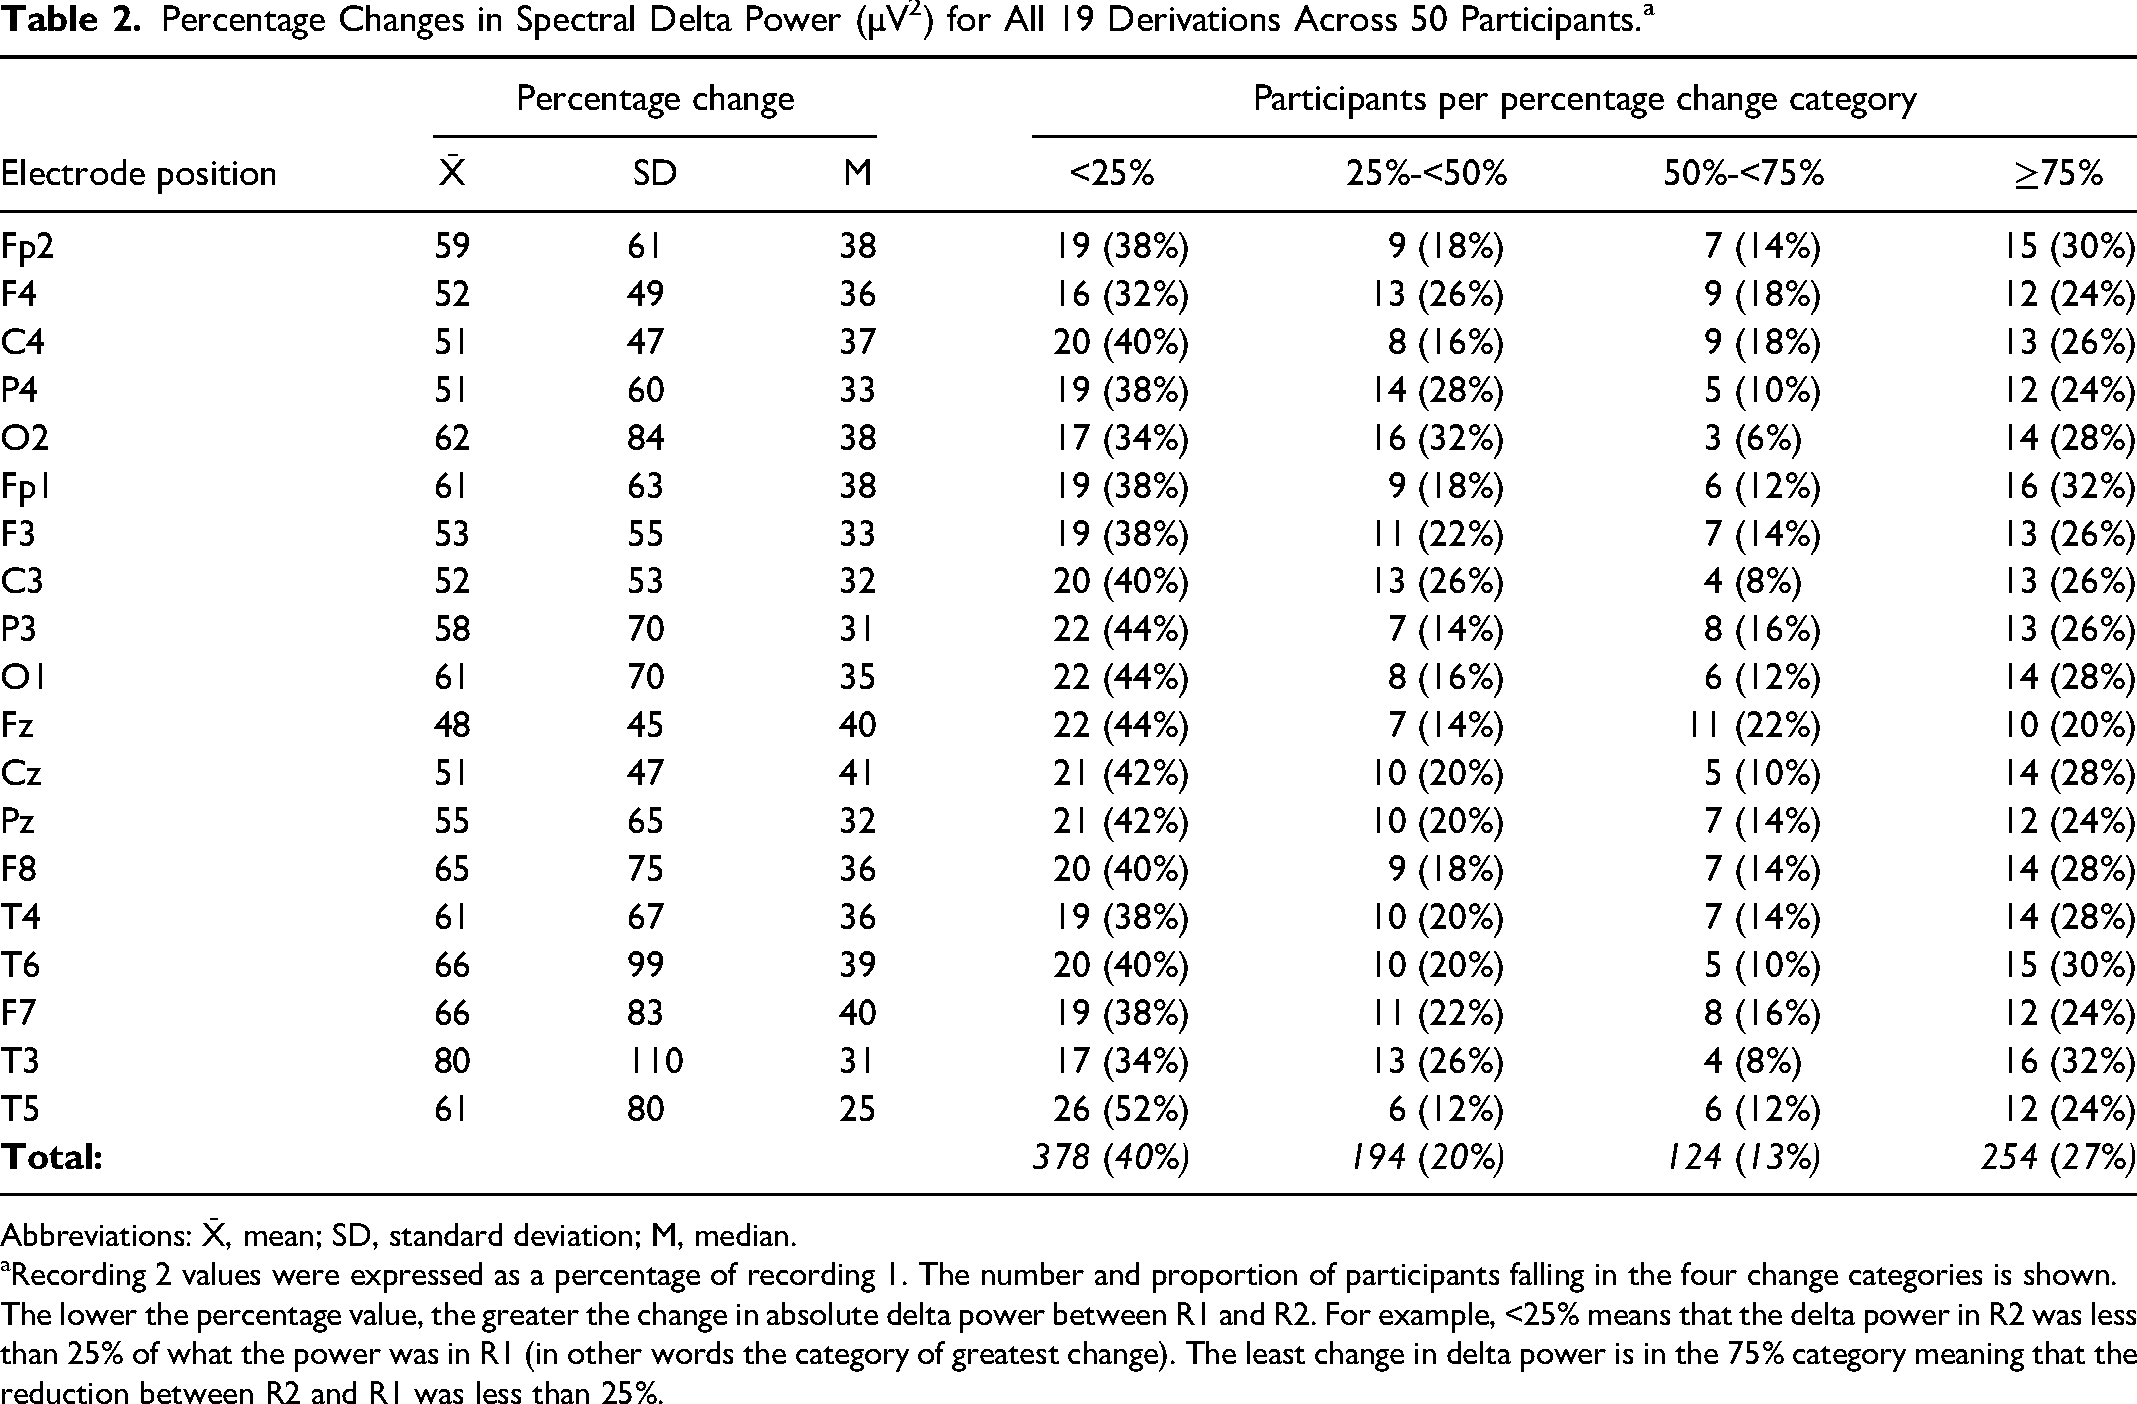
Abbreviations: X̄, mean; SD, standard deviation; M, median.
Recording 2 values were expressed as a percentage of recording 1. The number and proportion of participants falling in the four change categories is shown.
The lower the percentage value, the greater the change in absolute delta power between R1 and R2. For example, <25% means that the delta power in R2 was less than 25% of what the power was in R1 (in other words the category of greatest change). The least change in delta power is in the 75% category meaning that the reduction between R2 and R1 was less than 25%.
The pairs of recordings were divided into two groups based on the state of alertness during the EEG recordings. In 29 of 50 participants, R1 and R2 were both analyzed during the same state, either awake or asleep. For the remaining 21 participants, the state of alertness varied between R1 and R2. Fisher's exact test was applied to compare these two subgroups with respect to the percentage change in delta power between R1 and R2. The differences were not statistically significant (P = .308).
A further analysis of spectral findings was related to the retention of hypsarrhythmia (RH) in R2 or the shedding of hypsarrhythmia (SH) in R2, as determined by previous visual analysis of the EEG. Median delta power was statistically significantly higher (P < .05) for each of the 19 derivations in the RH subgroup compared to the SH subgroup.
In the RH subgroup, paired t-tests revealed significantly reduced delta power (P < .05) for 12 of 19 derivations in R2 compared to R1. Median delta power was reduced in R2 for the remaining seven derivations, but the R1 and R2 comparisons did not reach statistical significance. In the case of the SH subgroup, median delta values were highly statistically significantly (P < .0001) lower for each of the 19 derivations. The differences between the SH and RH subgroups are further depicted in Figure 2.
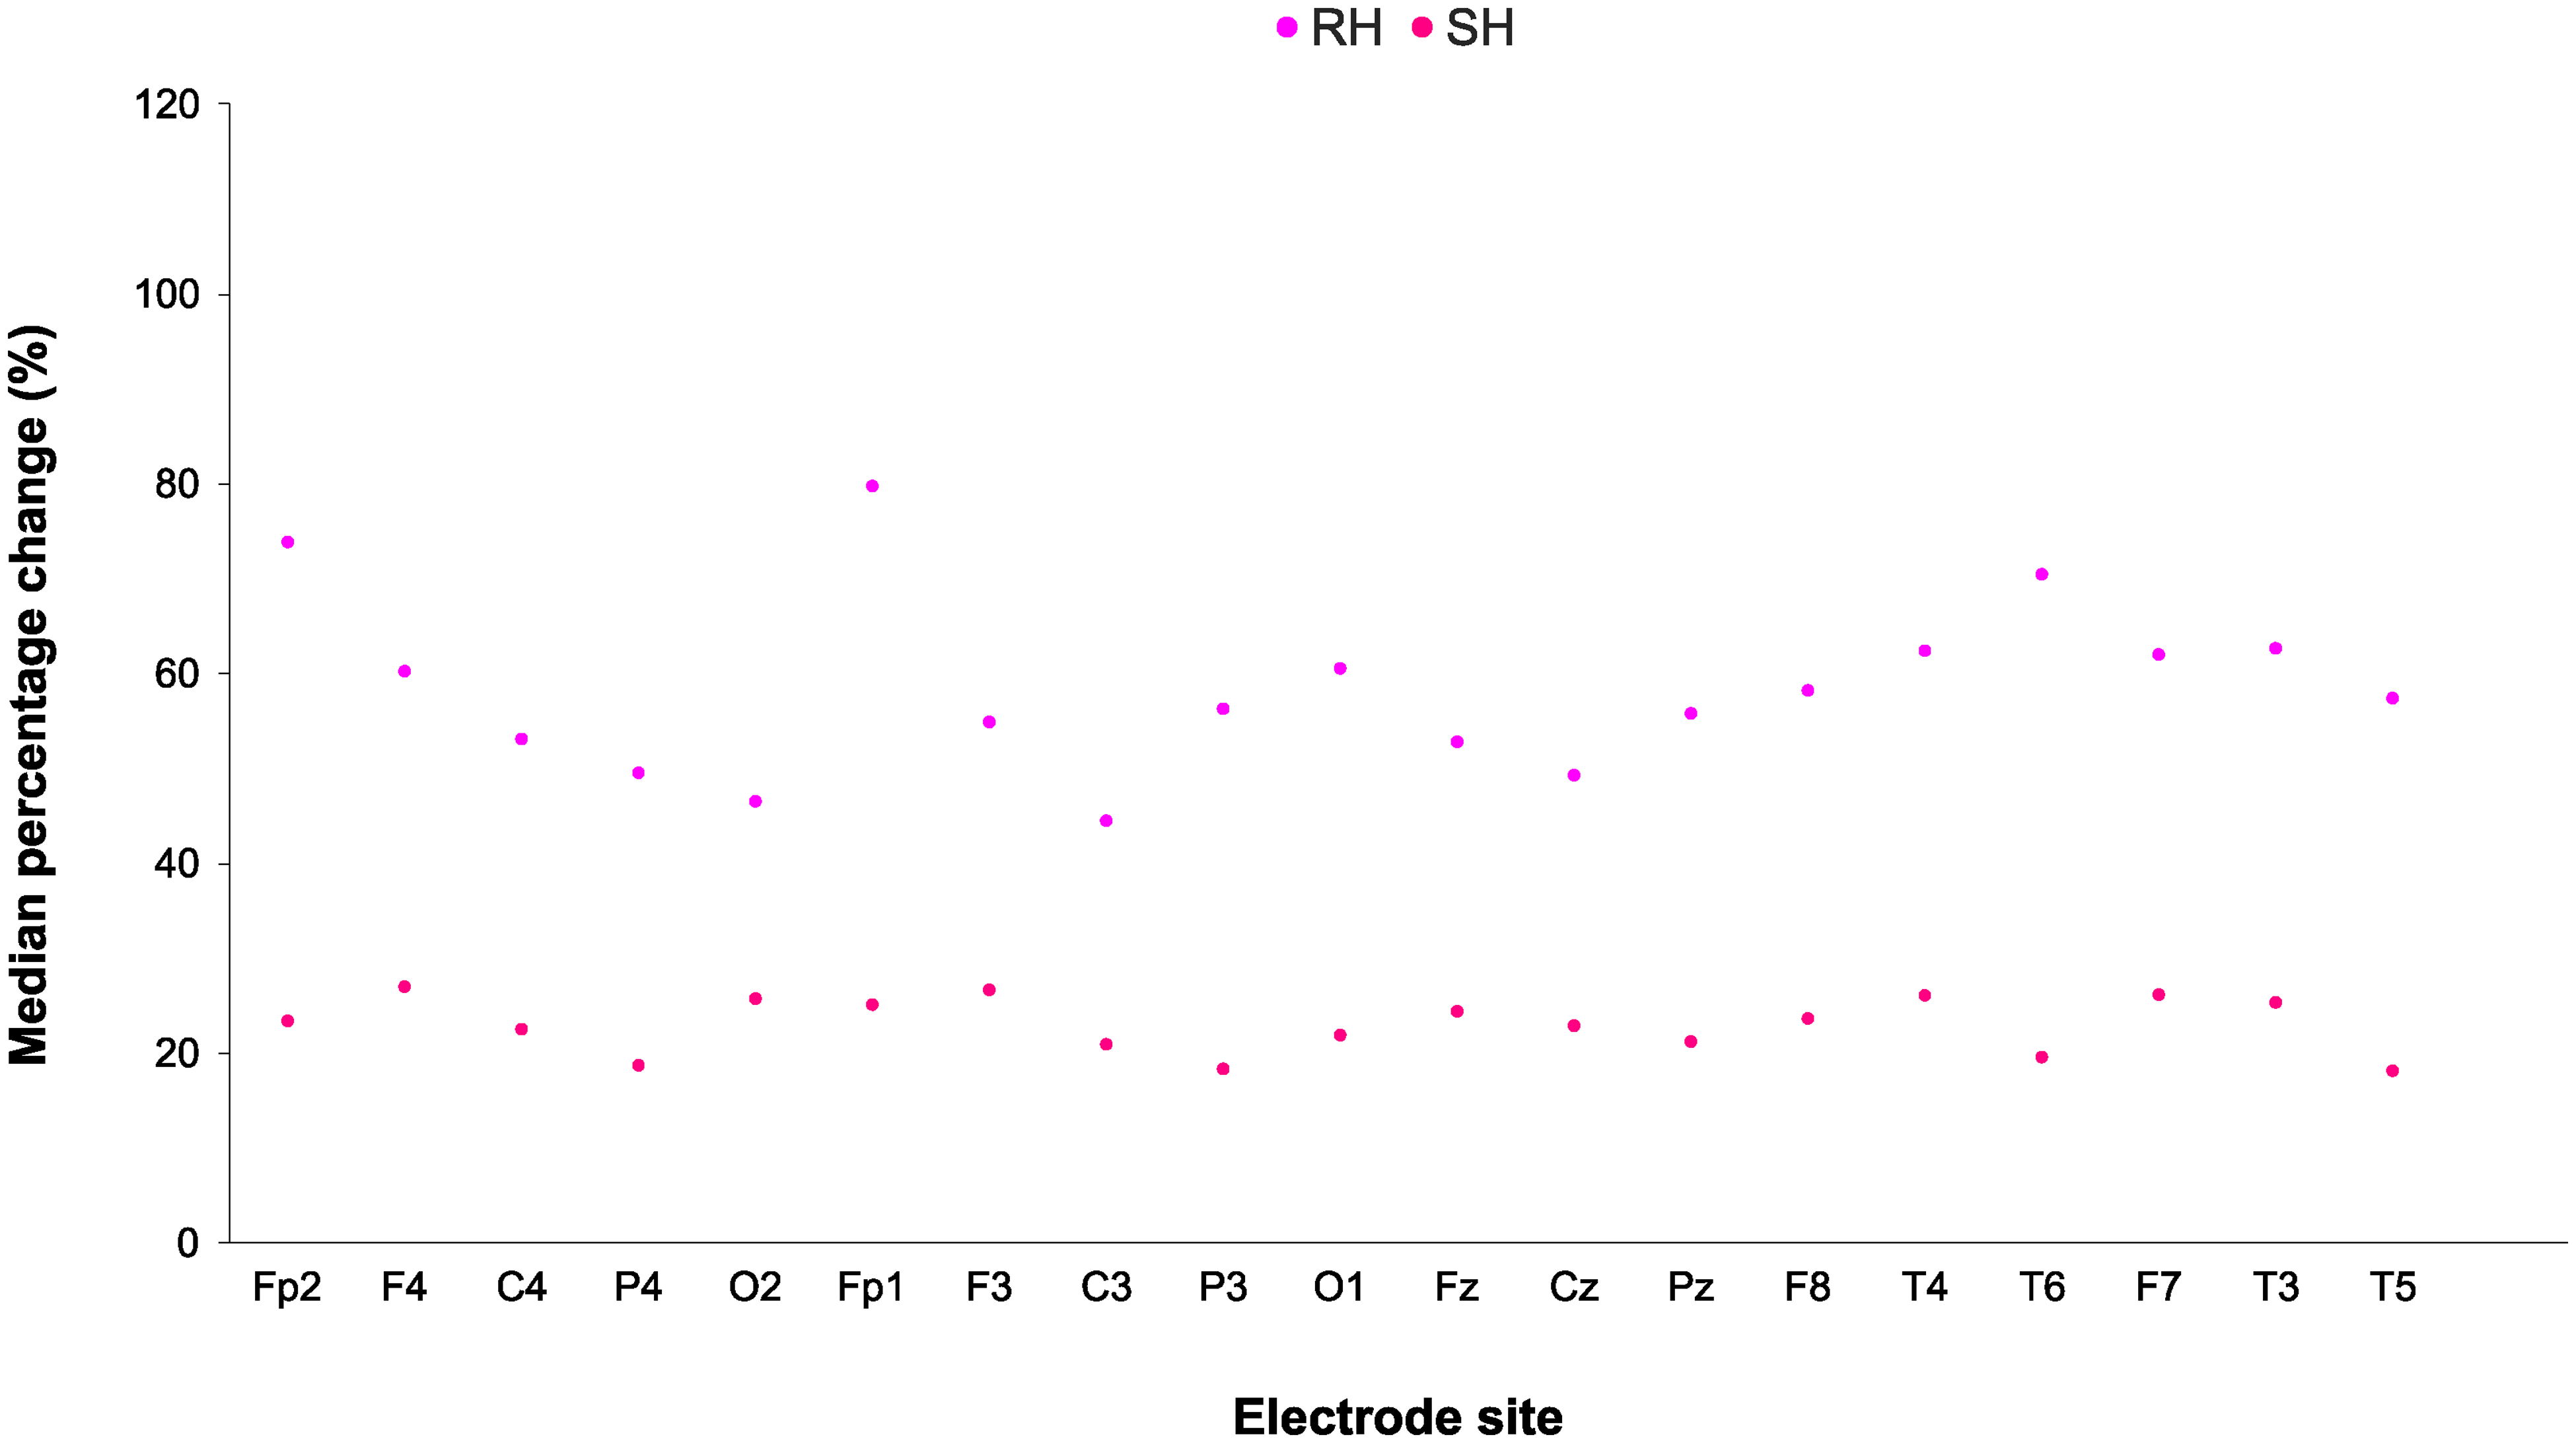
Scatterplot comparing the median percentage change values of delta power per electrode site for all 50 participants, between the RH and SH subgroups.
Overall, the median percentage change values of delta power for all 19 derivations in the SH subgroup showed a greater reduction in delta power than those of the RH subgroup. All data points for the SH subgroup are well below all the data points for the RH subgroup in Figure 2.
Discussion
Our median delta power values for participants with hypsarrhythmia in R1 were comparable to those of Jha et al. 7 Other compatible findings included a clear predominance of delta power relative to the other frequency bands. Delta power was highest in the frontal and central regions in our study, as reported by Smith et al. 5
Group power median values for the midline derivations (Fz, Cz, Pz), for example, showed a marked decrease from R1 to R2. The R2 medians decreased by 59%–66% across these derivations. Not apparent in our group findings were individual changes that spanned a broad spectrum from a greater than 75% decrease in delta power in R2 to an increase in delta power in R2. Further research is needed to explore the clinical relevance of these findings.
A novel finding is that when hypsarrhythmia was retained in R2, spectral analysis revealed statistically significant decreases in delta power, a change not easily recognized by visual analysis. For example, in this subgroup of participants, delta power in the three midline derivations unexpectedly decreased by 38%–46% despite a previous EEG report indicating the presence of hypsarrhythmia. The comparable changes in patients where hypsarrhythmia was no longer present by virtue of visual analysis had substantially higher decreases of delta power in the range of 71%–76%.
A limitation of our study was that the EEG recordings could not be consistently coordinated with the initiation of specific anticonvulsive therapy relative to R1. However, in 31 of 50 participants, treatment with vigabatrin and/or ACTH or a steroid commenced after R1. The spontaneous remission of hypsarrhythmia between the R1 and R2 recordings is deemed unlikely in the light of the findings of Hrachovy et al 9 of a spontaneous remission rate of only 2% in a one-month period. Therefore, the effects of treatment were considered the most likely factor to explain the changes in spectral power in our study.
We were not able to consistently achieve the same levels of alertness in the R1 and R2 recordings. It is known that the expression of hypsarrhythmia can vary during sleep and wakefulness. 9 It was not possible to achieve both of these states in our R1 and R2 recordings due to time constraints. In 29 of 50 pairs of recordings the same level of alertness applied in R1 and R2, but was discordant in 21 pairs of recordings. We compared these two subgroups in terms of changes in delta power between R1 and R2. There were no statistically significant differences. Therefore, in the context of our study, differences in the state of alertness were not a major factor in short-term changes in delta power. Smith et al 6 reported globally higher spectral power in ES patients during both wakefulness and sleep when compared to a control group.
A limitation of spectral analysis is that it does not include the assessment of epileptiform abnormalities, which may persist after the resolution of irregular high amplitude delta activity in patients with epileptic spasms. 10
Conclusion
While video-EEG is likely to remain the foundation for the diagnosis and therapeutic responses of epileptic spasms, 10 quantitative EEG analysis could contribute to the assessment of hypsarrhythmia. This should include the rapid short-term changes that may occur with the initiation of anticonvulsive therapy.
Footnotes
Data Availability Statement
The data that support the findings of this study are available from the corresponding author, [JMF], upon reasonable request.
Declaration of Conflicting Interests
The author(s) declared no potential conflicts of interest with respect to the research, authorship, and/or publication of this article.
Ethical Approval
This study was approved by Tshwane University of Technology Department of Biomedical Science Committee for Post Graduate Studies, the Faculty of Health Sciences Research Ethics Committee at the University of Pretoria, and Steve Biko Academic Hospital Ethics Committee through the National Health Research Database where the study was carried out.
Funding
The author(s) received no financial support for the research, authorship, and/or publication of this article.