
Abstract
Common misbehavior among children that prevents them from paying attention to tasks and interacting with their surroundings appropriately is attention-deficit/hyperactivity disorder (ADHD). Studies of children's behavior presently face a significant problem in the early and timely diagnosis of this disease. To diagnose this disease, doctors often use the patient's description and questionnaires, psychological tests, and the patient's behavior in which reliability is questionable. Convolutional neural network (CNN) is one deep learning technique that has been used for the diagnosis of ADHD. CNN, however, does not account for how signals change over time, which leads to low classification performances and ambiguous findings. In this study, the authors designed a hybrid deep learning model that combines long-short-term memory (LSTM) and CNN to simultaneously extract and learn the spatial features and long-term dependencies of the electroencephalography (EEG) data. The effectiveness of the proposed hybrid deep learning model was assessed using 2 publicly available EEG datasets. The suggested model achieves a classification accuracy of 98.86% on the ADHD dataset and 98.28% on the FOCUS dataset, respectively. The experimental findings show that the proposed hybrid CNN-LSTM model outperforms the state-of-the-art methods to diagnose ADHD using EEG. Hence, the proposed hybrid CNN-LSTM model could therefore be utilized to help with the clinical diagnosis of ADHD patients.
Introduction
Attention-deficit/hyperactivity disorder (ADHD) is a type of brain disorder, which commonly appears among young children. The global prevalence rate for school-aged children is estimated to be around 5%. 1 According to studies,2,3 around 60% of the children carries the traits into adulthood. Inattention, impulsivity, and hyperactivity are some of the characteristics of this behavioral syndrome. 4 According to the diagnosis based on the Diagnostic and Statistical Manual of Mental Disorders (DSM), 5 the cause of ADHD's underlying cognitive dysfunction is unknown. Although genetic and environmental factors may contribute to ADHD, the results of the current studies6,7 cannot be generalized to populations with clinical diagnoses because only a few DSM-IV subgroups are used to quantify ADHD symptoms. Therefore, there is a need for an efficient method for ADHD diagnosis.
Electroencephalography (EEG) is an established method for assessing differences in the electrical activity of the brain between people with ADHD and healthy controls, because of its high time resolution and simplicity of data acquisition contrasted to other neuroimaging techniques. Jasper et al’s 8 finding of a rise in the EEG power of low frequencies in fronto-central areas marked the beginning of the use of EEG in ADHD. Since then, pertinent signs of executive impairment in ADHD have been identified by human electrophysiological research employing EEG spectrum analysis and event-related potentials (ERPs). Using EEG data, Fonseca et al 9 demonstrated that absolute power is high in the delta and the theta frequency of the ADHD group compared to the healthy group.
To differentiate between ADHD and healthy controls, researchers have examined different machine learning methods. In a recent study, Tenev et al 10 presented a machine learning approach for the classification of ADHD based on EEG power spectra. In another study, Muller et al 11 explored a support vector machine for the classification of individuals with ADHD based on ERP. While prior research has used machine learning approaches to accurately separate individuals with ADHD from healthy controls with accuracy rates of more than 90%, the extraction of features from EEG that characterizes neurological disorder was carried out manually by the researchers. However, due to the non-stationary and non-linear dynamics across temporal scales, EEG signals cannot be adequately investigated using conventional machine learning techniques.
Deep learning models do not need a separate algorithm to manually extract features from the input, in contrast to traditional classification methods. The automatic extraction of useful features has allowed deep learning to perform significantly and be applied to diverse fields. Many researchers, for the identification of individuals with ADHD,12–14 have successfully applied deep learning models.
Although many researchers have explored machine learning methods and deep learning, only some of the researchers4,13,15 were able to achieve satisfying accuracy in classifying ADHD subjects due to the dissemination of clinical information across distinct lobes. Many of the EEG studies used convolution neural networks for discriminating individuals with ADHD. However, convolutional neural network (CNN) is suitable for extracting spatial features, but the problem with using CNN is to learn time-varying features to establish the correlation between the healthy controls and individuals with ADHD.
Numerous studies show that CNN-LSTM networks provide a way to combine temporal information with spatial information. A convolution layer of CNN is used to extract high-level features, and long-short-term memory (LSTM) is used to model sequence temporally. CNN-LSTM model is utilized to solve a wide range of applications.16–19 The conclusive experimental results from these research studies demonstrate that using sequential and spatial features together improves the performance of EEG signal classification.
The current study's objective was to develop a method for assessing attention in children with ADHD using a hybrid CNN-LSTM model that used EEG signals to identify and diagnose the ADHD disorder. The authors also used t-distributed stochastic neighbor embedding (t-SNE) 20 to create a clear and flawless display of the high-dimensional data with precise separations between individuals with ADHD and healthy controls.
The main contributions of the study are:
The authors introduce a novel hybrid CNN-LSTM model for the identification of ADHD. The spatial elements of the EEG data are extracted using CNN's 1D convolution, and sequence learning is then performed using LSTM's subsequent module. As a result, it is a complete model that permits learning about EEG signals’ local features as well as long-term dependencies. The authors also used the t-SNE method
20
for visualizing data and enhancing the interpretability of the proposed model. The proposed hybrid CNN-LSTM model's performance was assessed with state-of-the-art methods. Experimental findings show that for both datasets, the proposed model outperforms the previous studies.
Methods
EEG Datasets
This study used 2 public datasets of ADHD/healthy controls, provided by the IEEE data port. The description of both datasets is given in the following subsections.
ADHD Dataset
The experiments were carried out on the dataset from “EEG data for ADHD/control children” 21 that is publicly available on the IEEE data port. The dataset included 121 subjects, out of which 61 children were ADHD and 60 were healthy controls consisting of both boys and girls between the ages of 7 and 12. Based on DSM-IV guidelines, 22 an expert psychiatrist diagnosed the individual with ADHD, and they were administered Ritalin for up to 6 months. Among the healthy controls, there were no reports of psychiatric illnesses.
FOCUS Dataset
The authors used the dataset FOCUS 23 which is publicly available on the IEEE data port. The player's purpose in this game is to collect as many yellow cubes as possible in the lowest amount of time feasible using mental instructions, such as the “push” command and the “neutral” condition. The EMOTIV device collects data from the 14 electrodes. The researchers examined EEG recordings of 5 healthy men (ages 19-26) and 4 individuals with ADHD consisting of 2 males (18 and 23 years old) and 2 females (21 and 22 years old) who were playing with the EMOTIV.
Preprocessing
The EEG signal is filtered using a finite impulse response filter between the most informative frequency ranges, 1 to 50 Hz. To reduce power distortion, a 50 Hz IIR notch filter was utilized. The authors then employed the ICA runica method with a 90% threshold to analyze raw EEG signals and remove ocular artifacts. Figure 1 displays the interpolated scalp maps of the 19 independent components (ICs) created by extended ICA decomposition of the 19-channel trials of a single ADHD patient and single control. Each map has been scaled to the highest absolute value possible. IC 18 and IC 19 for healthy control (Figure 1b) account for noise. Similarly, IC 17 and IC 19 for individuals with ADHD (Figure 1a) account for noise. EEGLAB toolbox 24 is employed for preprocessing.
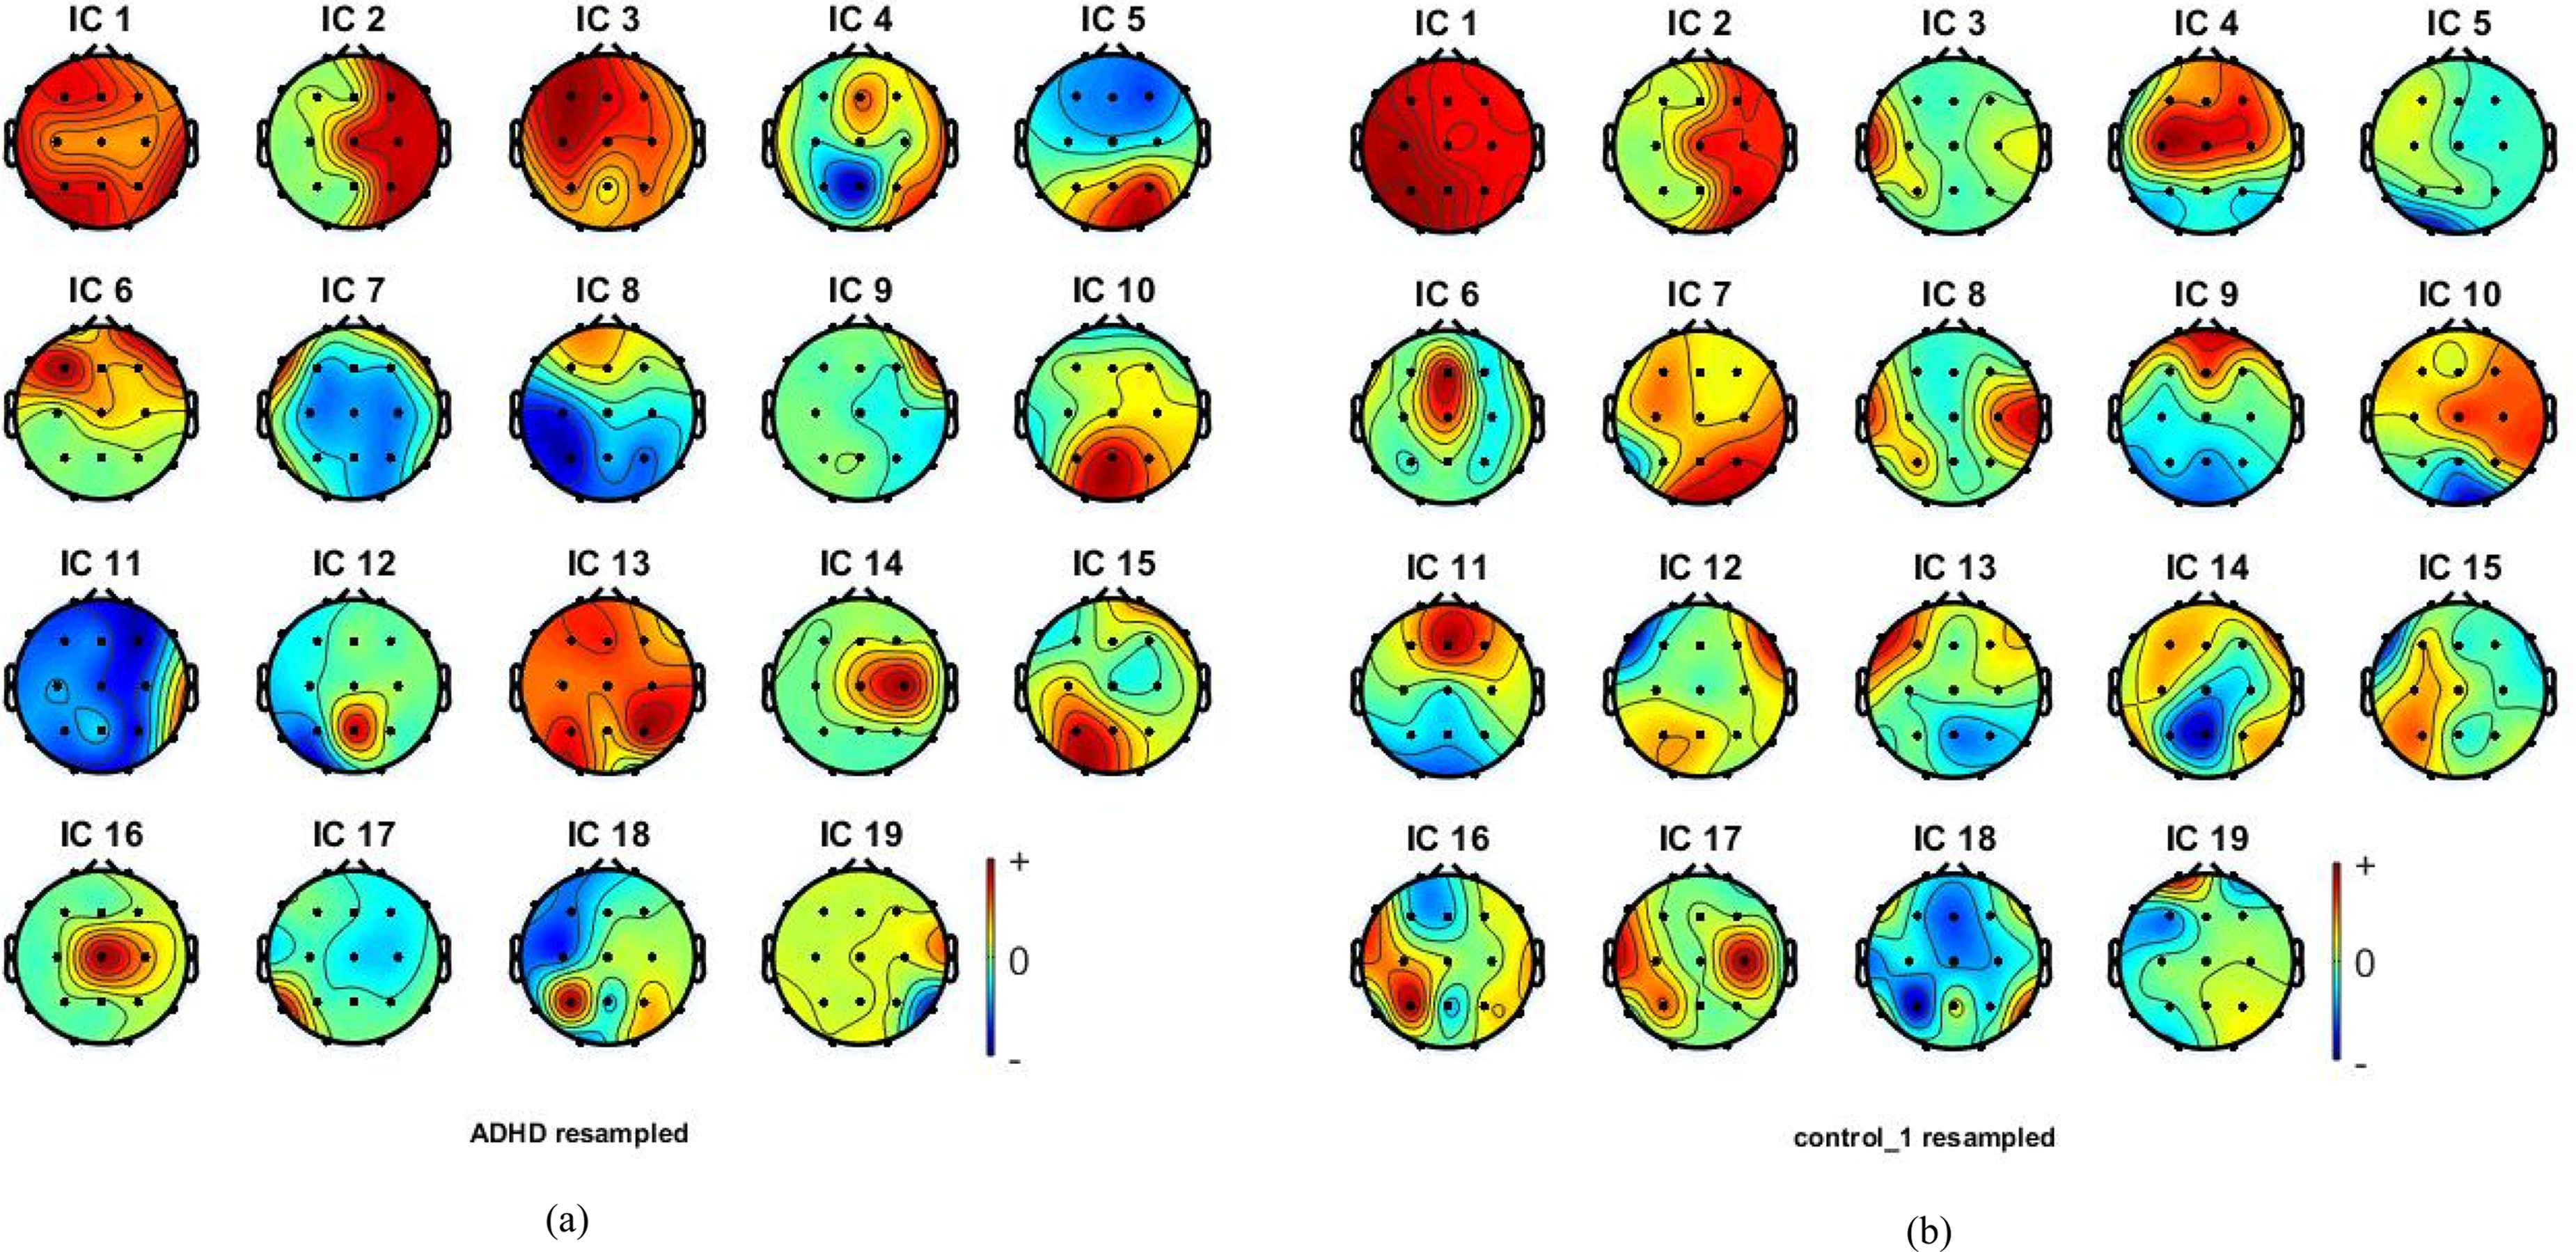
Interpolated scalp maps of 19 independent components of single (a) individual with ADHD and (b) Healthy control.
For the FOCUS dataset, to improve the accuracy of the model data windowing of size 5 s was applied, which increases the total number of data samples for all subjects to 57,000 samples.
Convolution Neural Network
CNN
25
consists of convolutional layers, pooling layers, and fully connected layers. To determine the output, the convolutional layer calculates the scalar product across the weights and areas of neurons connected to the input. During the convolution, process kernels slide over the data to generate feature maps. The following equation is used to obtain the convolved output:

Learning With Long-Short-Term Memory Networks
LSTMs are one of the classes of recurrent neural networks (RNNs) that use weight sharing across networks to interpret sequential data. LSTM was proposed by Hochreiter and Schmidhuber (1997) 26 which can recognize long-term relationships and is ideal for classifying time series data.
The LSTM design makes use of specialized hidden units called memory cells, which retain long-term information of past input. 27 The other important part of LSTM is the gates. The input gates and forget gates modify the memory cell's internal contents. The contents of the memory cell won’t change between one-time step and the next gradients, which allow the information to be retained over a large number of time steps thanks to gating structures, which also enable groups of information to flow across a large number of time steps. This enables the LSTM model to effectively deal with the vanishing gradient issue that most RNN models experience.
Proposed Hybrid CNN-LSTM Model for ADHD Diagnosis
EEG signals typically have a low signal-to-noise ratio and a lot of noise. EEG is highly non-stationary and changes with time within a single subject and between 2 separate individuals.28,29 Using EEG to detect individual with ADHD reliably and accurately is still difficult. The detection procedure is often divided into 2 parts by classical methods: feature extraction and classification. Typically, feature extraction requires hand-crafted effort, which could result in the loss of important EEG information. 30 Thus, tools that can extract the complex spatiotemporal hierarchical structures concealed in these data are needed.
Recent advances in deep learning techniques, which have been used in a variety of fields, enable automatic feature extraction and feature selection and are capable of dealing with the limitations of hand-crafted features. 31 CNNs have shown success in a variety of difficult classification problems, making them one of the most important developments in DL.32–34 According to Schirrmeister et al (2017), 35 CNN has a unique ability to be used for end-to-end learning without any a priori feature selection, preventing information loss. Hence, lots of EEG-based applications36–42 and brain-computer interface43,44 have used CNN.
Although raw EEG and stationary data like photos can be processed using CNNs, these models are relatively weak at learning sequential information, as already stated in the ‘Introduction’ section. LSTM, on the other hand, can be used to extract and handle temporal data effectively. To overcome this problem, a hybrid deep learning model based on a combination of CNN and LSTM was applied in this study.
Architecture of Proposed Hybrid CNN-LSTM Model
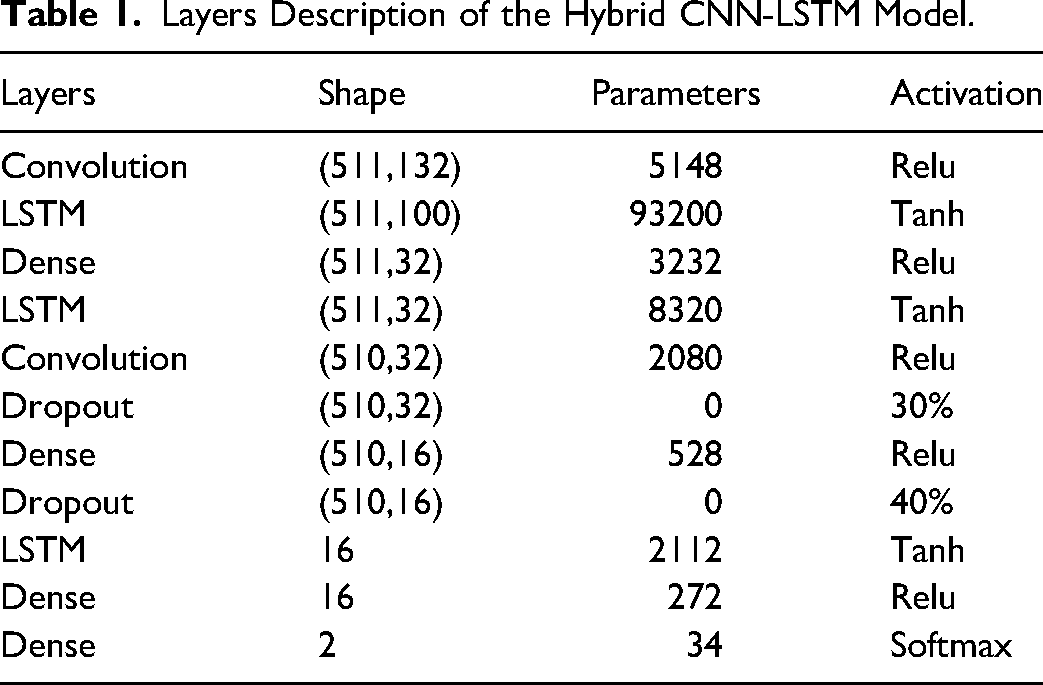
The proposed model is composed of 2 convolution layers, 3 LSTM layers, 3 dense layers, and a softmax layer. The first layer is the convolution layer, which performs a convolution operation on the input. For sequence learning, layers 2 and 4 were used, composed of LSTM structure. After LSTM layer convolution operations were applied to extricate eminent characteristics that can aid in the discrimination of ADHD from healthy controls. The acquired feature maps were input into the dense layer after passing through the convolution layer. The dropout was applied to the dense layer's output to address the problem of overfitting. Finally, the softmax layer was used for the eventual recognition of individuals with ADHD. The layers utilized to create the CNN-LSTM model, as well as the parameters associated with each layer, are listed in Table 1.
Layers Description of the Hybrid CNN-LSTM Model.
Results
Topographical Analysis
Figure 2 displays the topographical maps of the power spectrum density of a single individual with ADHD and healthy control. In comparison to the healthy control group, individuals with ADHD demonstrated a widespread, significant increase in absolute theta power, particularly in the frontal and posterior regions. Other frequency bands do not significantly differ, and both ADHD individual and healthy controls exhibit symmetrical spatial power distribution.
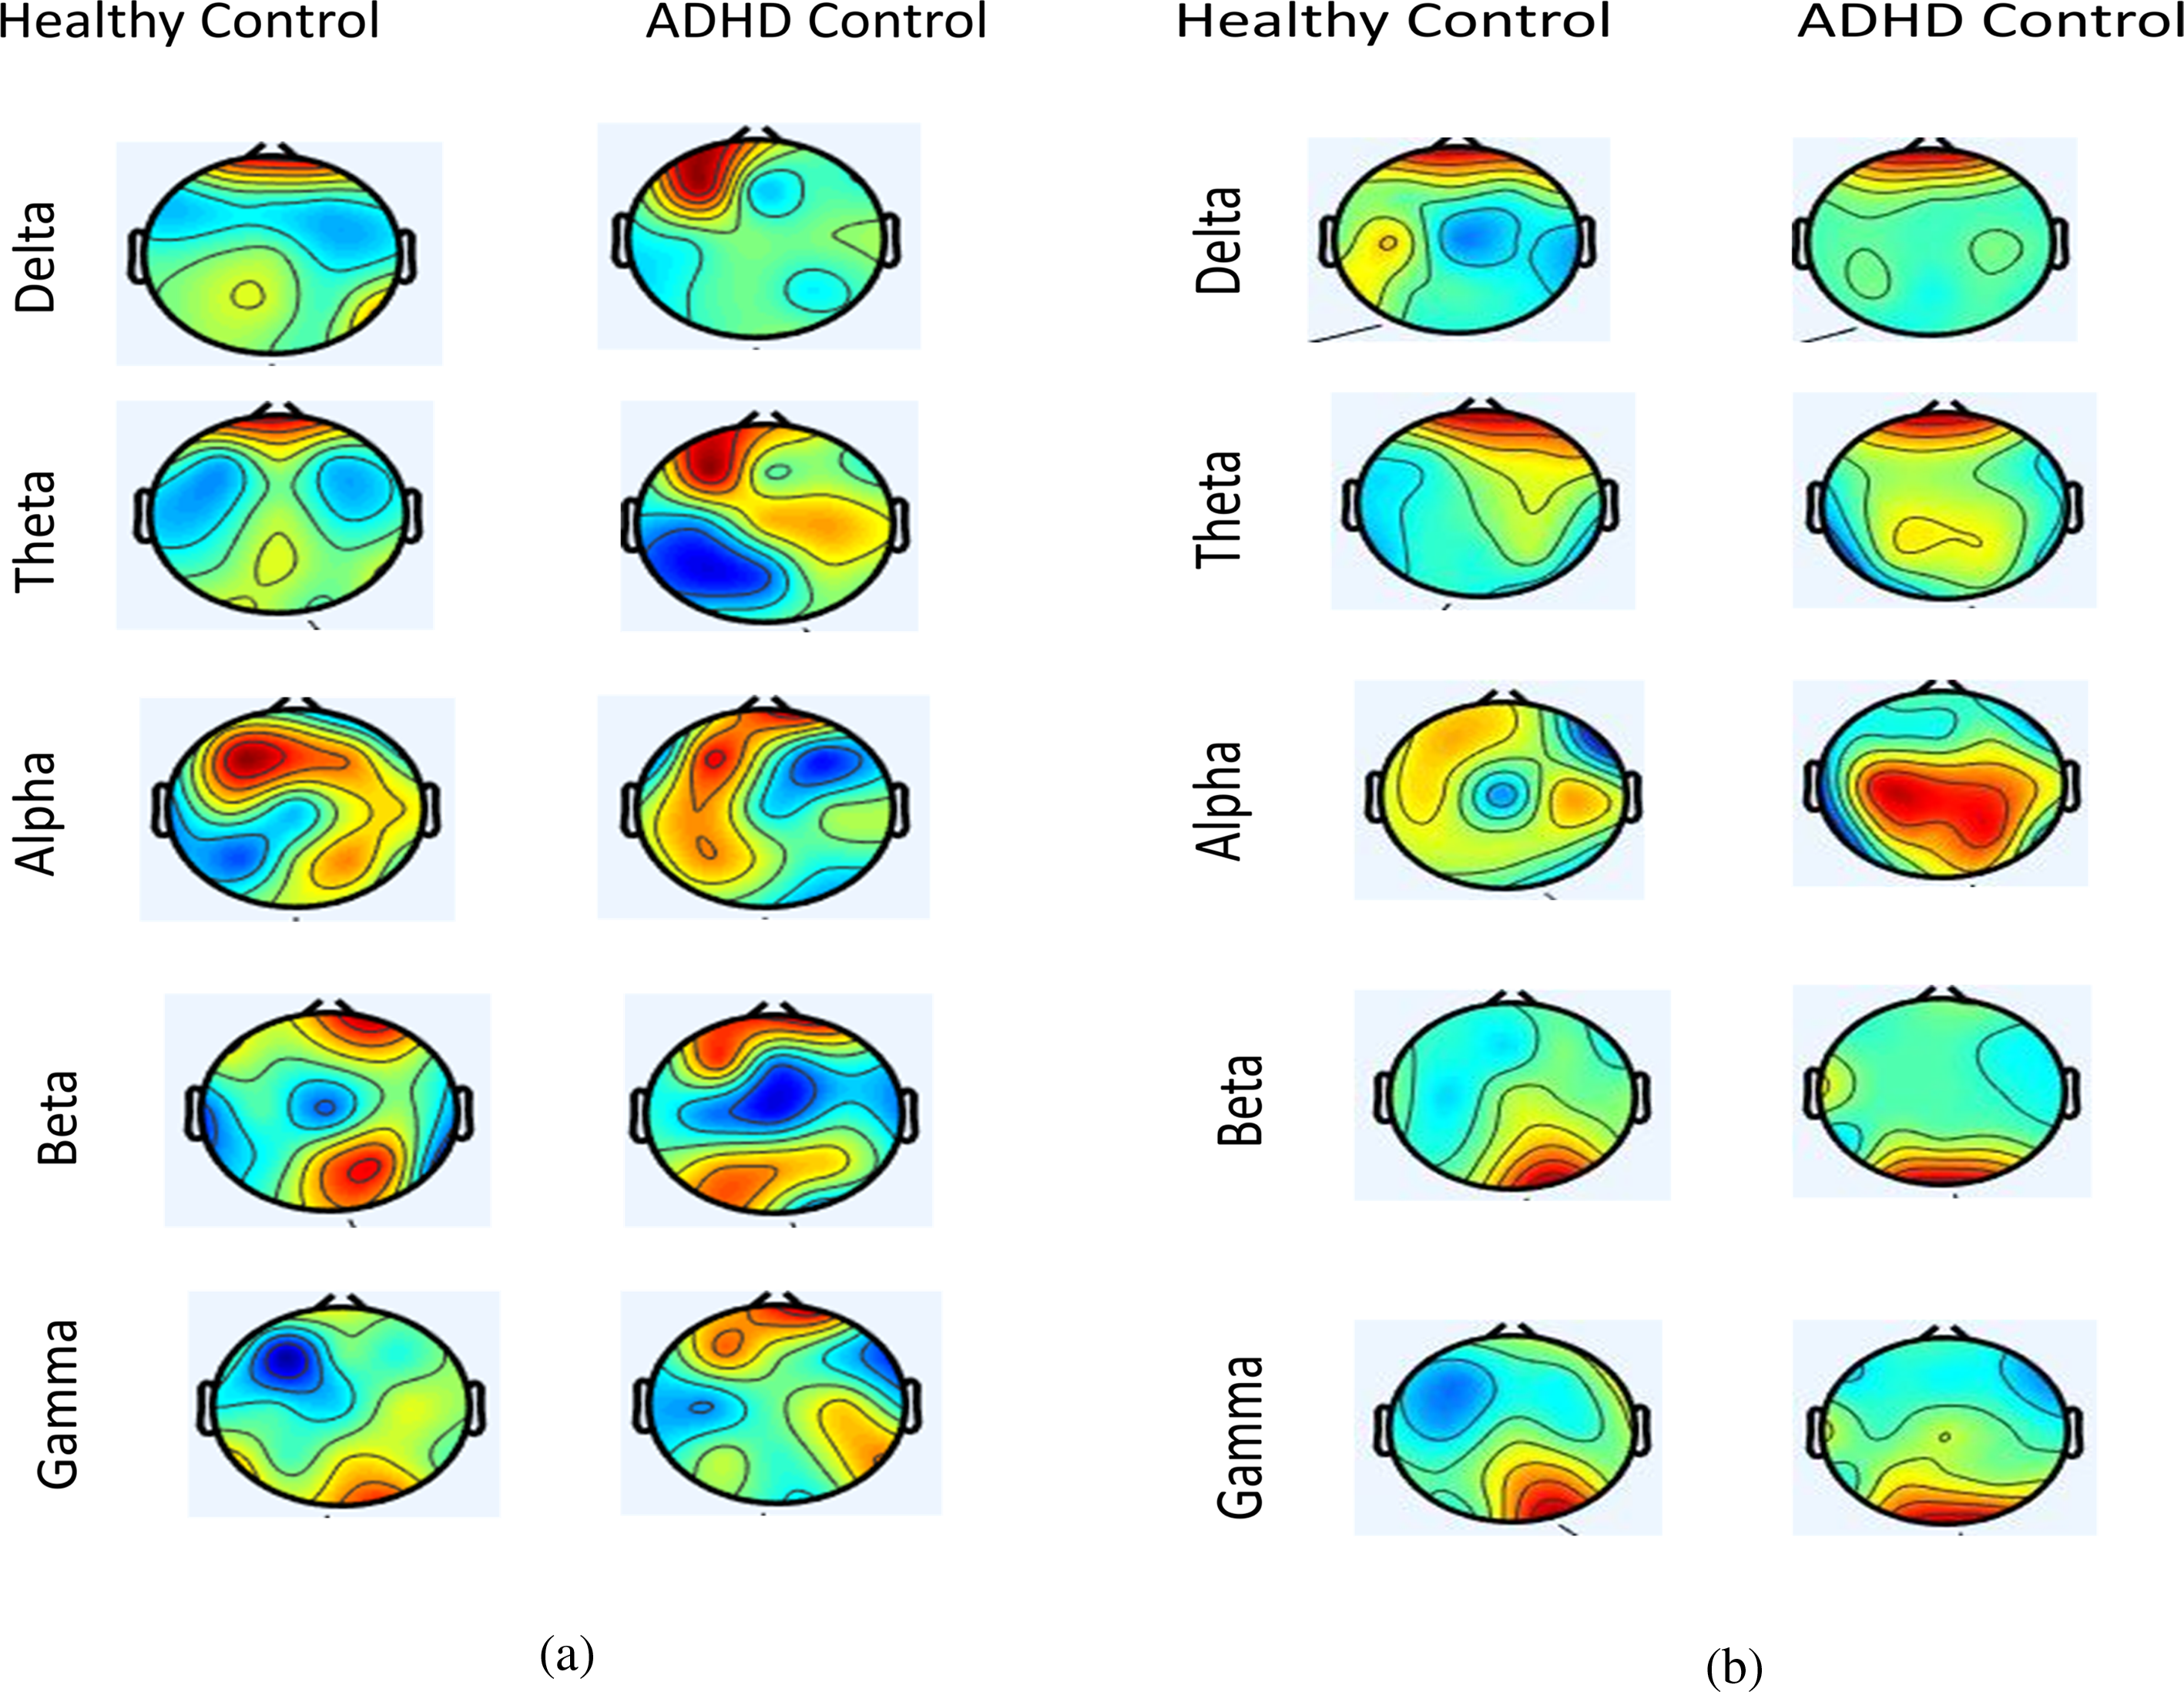
Topographical maps of power spectrum density of single ADHD individual and healthy controls for (a) ADHD and (b) FOCUS dataset.
The authors further obtained theta power values for all the electrodes and applied t-test to compare the difference between theta power and zero for both the group. The results indicated that the theta power was significantly higher than zero in the children with ADHD for both ADHD (ADHD: t = 4.367, P = .01; healthy control: t = −1.323, P = .79) and FOCUS (ADHD: t = 5.76, P = .03; healthy control: t = 1.876, P = .85) dataset. The pattern of theta lateralization was consistent with earlier research45,46 and is found to be a typically stable feature in ADHD. 47 The posterior theta lateralization has been associated with both symptoms of inattention and hyperactivity/impulsivity. 48 Thus, it may be concluded that children with ADHD have greater slow activity in the lower-frequency range. Although we did not find a significant correlation between the theta-band EEG indexes and the clinical severity of ADHD in our research, these EEG indexes can still be used as potential features to distinguish children with ADHD.
ADHD Identification
The performance of the proposed model is verified in 2 phases: (1) Phase 1: Training and testing were carried out utilizing 70% and 30% of each dataset, respectively, of the ADHD and FOCUS datasets. (2) Phase 2: The authors performed training with the ADHD test dataset and external validation with the FOCUS dataset. The flowchart for the steps followed for ADHD identification is shown in Figure 3.
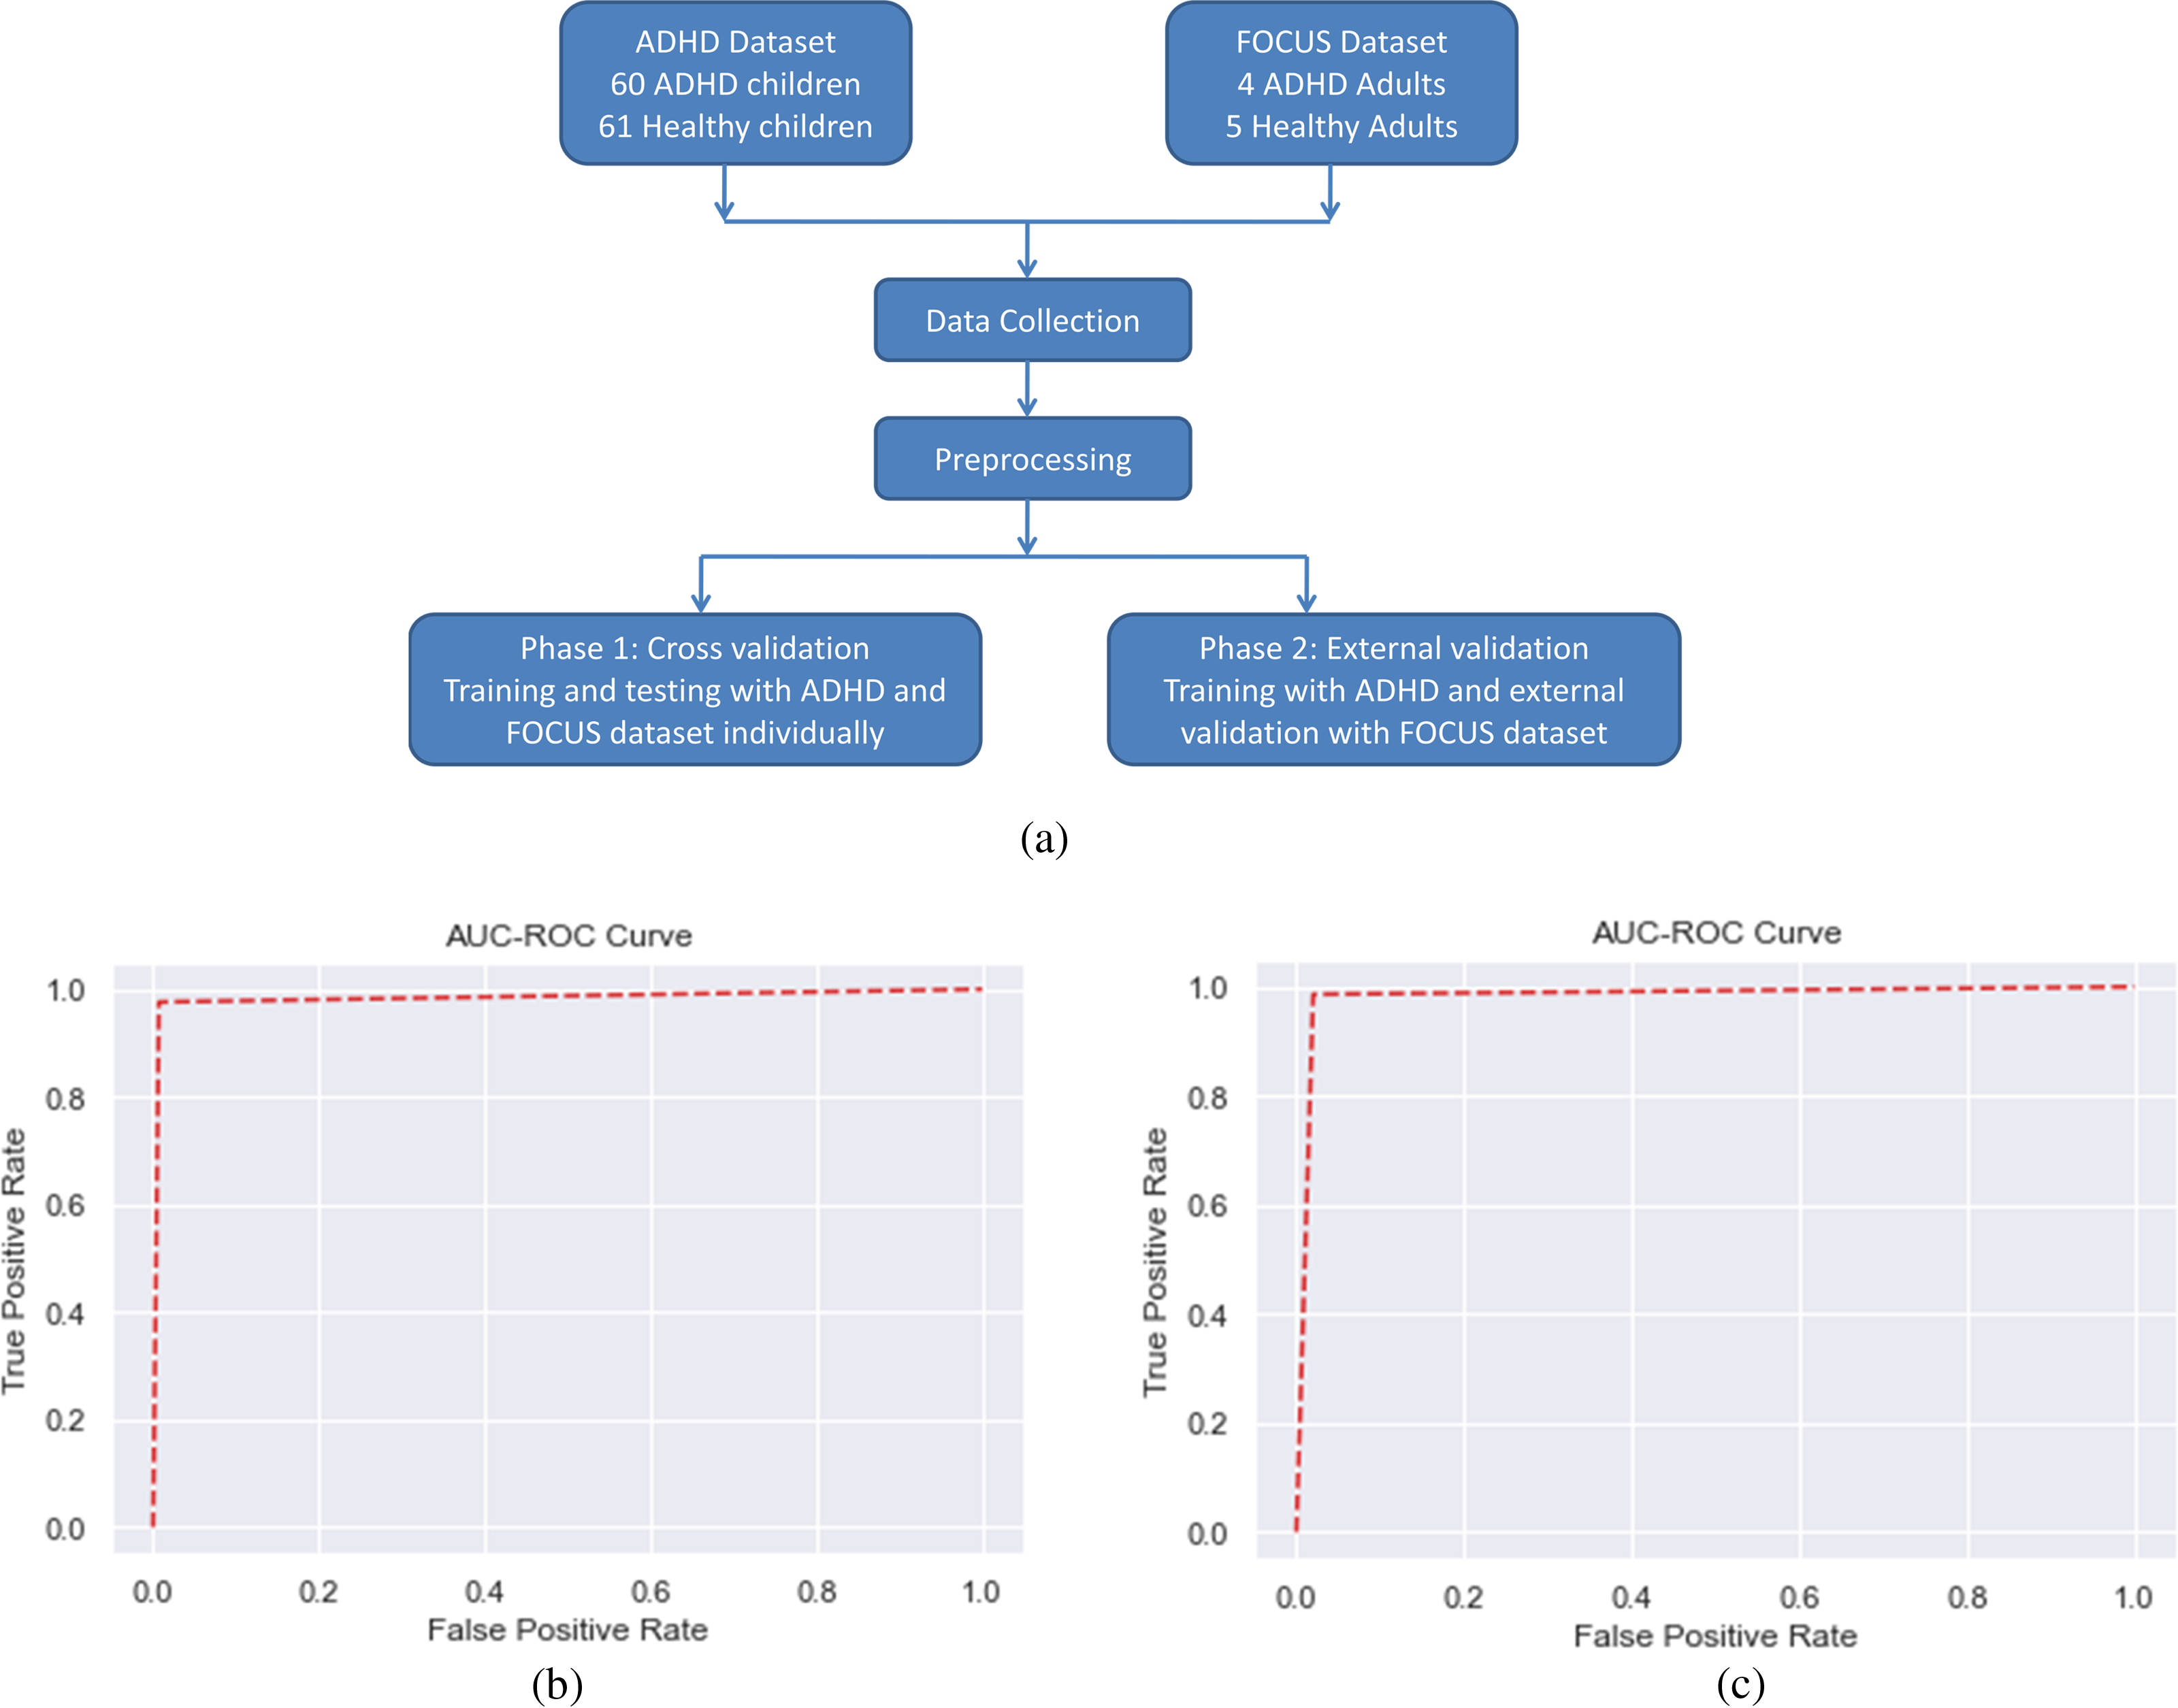
Flowchart for ADHD identification and ROC curve for 3-fold cross-validation. (a) Flowchart for ADHD identification. (b) ADHD Dataset. (c) FOCUS Dataset.
Phase 1: Internal Validation
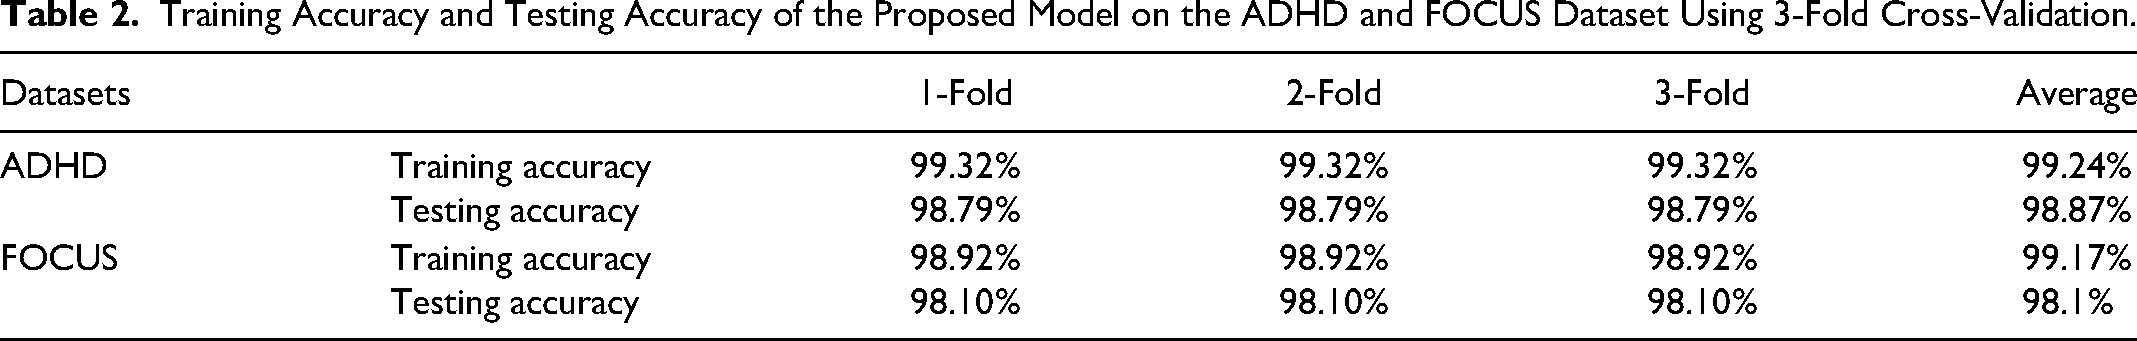
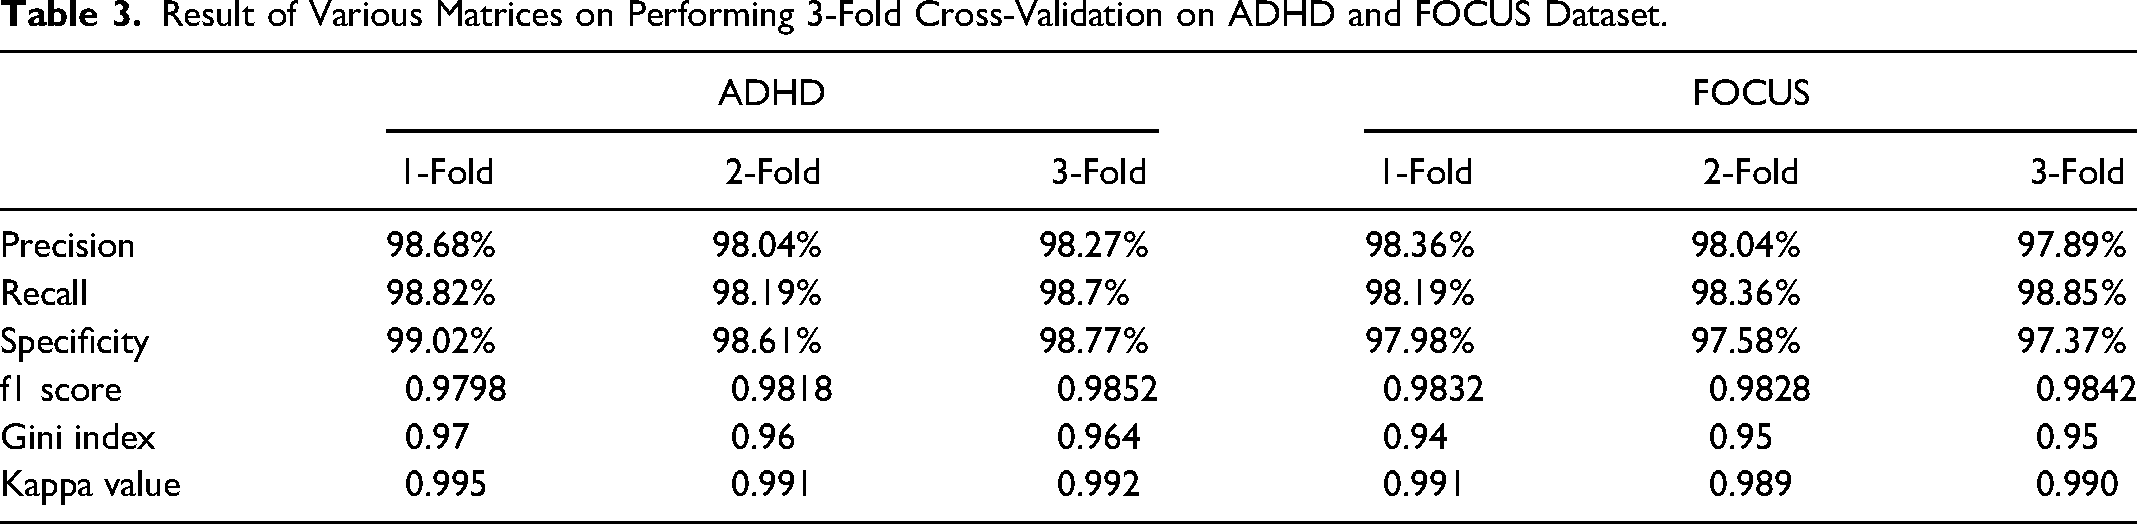
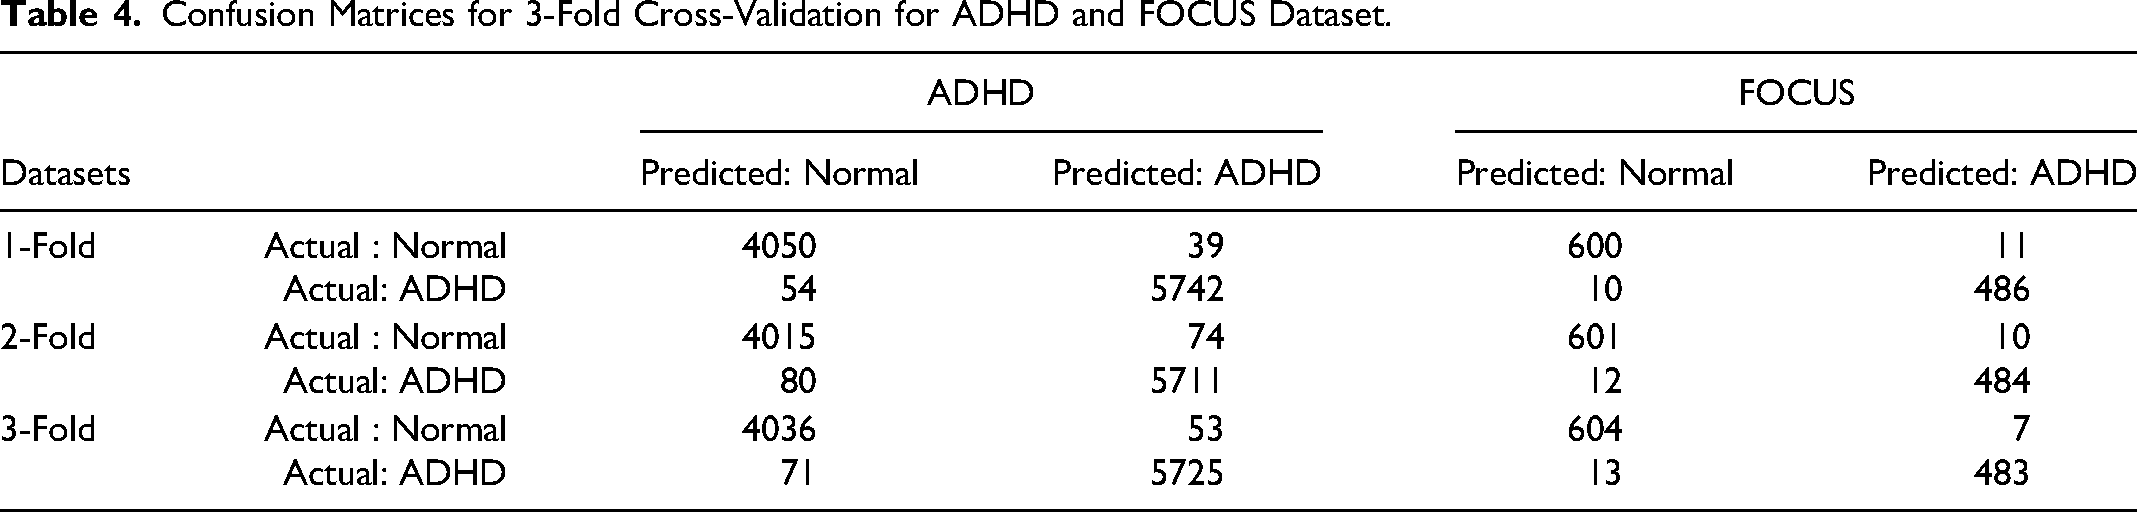
The internal validation was carried out using 3-fold cross-validation to evaluate the model detecting individuals with ADHD and healthy controls using a test set. The accuracies of the training and testing phases for each fold and their averages for the ADHD dataset and FOCUS dataset are shown in Table 2. The result of other performance matrices is shown in Table 3. The confusion matrices computed for 3-fold cross validation for ADHD and FOCUS dataset is shown in Table 4.
Training Accuracy and Testing Accuracy of the Proposed Model on the ADHD and FOCUS Dataset Using 3-Fold Cross-Validation.
Result of Various Matrices on Performing 3-Fold Cross-Validation on ADHD and FOCUS Dataset.
Confusion Matrices for 3-Fold Cross-Validation for ADHD and FOCUS Dataset.
A graphical representation of the ROC curve for binary classification with various discrimination thresholds is shown for the true-positive rate and the false-positive rate. In medical diagnosis, a high true-positive rate is more desirable than a false-positive rate. The ROC curve for the hybrid CNN-LSTM model used to analyze the ADHD dataset and FOCUS dataset is shown in Figure 3(b) and Figure 3(c), respectively.
The authors used the inverse probability weighting (IPW) method to take into account the gender distribution imbalance that existed between the ADHD and control groups in the FOCUS dataset, which could be considered as a confounding factor. 49 IPW is a method that assigns different weights to the subjects in the training process based on the inverse of their propensity score 50 to achieve a similar distribution in each group. After using the IPW approach, it was discovered that the average accuracy was 97.23%. Since there is no discernible difference between average accuracy with and without IPW correction, gender may not be a confounding factor. However, the sample size is very small, and further study is needed to confirm if males and females experience ADHD in different ways.
Phase 2: External Validation
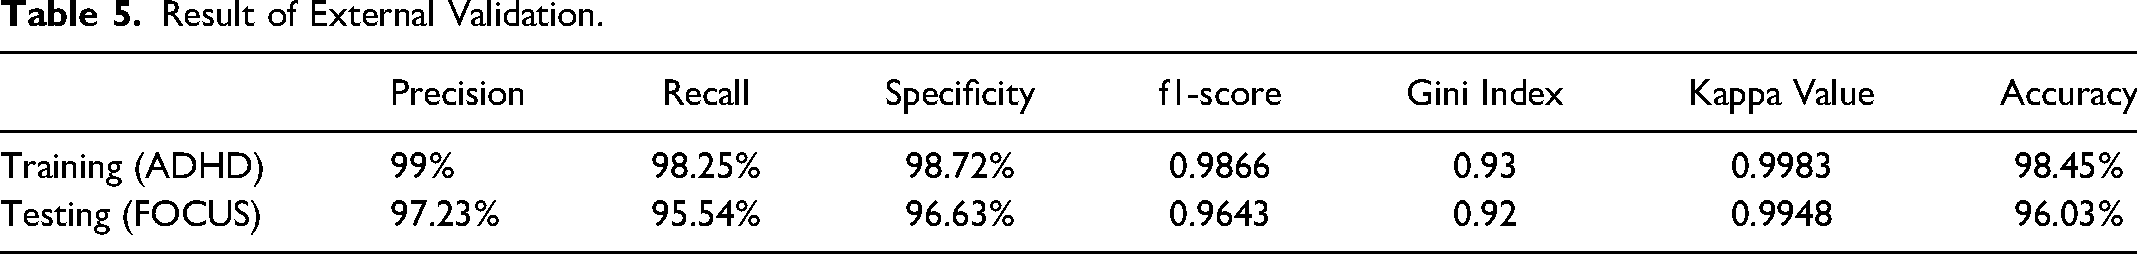
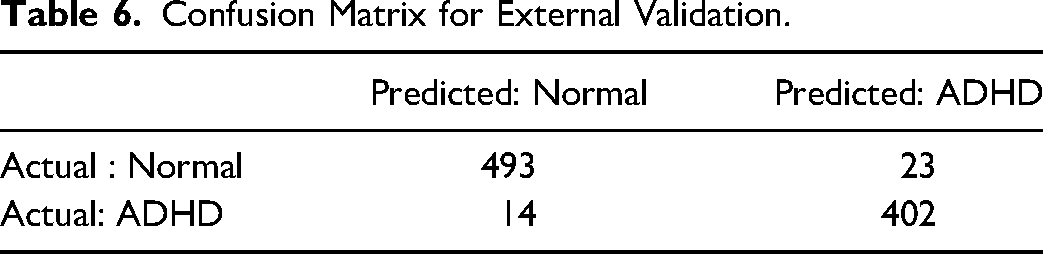
To evaluate the robustness of the proposed model, external validation is performed on the FOCUS dataset to identify individuals with ADHD that belong to completely different settings and populations. When compared to the local test set, the subjects for external validation were adults and few. The performance matrix values of the trained model in differentiating ADHD individuals from healthy controls are given in Table 5. The confusion matrix is given in Table 6.
Result of External Validation.
Confusion Matrix for External Validation.
Compared to the internal validation study, the application of the proposed model to the external validation study yielded a modestly lower accuracy. As shown in Figure 4, the model has less true-positive rate with the external study as compared to the internal validation but still represent a good indicator of separability between ADHD individuals and healthy controls.
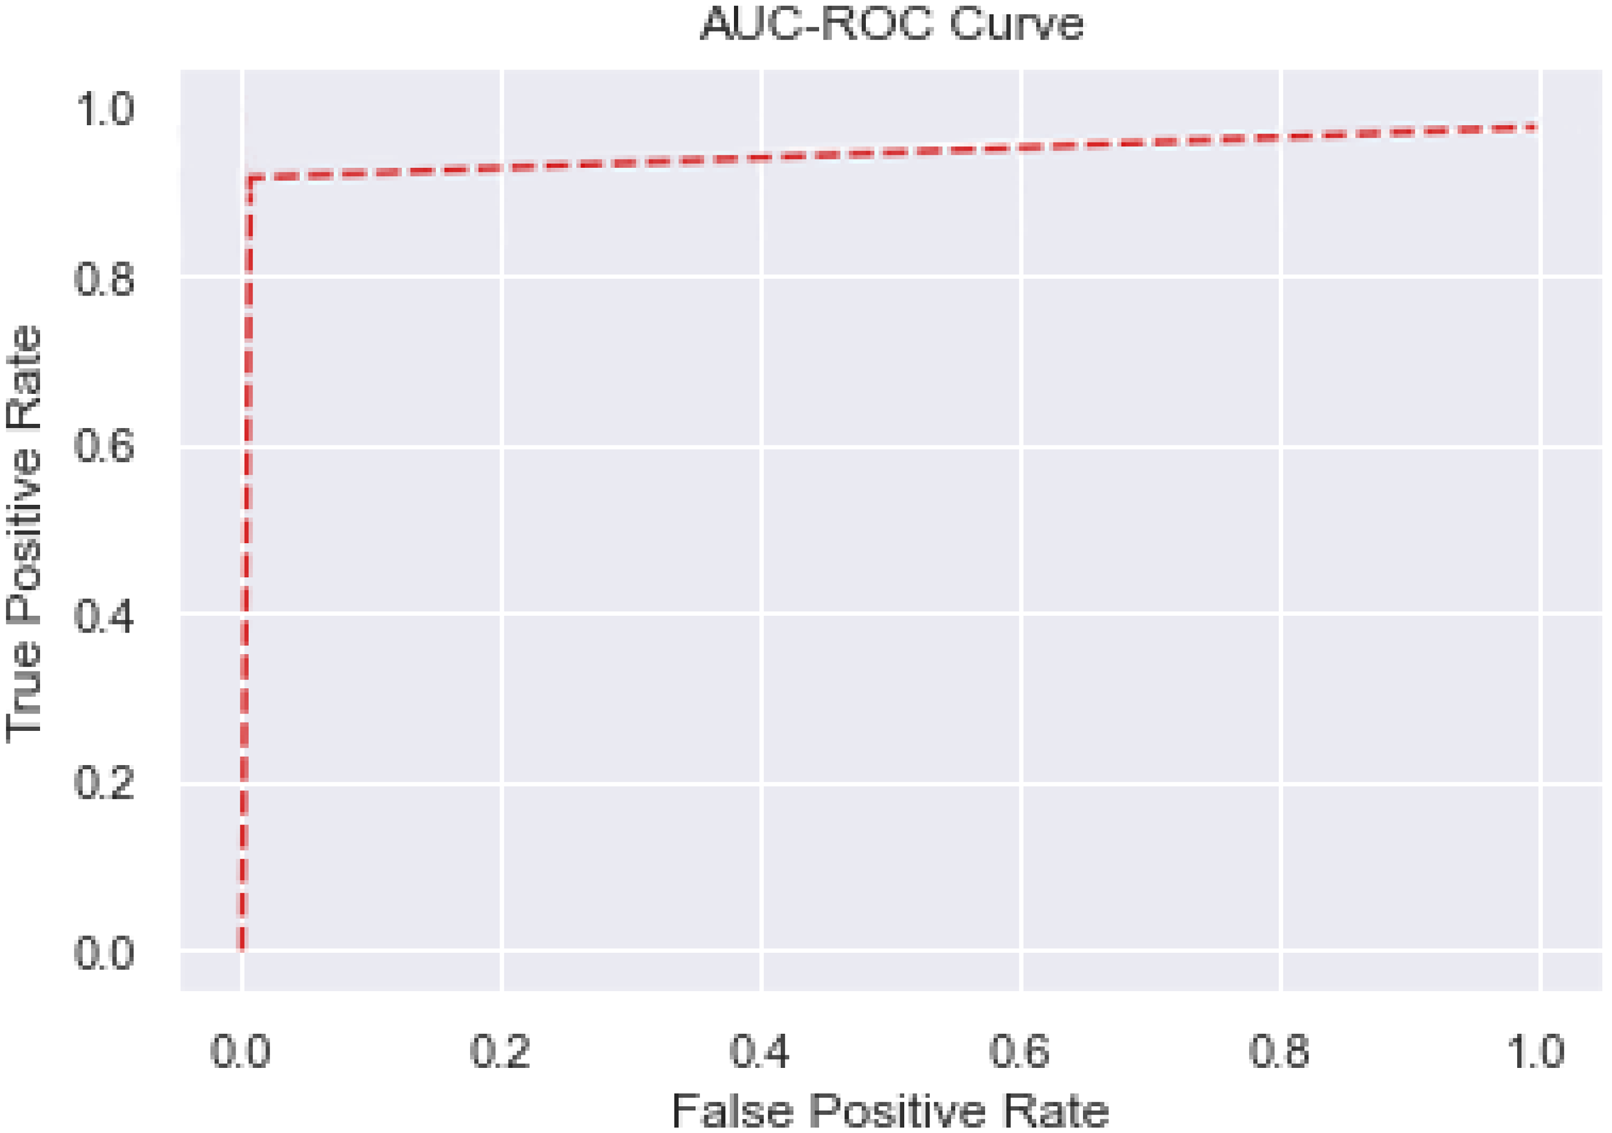
ROC curve for external validation.
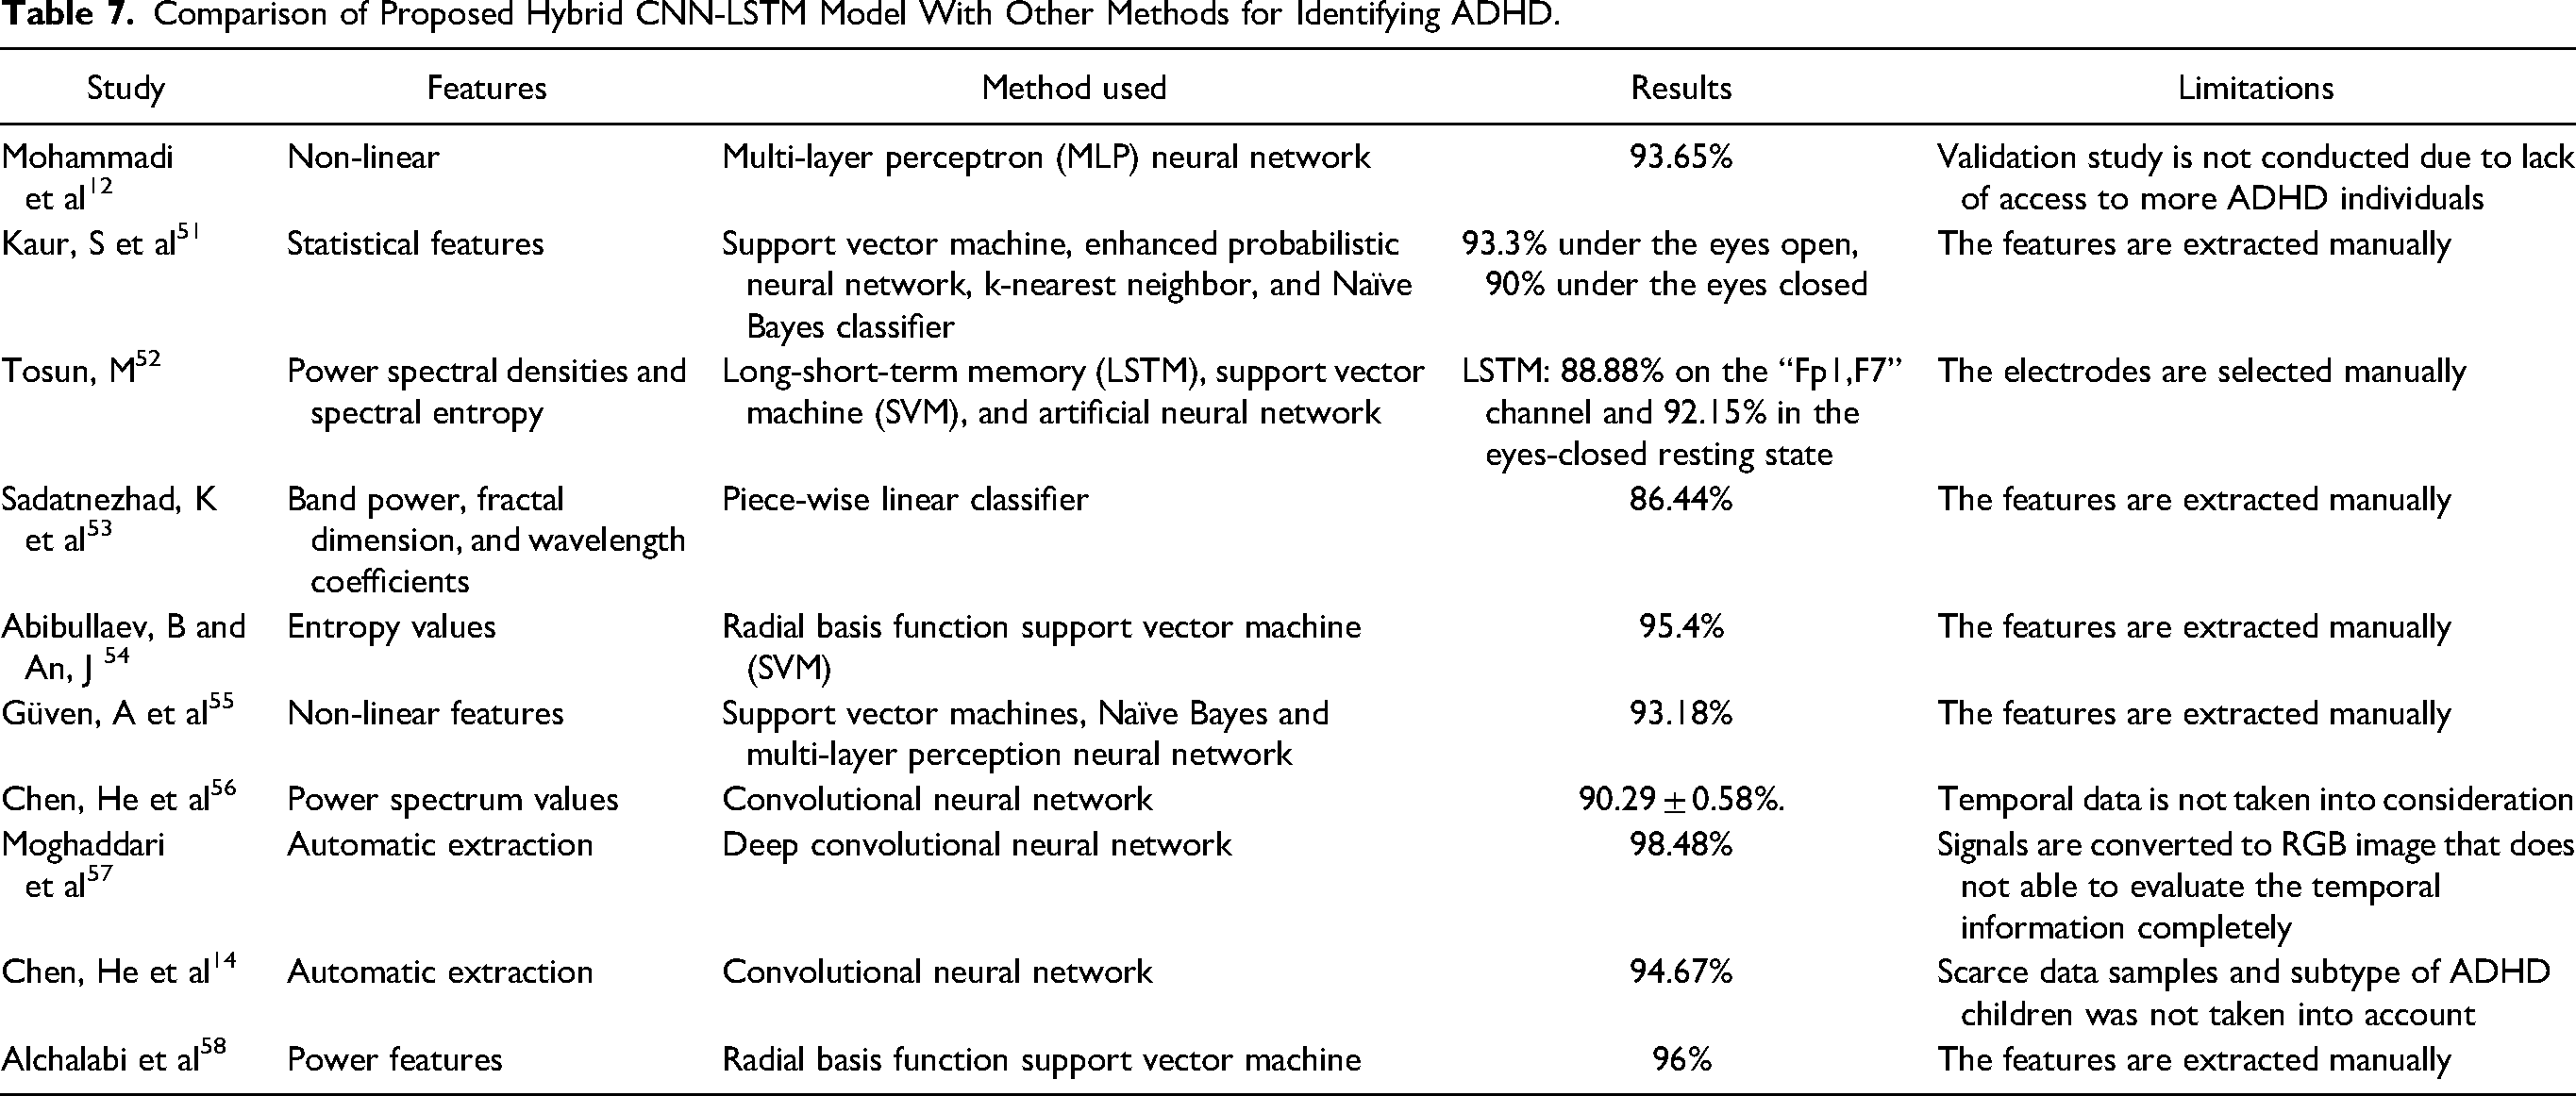
Comparison With State-of-the-Art Methods
The proposed hybrid CNN-LSTM model is compared to earlier research on the detection of ADHD using EEG data, and the comparison's findings are compiled in Table 7. When compared to current deep learning systems, the proposed hybrid CNN-LSTM model performs excellently in terms of accuracy. The earlier works presented a number of models employing machine learning algorithms using varied features such as entropy values,52,54 statistical features, 51 power features,52,56,58 and non-linear features.12,53,55 These methods are complex and required complicated feature extraction and reduction techniques. Contrarily, CNN are used and do not require any separate feature extraction techniques as here the feature extraction is performed automatically, but CNN could not effectively extract temporal information. Thus, this study's primary advantage is that it demonstrates good performance in diagnosing ADHD by leveraging both local characteristics and long-term dependencies of the EEG signals where CNN extracts spatial features and the LSTM network learns sequences from these features.
Comparison of Proposed Hybrid CNN-LSTM Model With Other Methods for Identifying ADHD.
However, the primary limitation of using deep learning in clinical practice is their lack of interpretability because deep learning models behave like a black box. As a result, the authors adopted visualization method t-SNE, which identifies semantic relationships between various classes and enables clinicians to comprehend the rationale behind subsequent classification. According to Kelly et al, 59 applications that are used in clinical settings require properly planned external validation. The suggested CNN-LSTM model was externally validated by the authors of this study using the FOCUS dataset and ADHD dataset, which may improve the applicability of the proposed CNN-LSTM model in clinical settings.
The findings of this study could have a wide range of clinical implications. Although the suggested hybrid CNN-LSTM model was only tested on a limited sample size of 60 patients, this method might be utilized to assist the diagnosis of ADHD and determine the variations on a single individual basis if it were to be validated using larger datasets. However, even if suggested hybrid CNN-LSTM are appropriately tested in the future on additional datasets and other neuroimaging techniques, this aids clinicians in determining whether the prediction pertains to a given patient and able to understand the model decision.
Feature Visualization
Lee and Verleysen (2007) 60 provide a survey of many non-linear dimensionality reduction methods with a focus on maintaining the local structure of data. Sammon mapping, 61 stochastic neighbor embedding (SNE), 62 isomap, 63 and maximum variance unfolding 64 are a few of these methods. These approaches perform well on synthetic datasets, but they are usually inadequate to visualize real, high-dimensional data. The aforementioned methods are not advised for accurate and ideal representation of factual and high-dimensional data because they fail to successfully keep both the local and global structures of the entire dataset in a single low-dimensional map.
t-SNE is capable of capturing much of the local structure of the high-dimensional data very well while also revealing global features that include existence of inter- and intra-cluster variations at several scales in the dataset. t-SNE, 20 a feature visualization method, alleviates the crowding problem by employing Student's t-distribution in low-dimensional space. Furthermore, t-SNE has been widely used for visualization of high-dimensional data from a wide range of applications in different domains.65–67 Thus, authors make use of t-SNE in order to get a clear and perfect visualization of the high-dimensional data with precise separations and to view used dataset represented features, which were mapped by a hybrid deep learning model, to make sure that the model successfully extracted features.
A multivariate analysis technique called principal component analysis (PCA) is designed to separate the most significant or crucial information from the input data into a collection of new orthogonal variables that it calls principal components. 68 We chose PCA as the standard reference for the comparison since it is a well-known technique for dimensionality reduction and is widely used. Figure 5 displays an arbitrary and non-deterministic representation of topological characteristics obtained for the ADHD dataset and FOCUS dataset from the last dense layer before classification using t-SNE having a perplexity of 40 and PCA. t-SNE outperforms PCA for both the datasets used, as illustrated in Figure 5. The PCA produces a linear correlation between data points; however, t-SNE extracts the non-linear correlation, allowing t-SNE to provide a more accurate clustering.
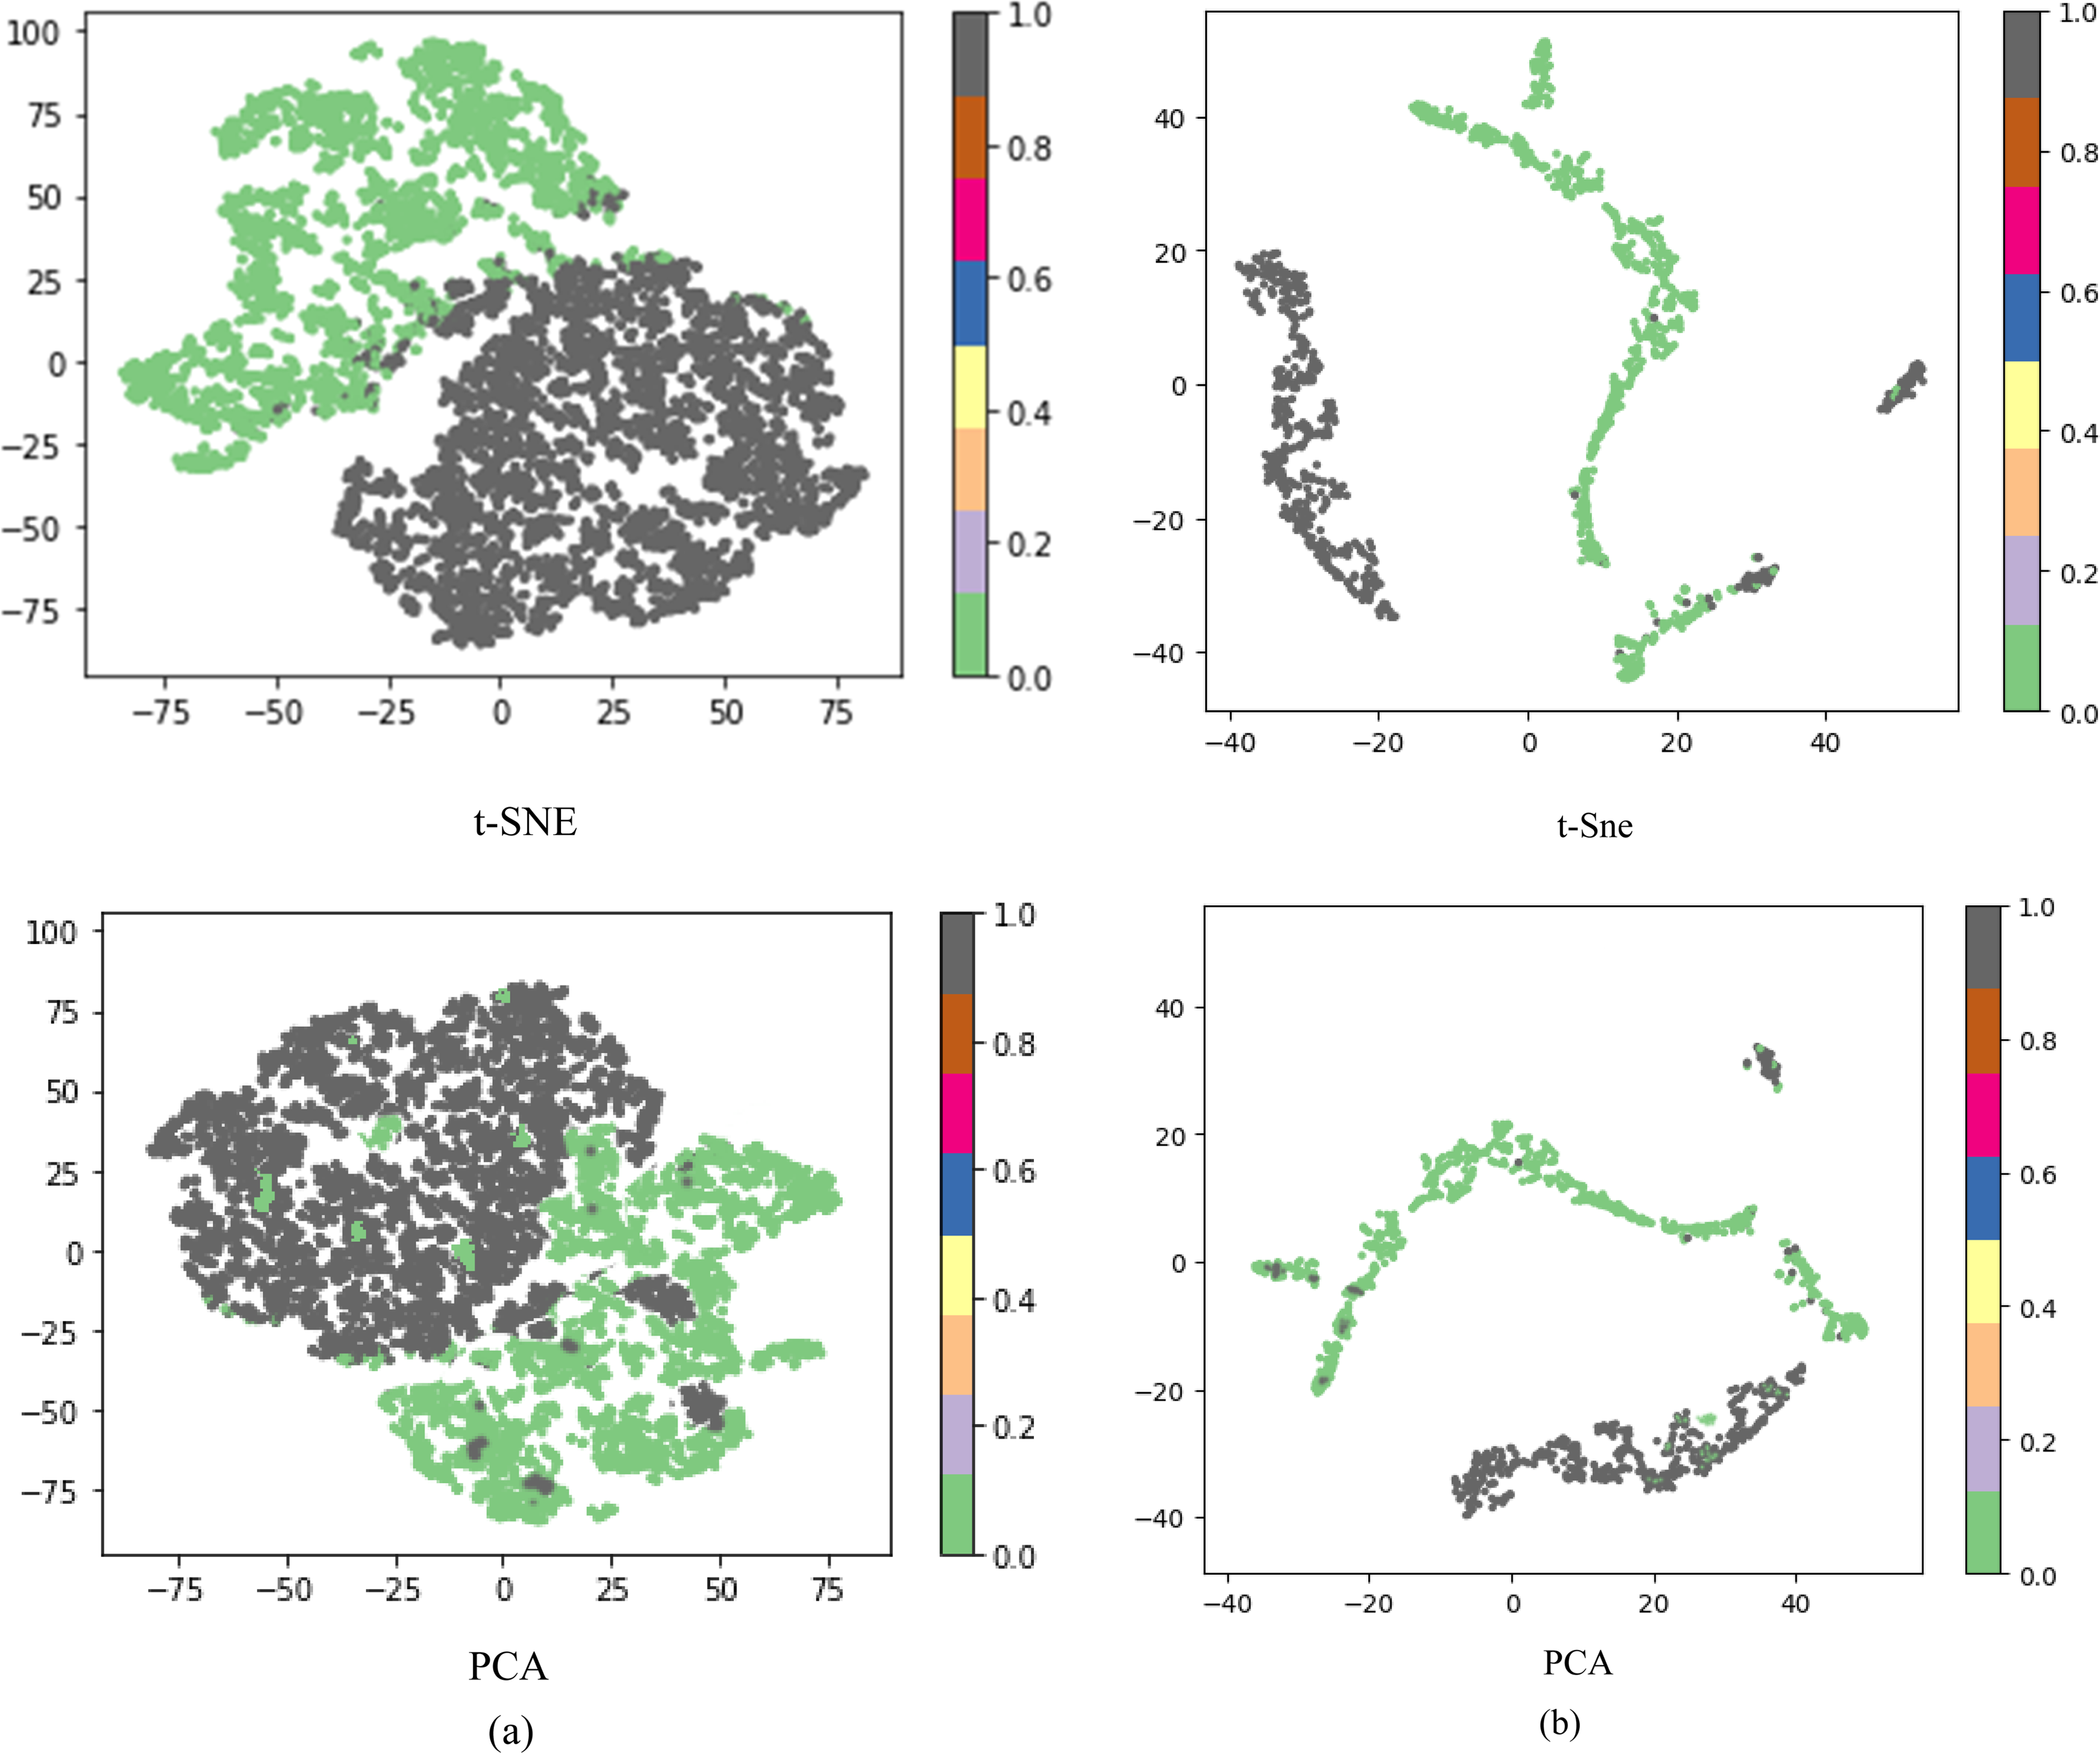
Feature visualization of ADHD control identification using t-SNE (left image) and PCA (right image) for (a) ADHD and (b) FOCUS datasets.
Effect of Selecting Channels on Decoding Accuracy
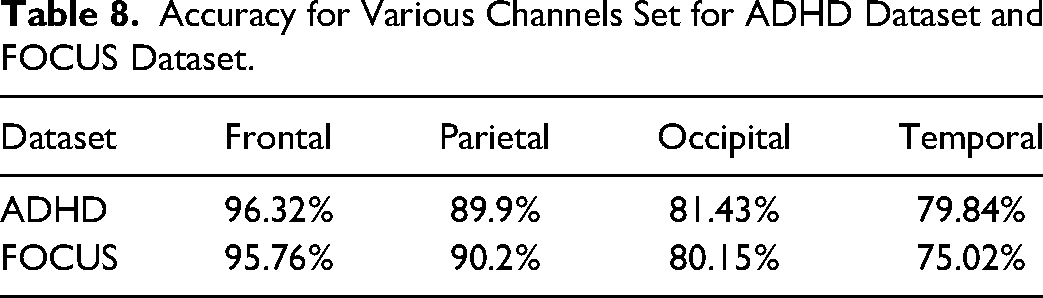
The authors trained the model using frontal (FP1, FP2, F7, F3, FZ, F4, and F8), parietal (P3, PZ, and P4), occipital (O1, O2), and temporal (T3, T4, T5, and T6) channels to access the performance of various channel sets. It was discovered that frontal and parietal channels perform more accurately in identifying ADHD patients than occipital and temporal channels. According to both of the datasets analyzed as illustrated in Table 8, frontal channels predominate in the differentiation of individuals with ADHD from controls. This outcome is in line with earlier studies 13 that used machine learning techniques to identify individuals with ADHD. Thus, it may be inferred from the findings of this study and previous research that the frontal channels of the EEG data contribute more to the distinction between the controls and individuals with ADHD and may be linked to higher degrees of hyperactivity and impulsivity.
Accuracy for Various Channels Set for ADHD Dataset and FOCUS Dataset.
Limitations and Areas for Future Research
Despite the fact that the current work significantly reduces the requirement for manual feature extraction and enhances performance, it is still difficult to interpret the learned features, that is, it lacks interpretability. The interpretability of the model helps comprehend which EEG features had better discriminated the examined class, increasing the understanding of the neuropsychological variations of the ADHD individuals. In order to provide outcomes that are understandable and advance our knowledge of how the network learns from input representation sets, the idea of intermediate feature visualizations has been investigated.69,70 Similar to that, correlation maps71,72 and saliency maps 73 are used to create visualizations. Another approach for interpretability is to add interpretable layers to the network architecture. In the future, the authors would investigate the use of explainable deep learning model such as ConvNet or use of explainable methods like saliency maps with improved data augmentation methods on larger datasets.
The small sample size restricts the generalizability of the findings. Only 2 publicly accessible datasets were employed, which limits the validation of the proposed hybrid CNN-LSTM model and makes it hard to determine the model's confidence level. The use of machine learning and deep learning models to classify ADHD patients based on EEG signals is relatively new; this study explores the use of the hybrid CNN-LSTM model in classification of ADHD individuals and healthy controls, and the results are promising on the 2 datasets use, however with a limitation that result might not be representative of the general population. Nevertheless, this study provides a good starting foundation for further exploration of using hybrid deep learning models in identification of ADHD individuals using EEG signals. Further, the authors intend to gather enough substantial data to validate the model on independent subjects, allowing clinicians to assess whether the prediction holds true for that particular patient which may provide clinical applicability and reliable generalizability to new populations.
Further, there are both male and female subjects in the FOCUS database, although there are significantly more males. To balance both groups, the authors used IPW. The small sample size makes it challenging to determine if males and females experience ADHD differently. Future work will focus on developing classification models for the dataset with gender balance population.
Conclusion
The authors in this study proposed a hybrid CNN-LSTM model with robust performance for identifying patients using EEG signals. The proposed model can precisely differentiate between normal and ADHD patients by combining CNN and an LSTM. The LSTM network can recall and recognize successive EEG data, whereas the CNN can extract characteristics from EEG signals. The experiments were carried out on the 2 publicly available datasets on the IEEE data port for ADHD/control to validate the performance of the proposed model. The model's accuracy in the ADHD dataset and the FOCUS dataset was 98.86% and 98.95%, respectively. t-SNE, a visualization tool, was also used to strengthen the proposed model's interpretability. The results indicated that combining temporal and spatial EEG characteristics could be a valuable and discriminative technique for ADHD diagnosis.
Footnotes
Declaration of Conflicting Interests
The authors declared no potential conflicts of interest with respect to the research, authorship, and/or publication of this article.
Funding
The authors received no financial support for the research, authorship, and/or publication of this article.
Ethical Approval
The datasets used by the authors are publically available on IEEE data port. The Institutional Review Board (IRB) and Ethical Committee of Tehran University of Medical Sciences (TUMS) approved the ADHD dataset.